 N O T I C E
MSPbots WIKI is moving to a new home at support.mspbots.ai![]() to give you the best experience in browsing our Knowledge Base resources and addressing your concerns. Click here
to give you the best experience in browsing our Knowledge Base resources and addressing your concerns. Click here![]() for more info!
for more info!
N O T I C E
MSPbots WIKI is moving to a new home at support.mspbots.ai![]() to give you the best experience in browsing our Knowledge Base resources and addressing your concerns. Click here
to give you the best experience in browsing our Knowledge Base resources and addressing your concerns. Click here![]() for more info!
for more info!
This article shows the N-able Benchmarking process and the step-by-step guide on how to set up your N-able benchmark and quarterly updates with MSPbots.
N-able Benchmarking Process
The N-able Benchmarking process diagram below gives an overview of how to set up your N-able benchmark.
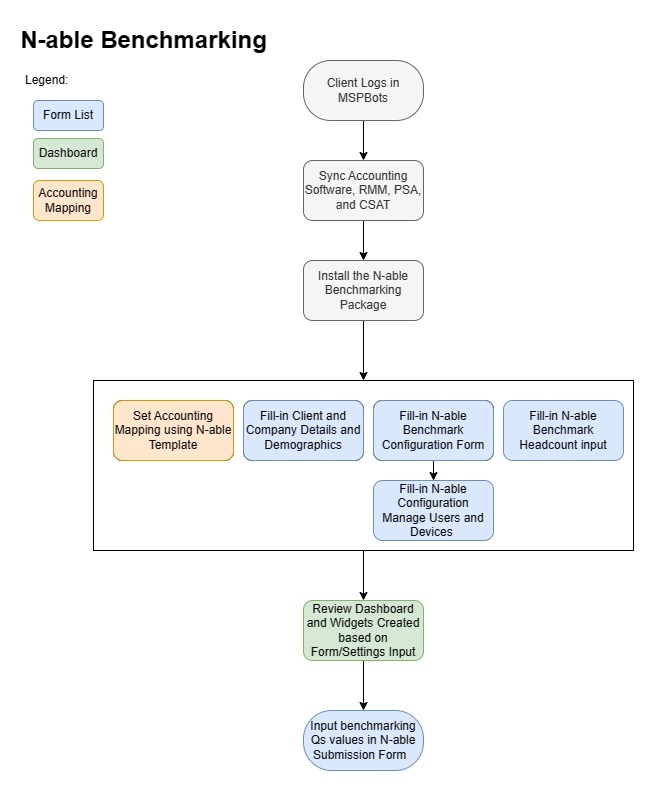
Step 1. Sync your software with MSPbots
Visit the Integrations page in the MSPbots Help Center for instructions on how to connect your software to MSPbots.
Step 2. Install the N-able benchmarking package.
- Log in to the MSPbots app and go to Marketplace > Apps.
- Locate the N-able Benchmarking package and click on it to install.

Note: Currently, the APP installation is by-demand after signup. Please send your request to install to our partner MSPAdvisor dave@mspadvisor.com or email us at support@mspbots.ai.
Step 3. Set up your Accounting Mapping using the N-able template.
Your accounting software must be fully integrated with MSPbots before you can successfully set up Accounting Mapping.
1. On the MSPbots app, click Settings > Accounting Mapping. 
2. On the Accounting Mapping tab, go to the Accounting Dashboard section.
3. Select your Accounting Software integration, e.g. Quickbooks Online, and click the Profit & Loss Statement option.

4. Go to the Map to section, and select N-able Benchmark from the templates.

5. Next, categorize by dragging and dropping the accounts from the left to the correct mapping on the right.
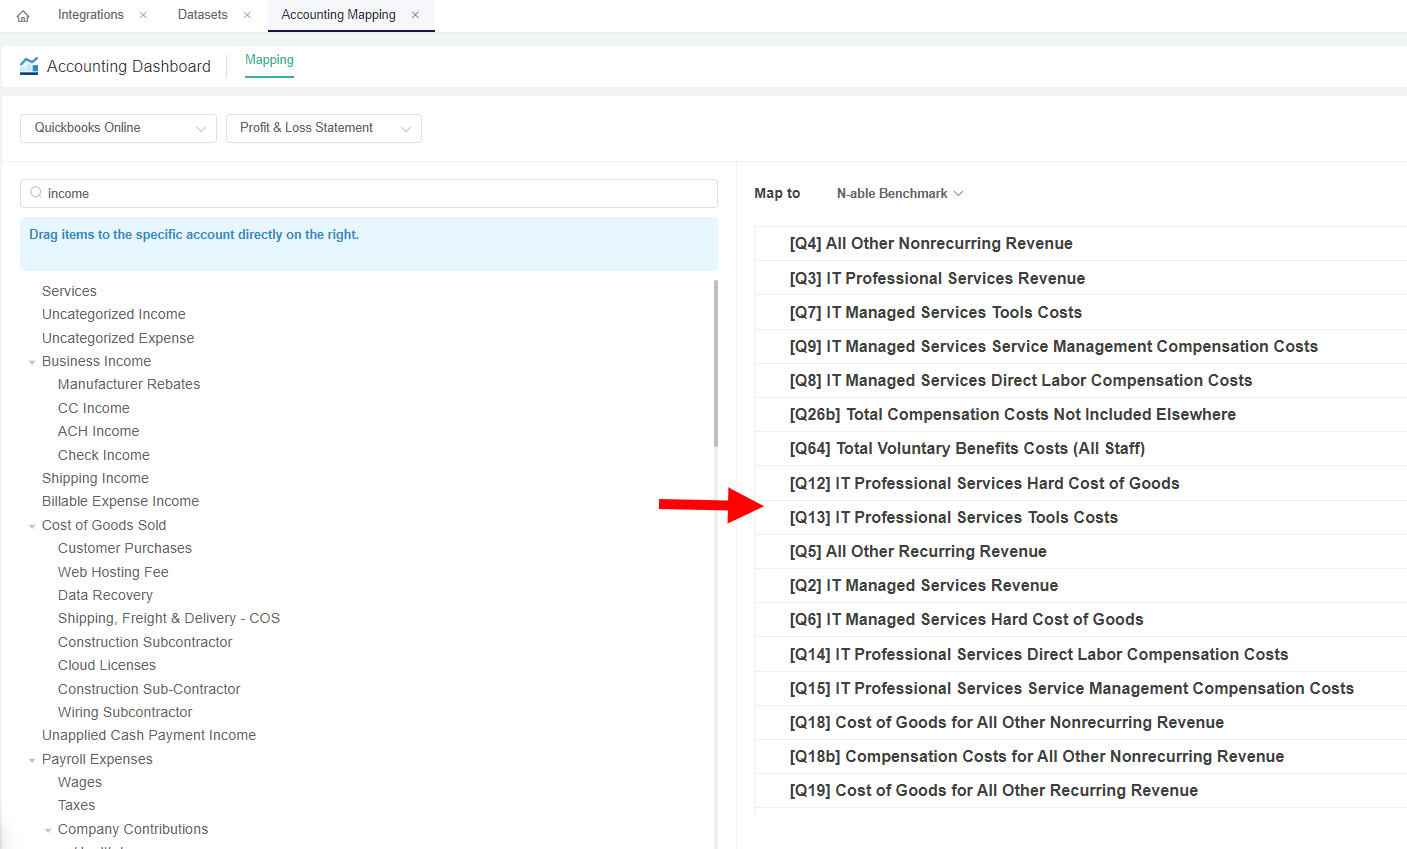
5. Click the Save button to save the mapping.
Step 4. Configure your N-able benchmark categories.
1. Go to Apps on the MSPbots app.
2. Locate N-able Benchmarking on the My Applications page and click on it to open. 
Note: Currently, the APP installation is by-demand after signup. Please send your request to install to our partner MSPAdvisor dave@mspadvisor.com or email us at support@mspbots.ai.
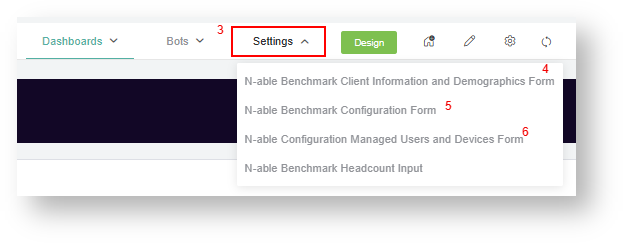
3. Go to Settings and select each configuration forms.

4. Click N-able Benchmark Client Information and Demographics Form. Then, input details and click submit.
The N-able Benchmark Client Information and Demographics Form is where you input your company details, demographics, and accounting period setup.
5. Click N-able Benchmark Configuration Form. Then, go through each category setup and click submit.
The N-able Benchmark Configuration Form is where you configure each Qs benchmark category to get your values result.
Set Include or exclude the lists of filters for each category type (Managed Service, Professional Service, RMM works, Proactive works, Automation, and Top 3 clients etc.) as basis for the system for the calculation.
6. Click N-able Configuration Managed Users and Devices Form. Then, go through each setup and click submit.
This is where you add supplementary setups for your Managed Services in relation to Product Additions/ Services.
Step 5. Update and allocate your N-able Headcount % Labor FTE
1. Open the N-able Benchmarking app.
2. Go to Settings and click N-able Benchmark - Headcount Input.
3. Refer to N-able Headcount Q Benchmark Reference-Last Quarter widget for the auto-calculated allocation percentage results between your Professional Services, Managed Services and Non-Ticket Service Tickets Hours.
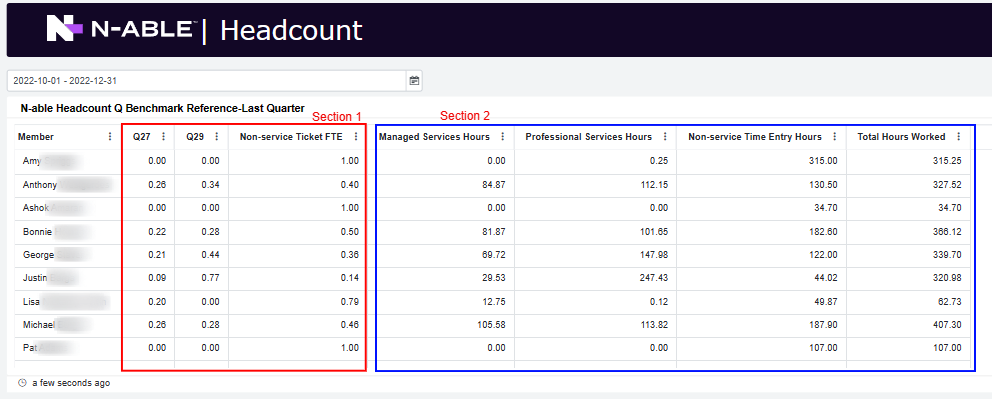
4. Hover to the N-able Headcount Form Input Form and manually allocate your % Labor FTE for each headcount. You can override or used the Q27 and Q29 Direct Labor FTE previous quarter results.
For each column, input your member % Labor FTE Count per Qs resources. This includes the allocation for IT Managed Services, IT Professional Services, Sales and Marketing, Management, All other costs, and Resources No Included. 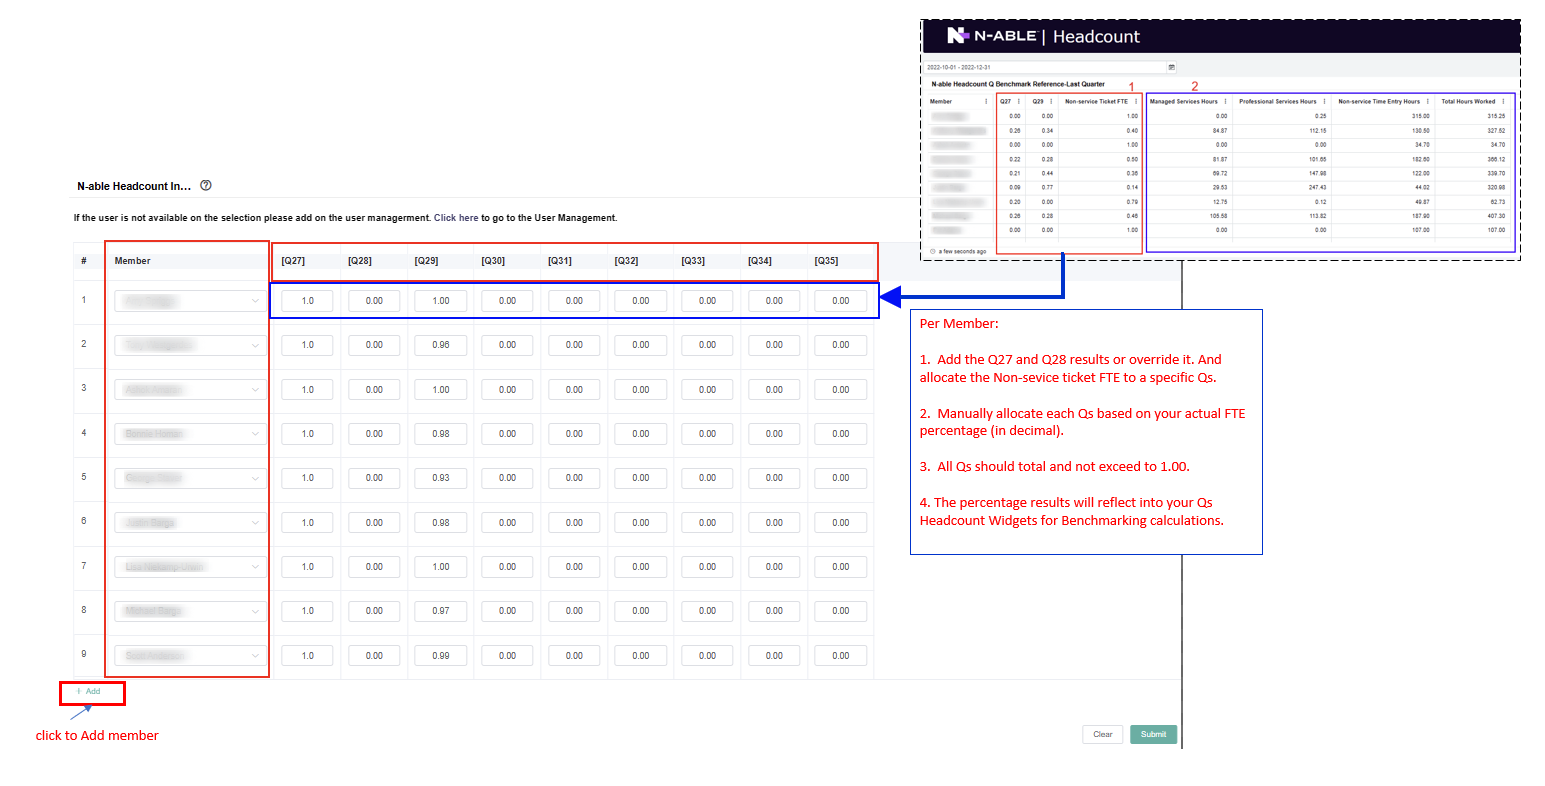
The percentage allocation should be in decimal values (total 1.00 max value)
5. Click Submit. The manual inputted data in the form will be the basis for the calculation.
6. Click + Add, if there are missing headcount. Then, follow through Step 4 - 6.
Step 6. Review the previous quarter's results
You should have completed the following before you can review the dashboards:
- Accounting Mapping setup
- N-able Configuration setup
- N-able Headcount input
N-able Benchmarking - Qs Yearly Results
This dashboard displays the previous quarter's results per category. To review this dashboard:
- Open the N-able Benchmarking app.
- Go to Dashboards and click N-able Benchmark - Qs Yearly Results.
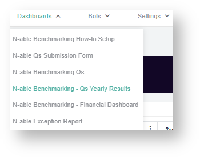
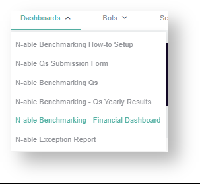
N-able Benchmarking - Financial Dashboard
This displays the monthly and quarterly total amount per categories (Qs) in a given year.
To review this dashboard:
- Open the N-able Benchmarking app.
Go to Dashboards and click N-able Benchmark - Financial Dashboard.
Step 7. Input your Q values for benchmarking.
The N-able Qs Benchmark dashboard contains the form for your Qs value input needed for the benchmarking per Quarter:
- At the end of each Quarter, you can create a new Q Benchmark record.
- The form automatically pulls in the various Q values for the previous quarter's results.
- You can also opt to manually input the data for the benchmark in the manual column.
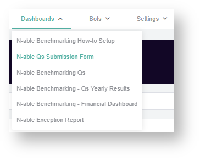
To access the N-able Qs Benchmark form:
1. Open the N-able Benchmarking app.
2. Go to Dashboards and click N-able Qs Submission Form.
3. Add a new benchmark record by clicking the New button.

4. Updating the Q Benchmark form.
4.1. Select a Year.
4.2. Select a Quarter.
4.3. Switch ON publish to MSP Advisor ![]() to publish the result.
to publish the result.
4.4. Scroll down on the column for Qs Category (Financial / Profitability) to see their definitions and all the Qs categories for input.
4.5. Go to the Automatic column to see the previous quarter's Qs results from data automatically.
4.6. Enter a new value in the Manual column if you prefer not to use the automatic data. The app will use the manual data over the automatic result.
If the Automatic column shows a value of zero (0), then you need to manually input your Qs data.
5. After updating all the Q values, click ![]() button to save the record.
button to save the record.
Step 8. View your Qs widget benchmarking results.
To view the N-able Benchmarking Qs Widgets calculation results per category:
- Open the N-able Benchmarking.
- Go to Dashboards and click the N-able Qs Benchmarking

Step 9. Review any exception tickets.
To access the N-able Exception Report:
1. Open the N-able Benchmarking.
2. Go to Dashboards and click the N-able Exception Report
3. Exception data pertains to tickets that did not meet the logical setup based on your N-able Benchmark Configuration (refer to Step 4).
These are:
- Non-service Time Entries
- Dual service Tickets (Ticket tagged as both Managed and Professional)
- Uncategorized Service Tickets
- Implied Professional Service Tickets
The N-able exception report helps you on your review and analysis in order to properly set up your benchmark configurations.
Overview
Content Tools
N O T I C E
MSPbots WIKI is moving to a new home at support.mspbots.ai![]() to give you the best experience in browsing our Knowledge Base resources and addressing your concerns. Click here
to give you the best experience in browsing our Knowledge Base resources and addressing your concerns. Click here![]() for more info!
for more info!