N O T I C E
MSPbots WIKI is moving to a new home at support.mspbots.ai to give you the best experience in browsing our Knowledge Base resources and addressing your concerns. Click here for more info!
Page tree
Browse pages
N O T I C E
MSPbots WIKI is moving to a new home at support.mspbots.ai to give you the best experience in browsing our Knowledge Base resources and addressing your concerns. Click here for more info!
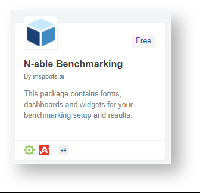
3. Under My Application page, Search N-able Benchmarking. Click to open.
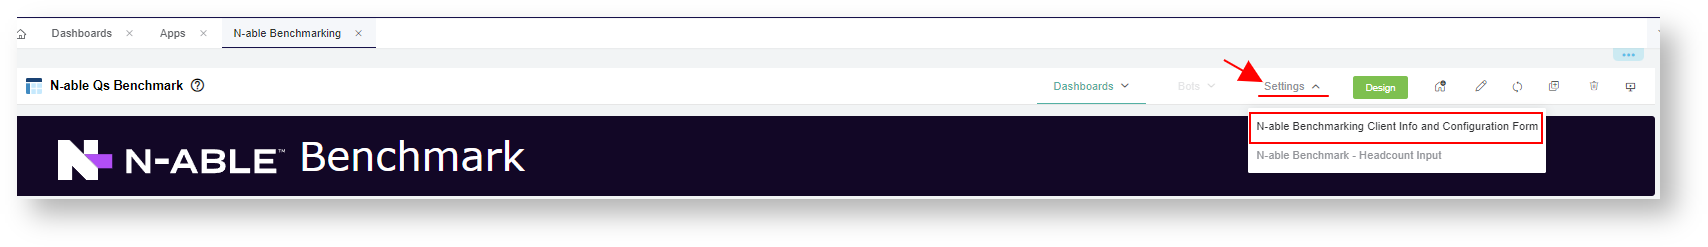
4. Hover into Settings menu. Then, click N-able Benchmarking Client Info and Configuration Form
5. Follow the steps on how-to configure the N-Able Client and Benchmark Configuration Form.
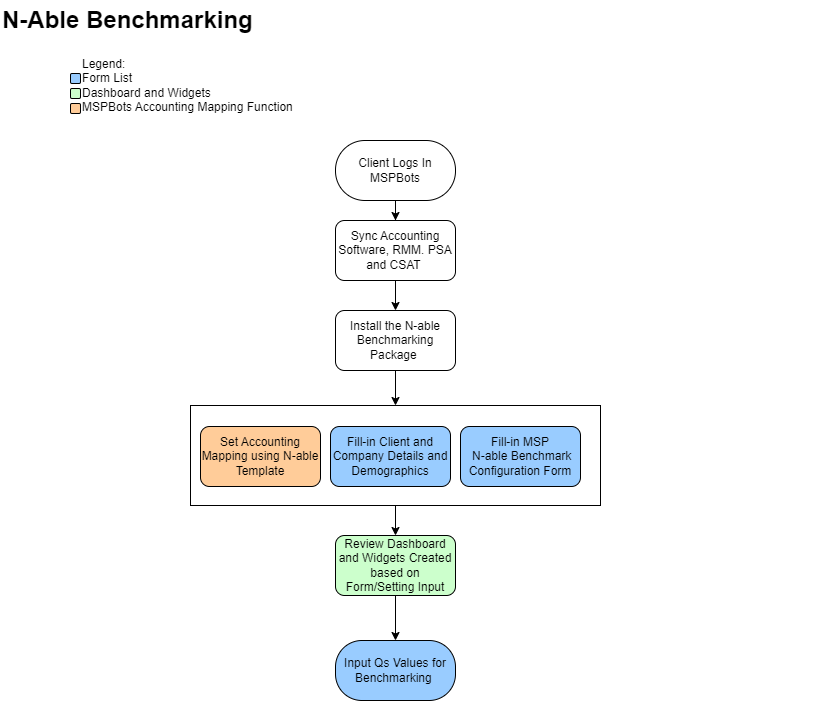
The dashboard contains three (3) forms with a designated submit button for each. Once you complete in updating the filters and fields always remember to click each submit buttons to save the data.
Form Name
Description
Section/Categories
Fields
Steps
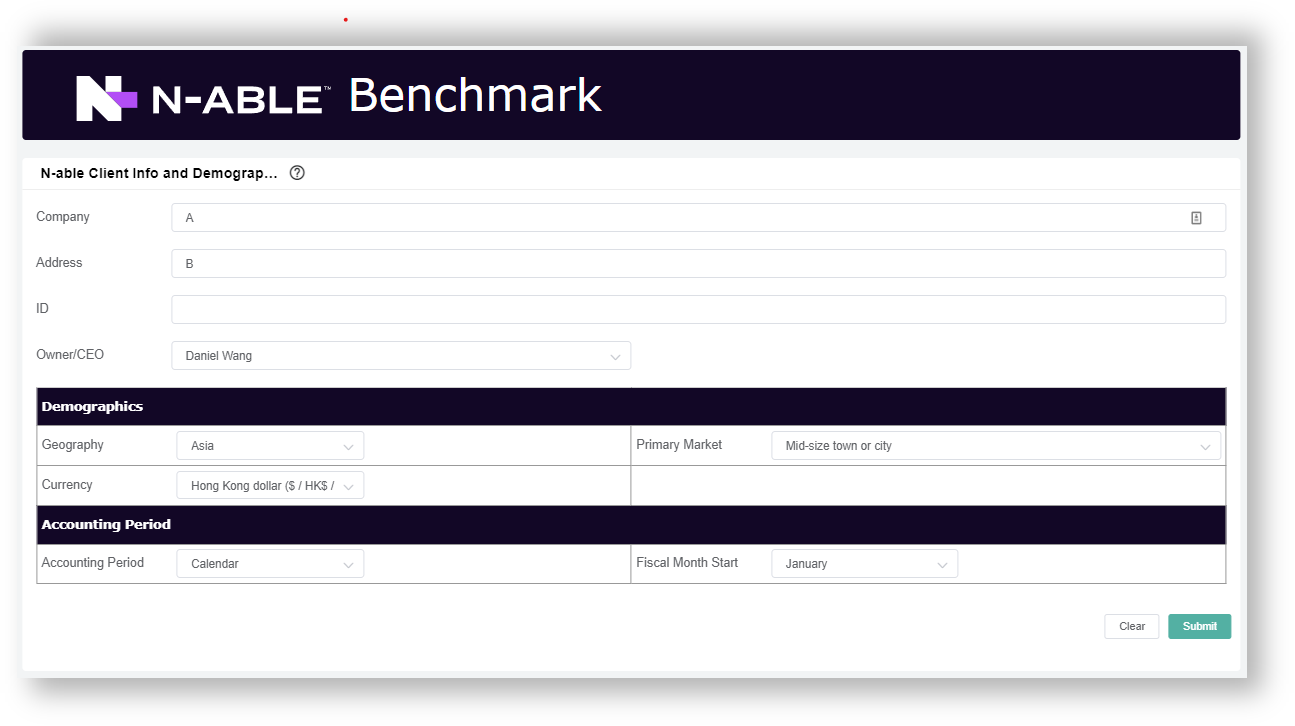
N-able Client Info and Demographics Form:
This is where you input your company details, demographics and accounting period setup.
Client Info Fields
Demographics
Accounting period
1. Update the ff:
Company - input company name
Address - Input your company address
Owner/CEO/Contract - select from the drop down list of names
Geography - In what geography do you primarily operate?
Primary Market - select the type of primary market which you operate
Currency - Select the currency to which your answers are entered
Accounting Period - Select your accounting period either calendar/fiscal
Fiscal Month Start - select your fiscal month start
2. Click Submit.
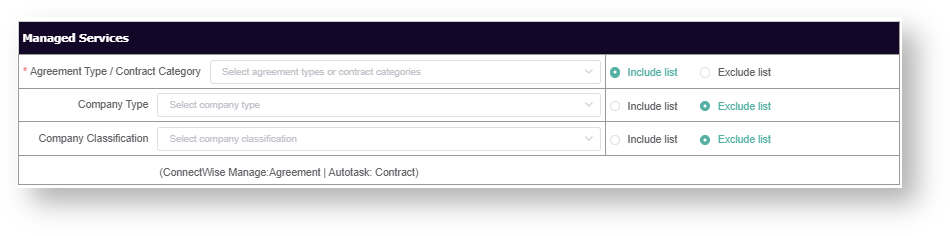
N-able Benchmark Configuration Form
This is where you configure your categories .
Include or exclude the lists of filter for each categories type.
Managed Services
1. Select the filter types for the ff:
Agreement Type / Contract Category - Agreement types for ConnectWise and Contracts for Autotask.
Company Type
Company Classification
2. For each field select either "Include List" or "Exclude List".
To select ALL filter types, empty the field and select the "Exclude list" radio box.
To filter only specific types, check only those filter/s and then click the "Include List" radio box.
If you want to exclude specific filter types, check only those filter and then click "Exclude List" radio box.
If you select "Include List" radio box and empty filters, this will result to no value (NULL).
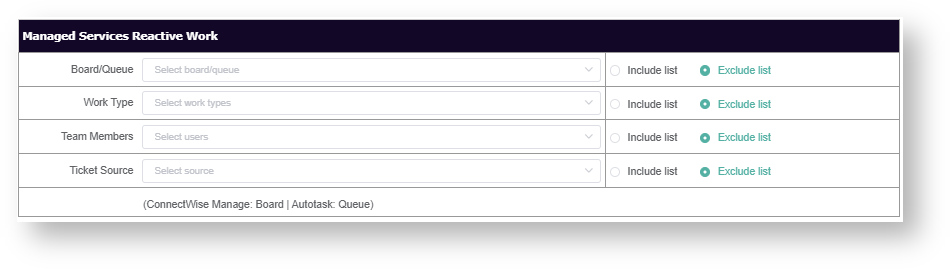
Managed Services Reactive Work
3. Select the filter types for the ff:
Board/Queue -select Board types for Connectwise and Queues for Autotasks
Work Type
Team Members
Ticket Source
4. For each field select either "Include List" or "Exclude List".(see note at step 2)
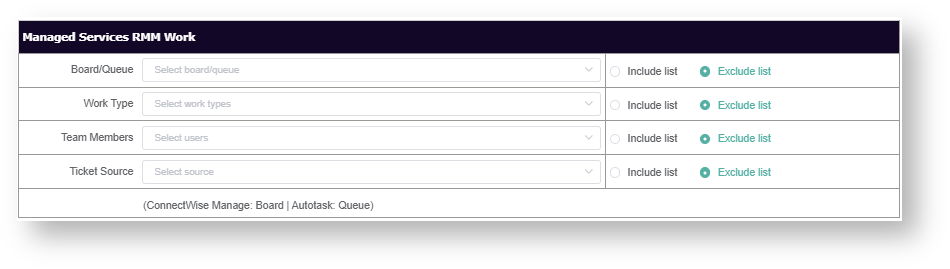
Managed Services RMM Work
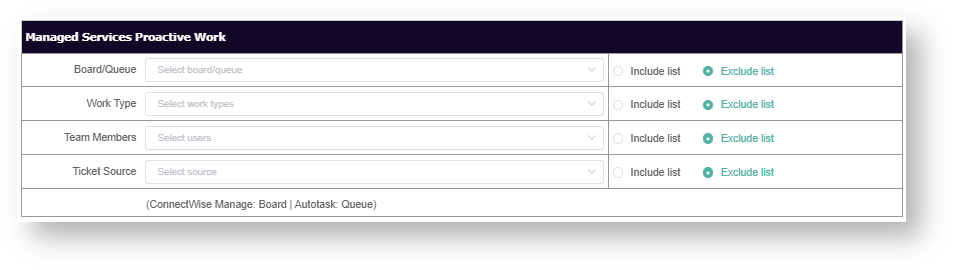
Managed Services Proactive Work
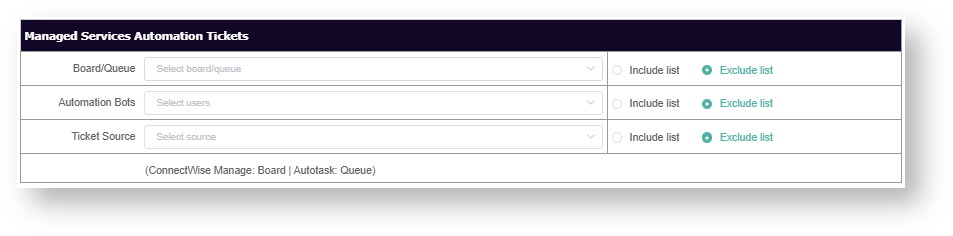
Managed Services Automation Tickets
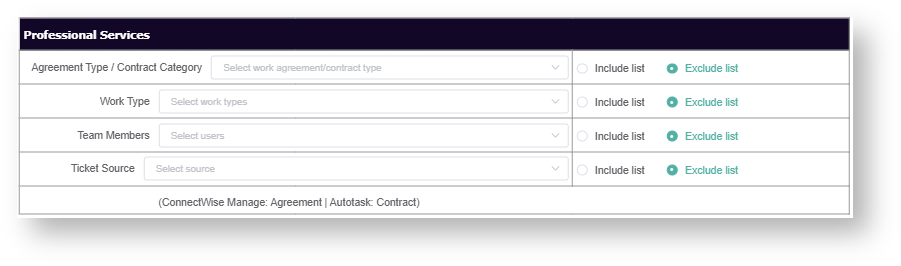
Professional Services
5. Select the filter types for the ff:
Agreement Type/ Contract Category
Work Type
Team Members
Ticket Source
6. For each field select either "Include List" or "Exclude List".(see note at step 2)
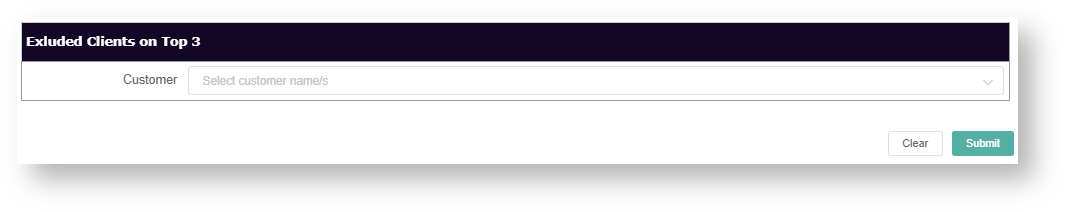
Excluded Client on Top 3
7. Select the customer/s you want to exclude in the Top 3 Clients results.
8. Click Submit.
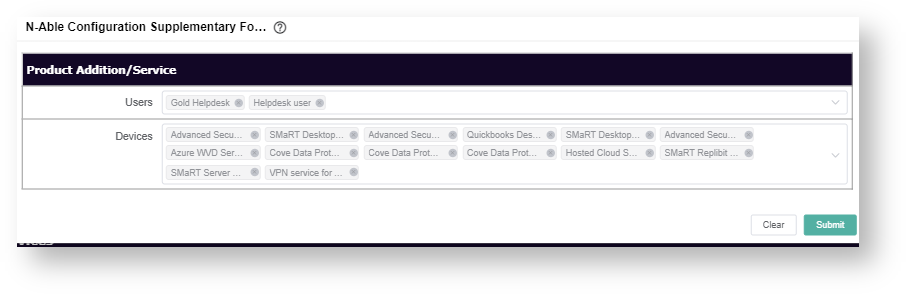
N-able Configuration Supplementary Form
This is where to add the Managed Services: Product Additions/ Services
Product Addition or Services
Prerequisite:
Submission of the N-able Benchmark Configuration Form.
The filter results will take into account the Agreement Types/Contract for Managed Services submitted as basis for the needed type of additions.
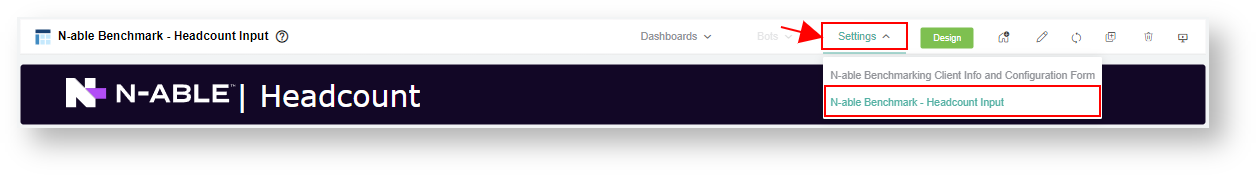
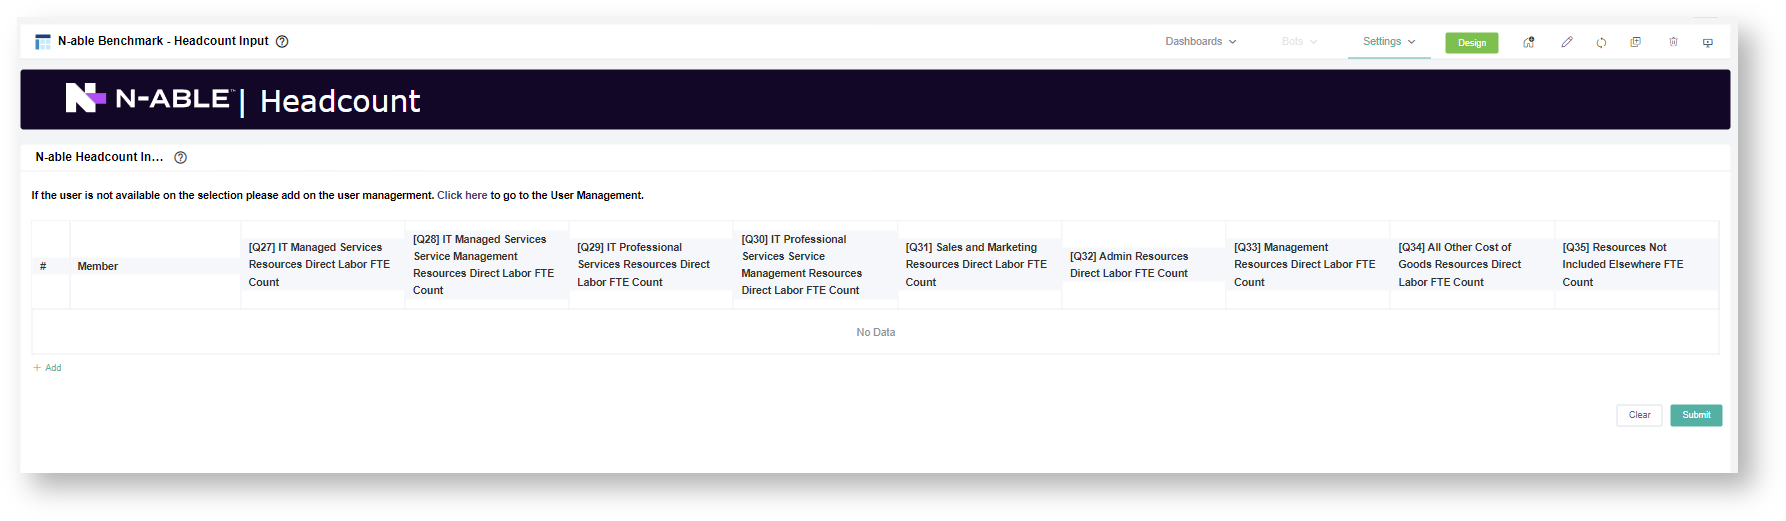
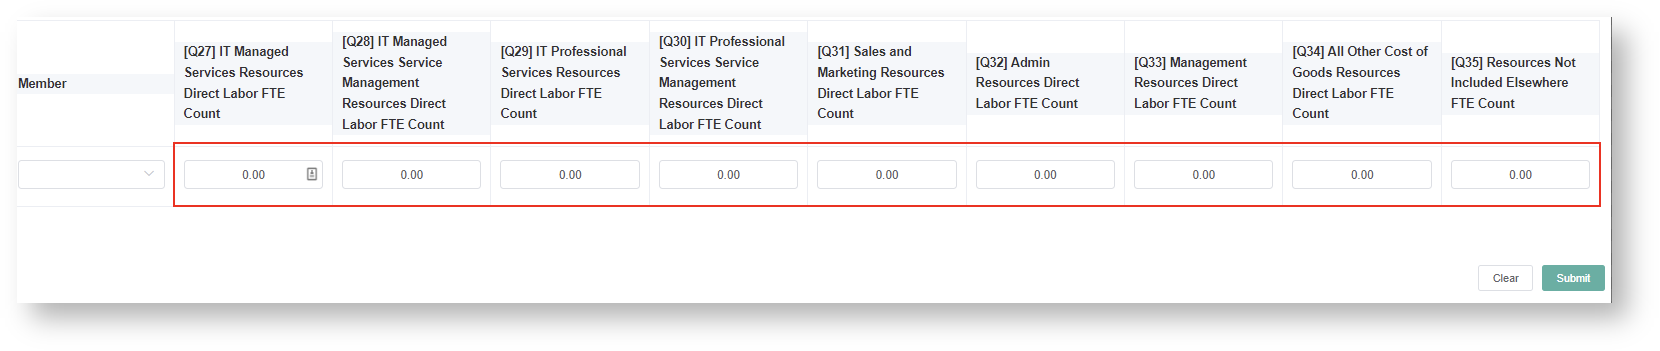
2. Hover to the Settings menu. Then, click N-able Benchmark - Headcount Input
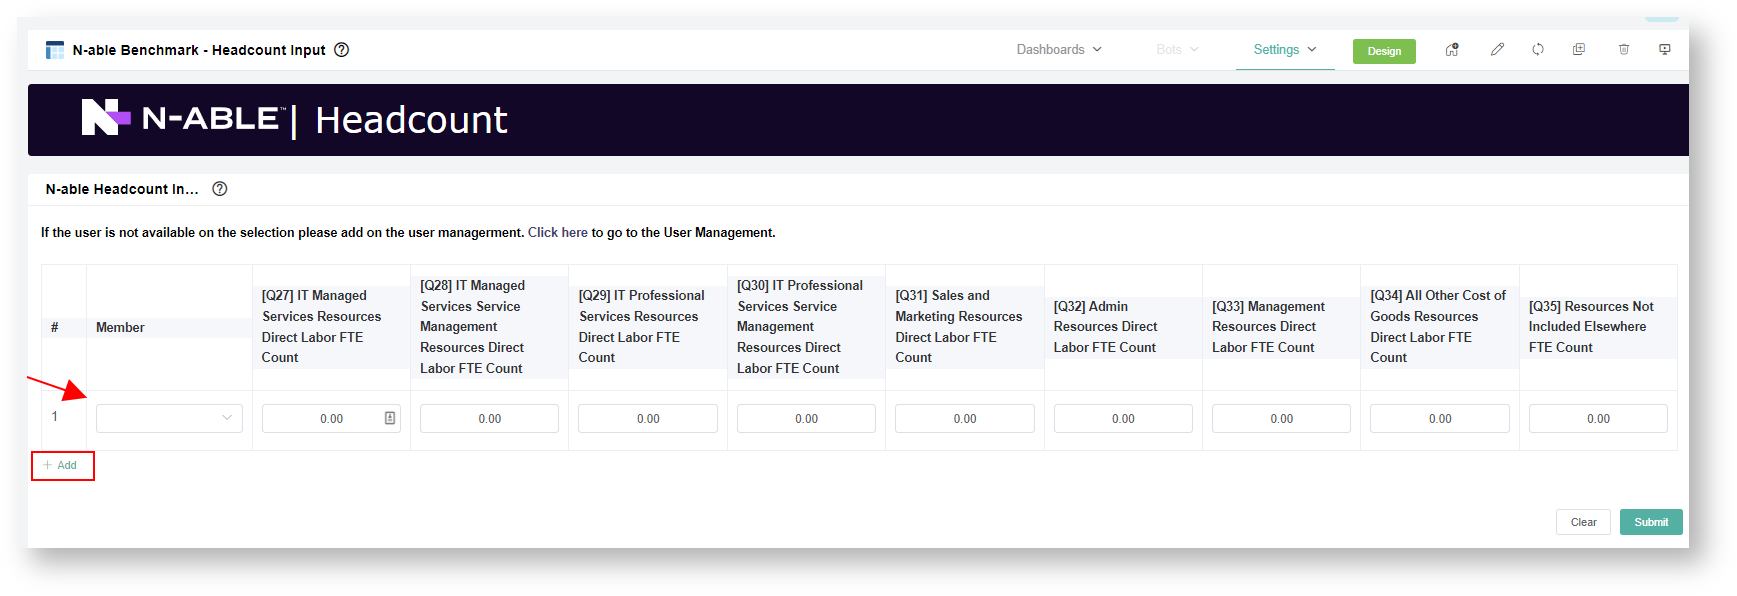
3. To add new member, click + Add.
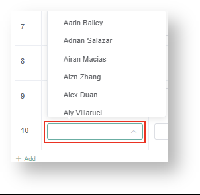
4. Then click the drop-down member field to select the specific user. The member list drop-down is based on your AAD user lists.
Note: For instance if the member name is not found in the drop-down list. You need to add him/her on your AAD. MSPbots will sync your AD change in 10 minutes.
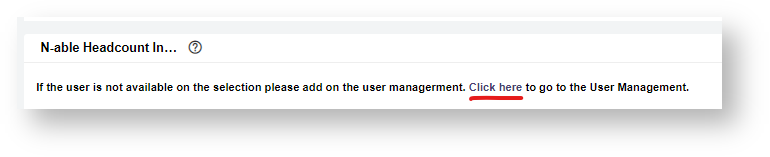
On the top of the N-able Headcount form, Click the "click here" to go to the User Management page.
5. For each column, Input your member % Labor FTE Count per Qs resources ( allocation for IT Managed Services, IT Professional Services, Sales and Marketing, Management, All other costs, and Resources No Included)
The percentage allocation should be in decimal values.
5. Click Submit.
Step 6 - Review the Previous Quarter Results
Prerequisites:
Completed the following:
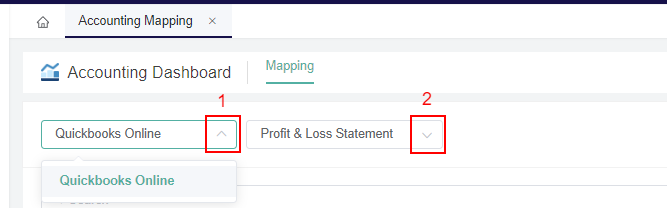
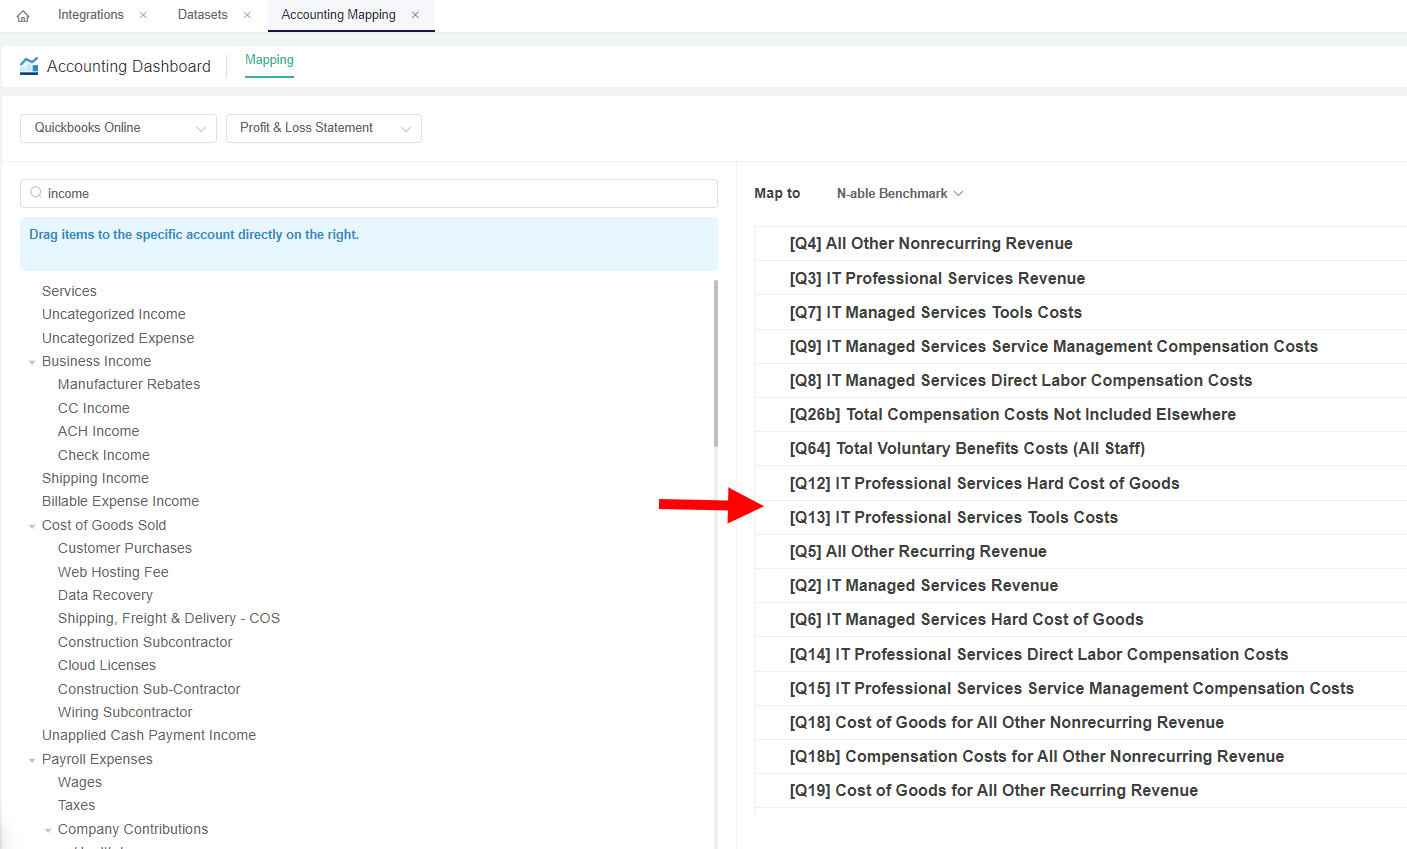
Accounting Mapping setup
N-able Configuration setup
N-able Headcount input
1. Open the the N-able Benchmarking app
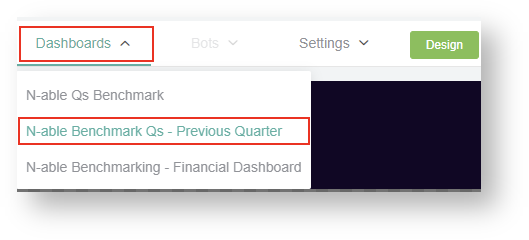
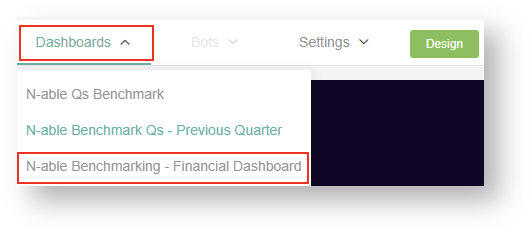
2. Hover to the Dashboard menu. Then, click N-able Benchmark - Previous Quarter
Dashboard
Description
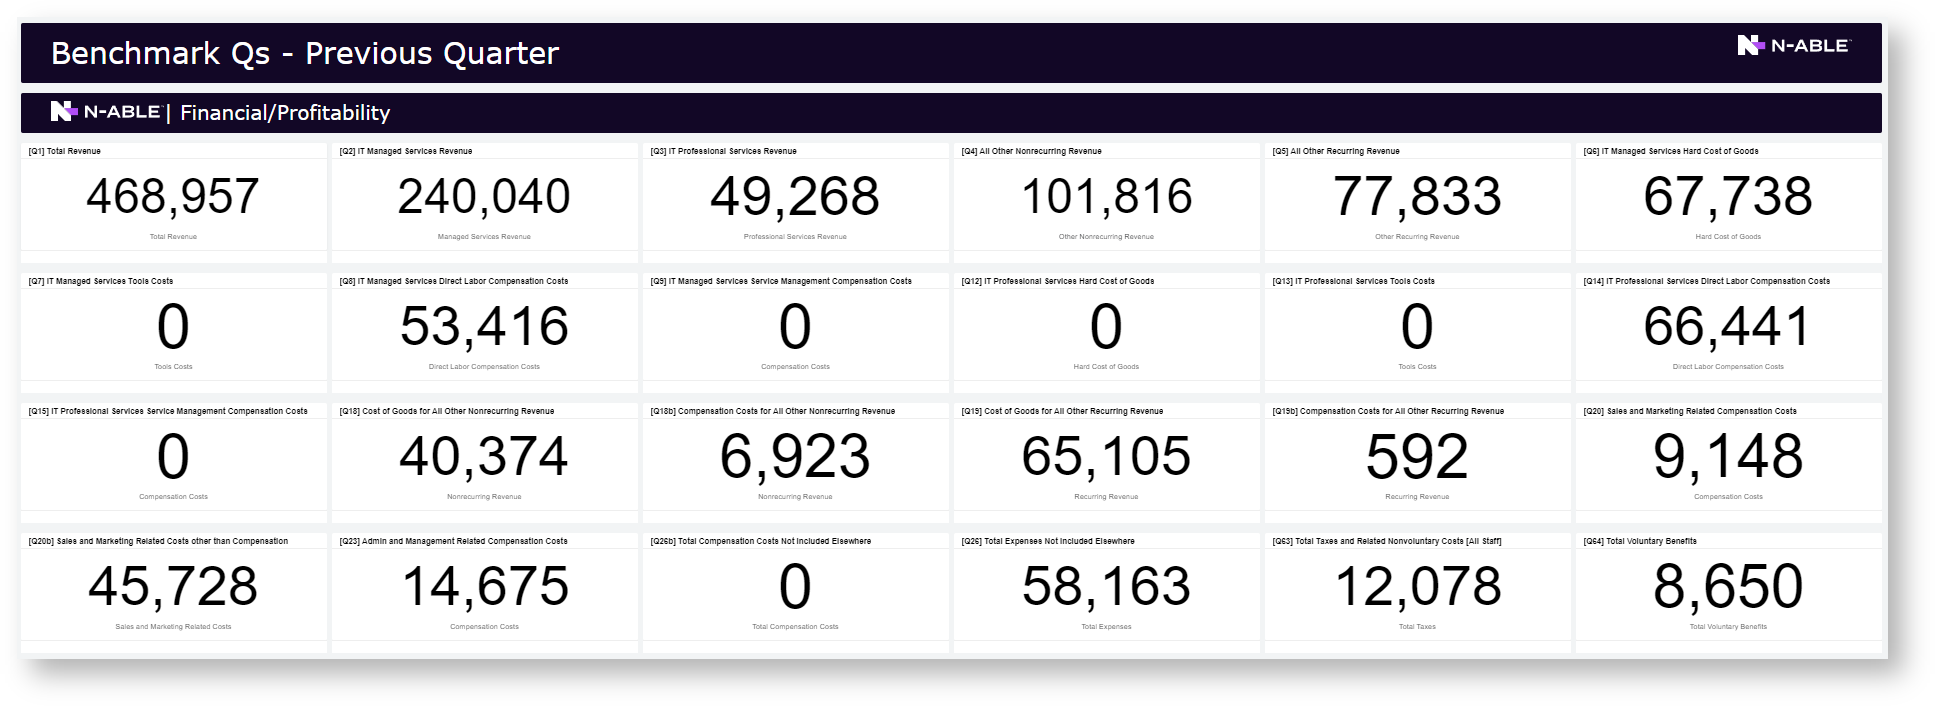
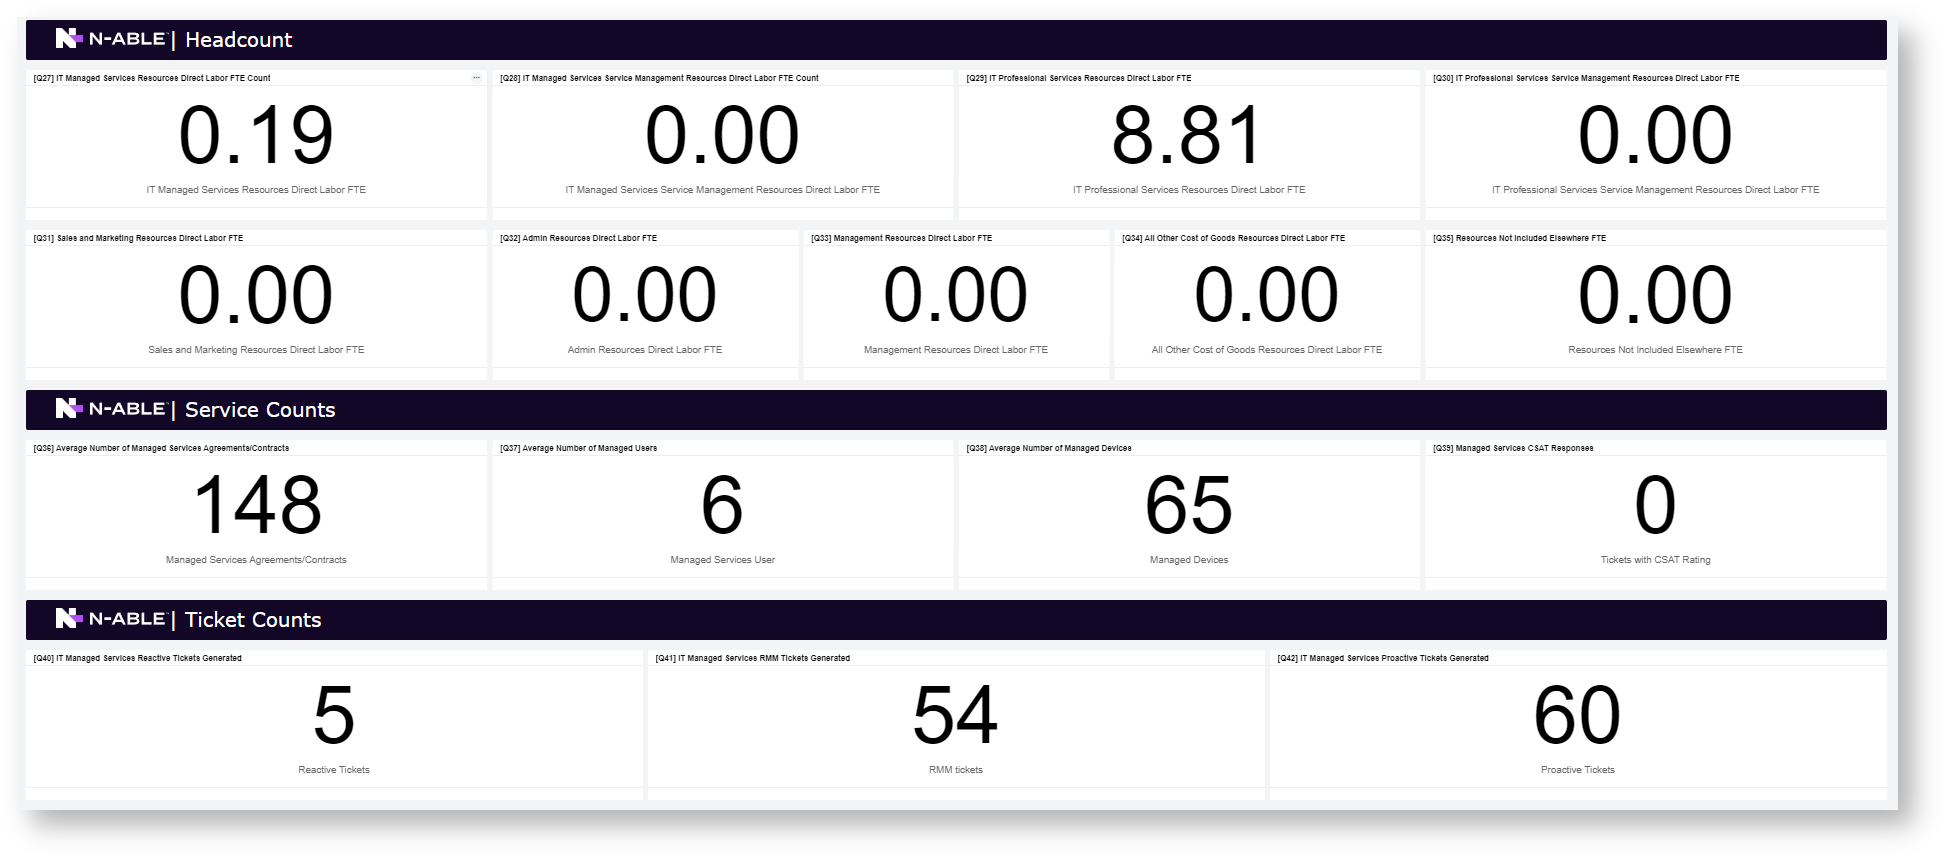
N-Able Benchmarking - Previous Quarter
A dashboard that displays the previous quarter results per categories.
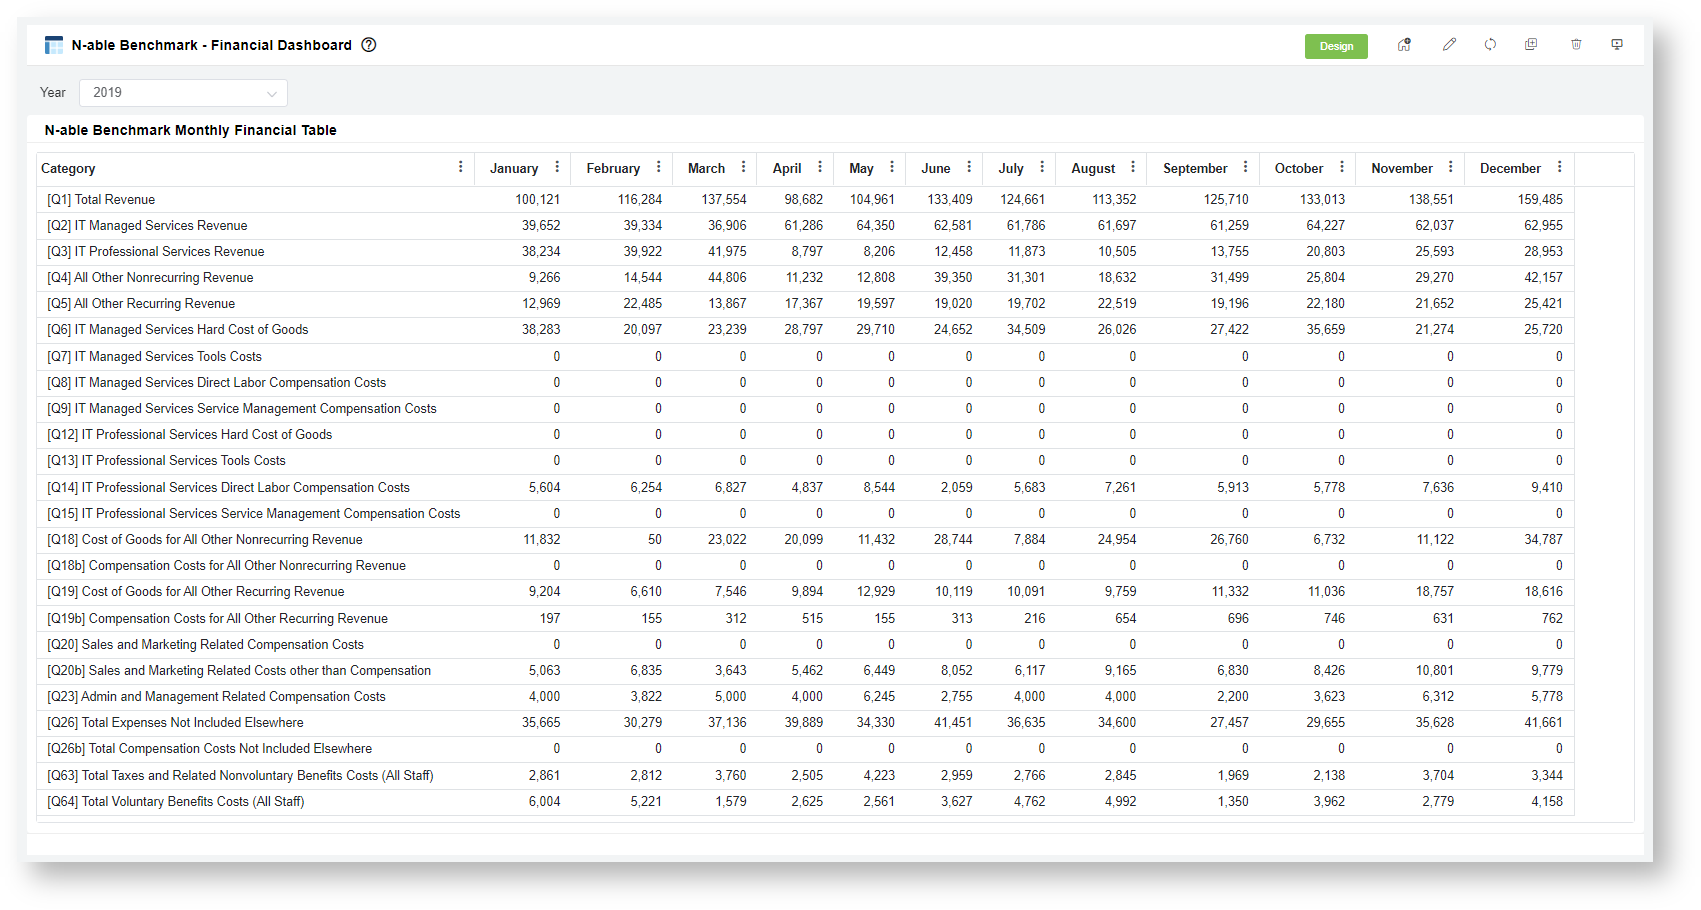
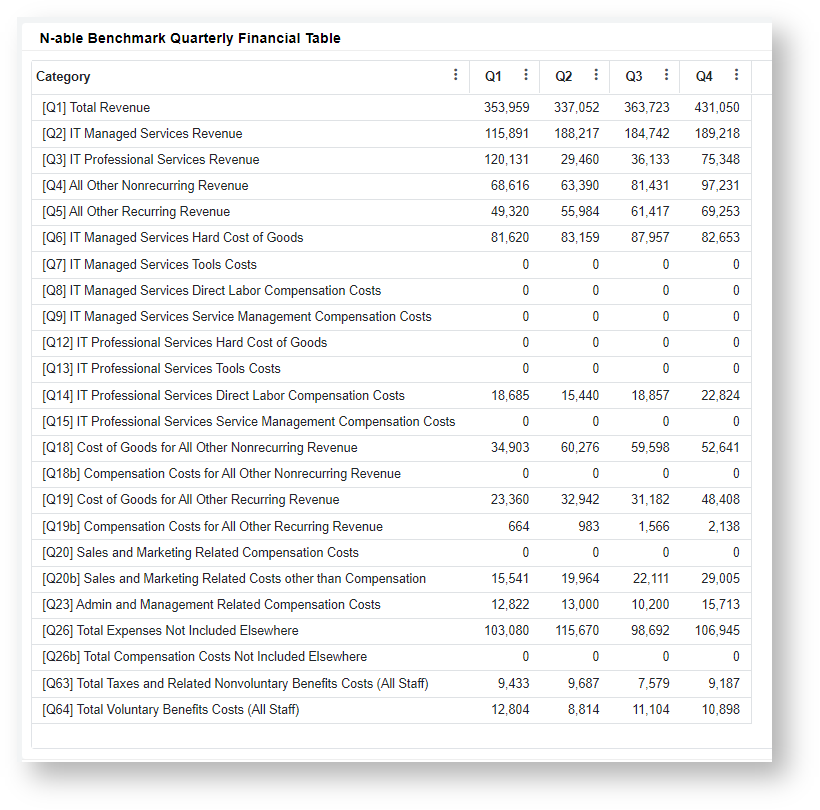
3. Hover to the Dashboard menu. Then, click N-able Benchmark - Financial Dashboard
Dashboard
Description
N-able Benchmarking - Financial Dashboard
A dashboard displaying the account categories (Qs) amount by monthly and quarter in a given year.
Step 7 - Input you Q values for Benchmarking
Prerequisites:
Completed the following:
Accounting Mapping setup
N-able Configuration setup
N-able Headcount input
1. Open the the N-able Benchmarking app
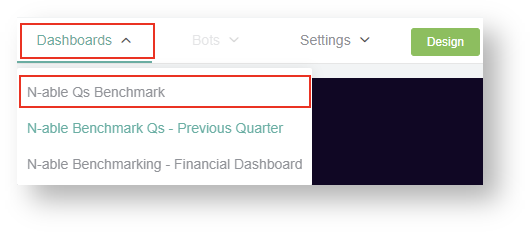
2. Hover to the Dashboard menu. Then, click N-able Qs Benchmark
Dashboard
Description
N-able Qs Benchmark
This Dashboard contains the form for the Qs input for the benchmarking processes:
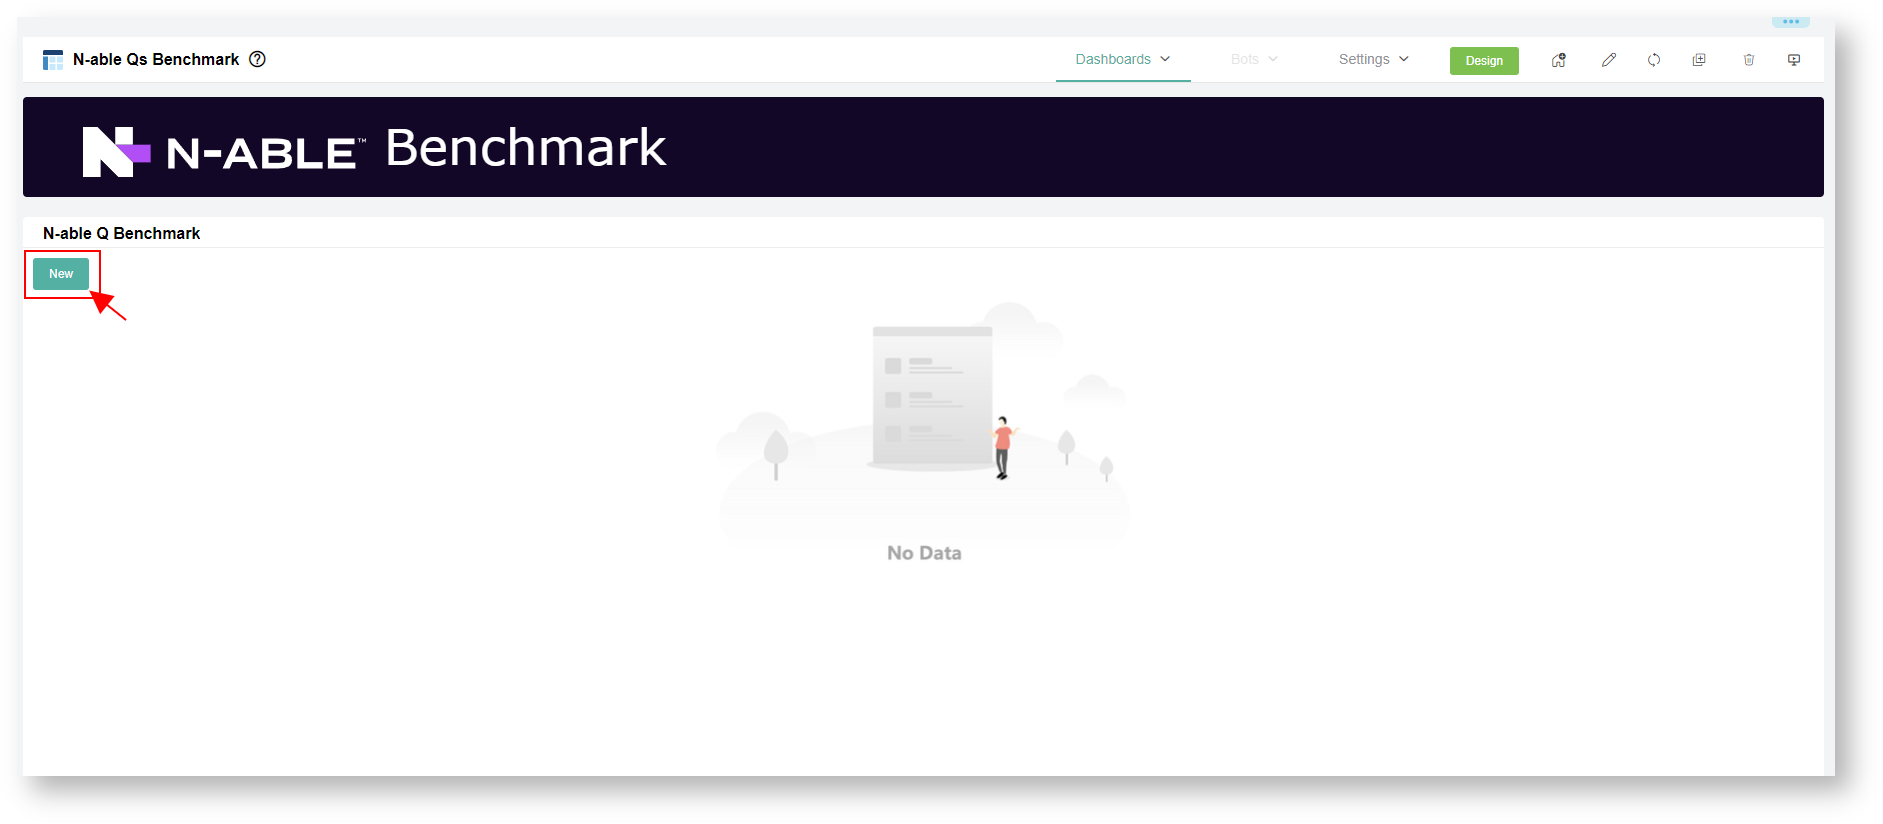
At the end of each Quarter, you can create a new Q Benchmark record.
The form automatically pulls in the various Q values of the previous quarter results.
You can also opt to manually input the data to be used for the benchmark at the manual column.
3. To add a new benchmark record, Click the New button
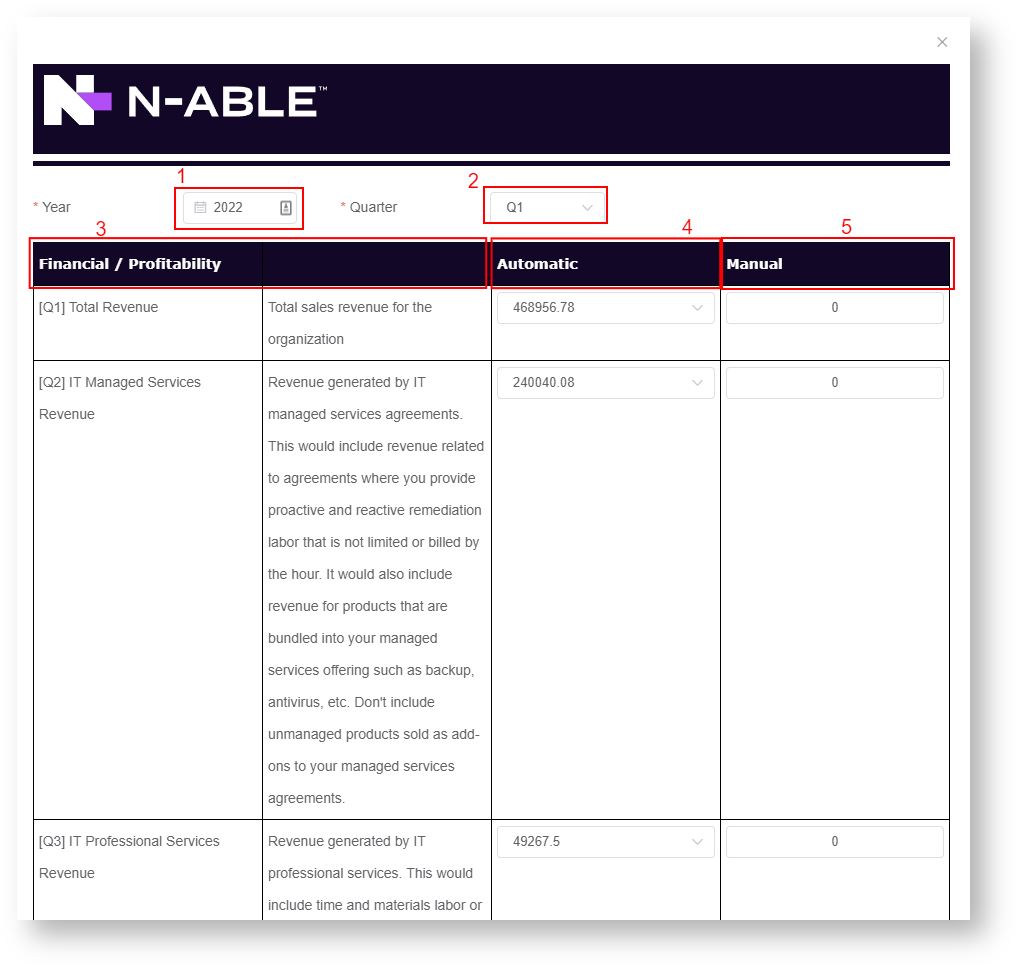
4. How to update the Q Benchmark form:
Select the Year
Select the Quarter
Qs Category column and their definition. Scroll down to see all the Qs categories for input.
Automatic column - it shows the previous quarter Qs results data automatically.
Manual column - if you don't want to use the automatic data, you can manually input here a new value. The app will then use the manual data over the automatic result.
If the Automatic column shows ZERO value, then you need to manually input your Qs data.
5. After updating all the Q values, Click button to save the record.
Benchmark Qs Definition
Financial/Profitability Category
Description
[Q1] Total Revenue
Total sales revenue for the organization.
[Q2] IT Managed Services Revenue (Agreements that include proactive and reactive services, not restricted to hours)
Revenue generated by IT managed services agreements. This would include revenue related to agreements where you provide proactive and reactive remediation labor that is not limited or billed by the hour. It would also include revenue for products that are bundled into your managed services offering such as backup, antivirus, etc. Don't include unmanaged products sold as add-ons to your managed services agreements.
[Q3]IT Professional Services Revenue (Project work, T&M Work, Block time revenue distributed across entire block)
Revenue generated by IT professional services. This would include time and materials labor or project labor, or any hourly block agreements.
[Q4] All Other Nonrecurring Revenue
Revenue generated by any other nonrecurring sale not included in other revenue categories. This would include non-IT related professional services dollars (such as application development work, etc.) and product sales revenue.
[Q5] All Other Recurring Revenue
Revenue generated by any other recurring sales not included in other revenue categories. This would include Cloud services revenue, recurring non-managed services sales, and non-IT related recurring revenue.
[Q6] IT Managed Services Hard Cost of Goods (all bundled product costs such as antivirus, backup, RMM costs, etc.)
All hard costs related to revenue in question [Q2]. This would include all bundled services costs like RMM, antivirus, backup, etc. If products are purchased annually, costs should be spread out across 4 quarters.
[Q7] IT Managed Services Tools Costs (Tools related to the delivery of managed services like fractional PSA costs, fractional documentation tools costs, etc.)
All tools' costs related to revenue in question [Q2]. This would include PSA costs and documentation tools costs related to the employees included in labor costs on [Q8-Q9]. Additionally, this would include tools costs for software/platforms you use to service your IT managed services customers. If products are purchased annually, costs should be spread out across 4 quarters.
[Q8] IT Managed Services Direct Labor Compensation Costs (Direct labor costs for resources or fractional resources delivering managed services, not including service management compensation)
Compensation costs related to techs and engineers directly service the revenue reported in [Q2]. This can be fractional if you are sharing employees between various business units (ie., tech provides both IT MSP support and billable labor). Calculate the split based on hours spent in each business unit as a fraction of their total compensation costs.
[Q9] IT Managed Services Service Management Compensation Costs (Full or fractional costs for service management resources)
Compensation costs related to management of service delivery of the revenue reported in [Q2]. This can be fractional if you are sharing employees between various business units (ie. manager manages both IT MSP support and billable labor resources). Calculate the split based on hours spent in each business unit as a fraction of their total compensation costs.
[Q10] IT Managed Services Resources Taxes and Related Nonvoluntary Costs (For all staff included in Direct Labor and Service Management Costs)
All taxes and other nonvoluntary expenses related to the compensation included in [Q8] and [Q9]
[Q11] IT Managed Services Resources Voluntary Benefits (Company paid benefits such as health care, retirement plans, etc.)
All voluntary expenses related to the compensation included in [Q8] and [Q9]. This would include expenses like health care, retirement plans, etc.
[Q12] IT Professional Services Hard Cost of Goods
All hard costs related to revenue in question [Q3]. Depending on your business model, you may not have any hard costs
[Q13] IT Professional Services Tools Costs (Tools related to the delivery of Professional Services like fractional PSA costs, fractional documentation tools costs, etc.)
All tools' costs related to revenue in question [Q3]. This would include PSA costs and documentation tools costs related to the employees included in labor costs on [Q14-Q15]. Additionally, this would include tools costs for software/platforms you use to service your IT managed services customers. If products are purchased annually, costs should be spread out across 4 quarters.
[Q14] IT Professional Services Direct Labor Compensation Costs (Direct labor costs for resources or fractional resources delivering Professional Services, not including service management compensation)
Compensation costs related to techs and engineers directly services the revenue reported in [Q3]. This can be fractional if you are sharing employees between various business units (ie., tech provides both IT MSP support and billable labor). Calculate the split based on hours spent in each business unit as a fraction of their total compensation costs.
[Q15] IT Professional Services Service Management Compensation Costs (Full or fractional costs for service management resources)
Compensation costs related to management of service delivery of the revenue reported in [Q3]. This can be fractional if you are sharing employees between various business units (ie. manager manages both IT MSP support and billable labor resources). Calculate the split based on hours spent in each business unit as a fraction of their total compensation costs.
[Q16] IT Professional Services Resources Taxes and Related Nonvoluntary Costs (For all staff included in Direct Labor and Service Management Costs)
All taxes and other nonvoluntary expenses related to the compensation included in [Q14] and [Q15]
[Q17] IT Professional Services Resources Voluntary Benefits (Company paid benefits such as health care, retirement plans, etc.)
All voluntary expenses related to the compensation included in [Q14] and [Q15]. This would include expenses like health care, retirement plans, etc.
[Q18] Cost of Goods for All Other Nonrecurring Revenue
All costs, except compensation, required to provide the services providing the [Q4] revenue. This would include hardware and software product costs.
[Q18b] Compensation Costs for All Other Nonrecurring Revenue
Compensation costs related to the revenue reported in [Q4]. This can be fractional if you are sharing employees between various business units. Calculate the split based on hours spent in each business unit as a fraction of their total compensation costs.
[Q18c] All Other Nonrecurring Revenue Resources Taxes and Related Nonvoluntary Costs
All taxes and other nonvoluntary expenses related to the compensation included in [Q18b]
[Q18d] All Other Nonrecurring Revenue Resources Voluntary Benefits (Company paid benefits such as health care, retirement plans, etc.)
All voluntary expenses related to the compensation included in [Q18b]. This would include expenses like health care, retirement plans, etc.
[Q19] Cost of Goods for All Other Recurring Revenue
All costs, except compensation, required to provide the services providing the [Q5] revenue. This would include recurring product costs. If products are purchased annually, costs should be spread out across 4 quarters.
[Q19b] Compensation Costs for All Other Recurring Revenue
Compensation costs related to the revenue reported in [Q5]. This can be fractional if you are sharing employees between various business units. Calculate the split based on hours spent in each business unit as a fraction of their total compensation costs.
[Q19c] All Other Recurring Revenue Resources Taxes and Related Nonvoluntary Costs
All taxes and other nonvoluntary expenses related to the compensation included in [Q19b]
[Q19d] All Other Recurring Revenue Resources Voluntary Benefits (Company paid benefits such as health care, retirement plans, etc.)
All voluntary expenses related to the compensation included in [Q19b]. This would include expenses like health care, retirement plans, etc.
[Q20b] Sales and Marketing Related Costs other than Compensation
Total sales and marketing related costs other than compensation. This would include promotional costs, campaigns, agencies, online and paid search, list purchases, dedicated CRM software costs, promotional website costs, etc.
[Q20] Sales and Marketing Related Compensation Costs
Compensation for sales and marketing employees.
[Q21] Sales and Marketing Resources Related Taxes and Related Nonvoluntary Costs
All taxes and other nonvoluntary expenses related to the compensation included in [Q20]
[Q22] Sales and Marketing Resources Related Voluntary Benefits
All voluntary expenses related to the compensation included in [Q20]. This would include expenses like health care, retirement plans, etc.
[Q23] Admin and Management Related Compensation Costs (Not included elsewhere, not including excess owner compensation)
Compensation for admin and management employees not already included in other compensation questions. Limit owner related compensation to the compensation required to replace that individual with an employee at market rate.
[Q24] Admin and Management Resources Related Taxes and Related Nonvoluntary Costs
All taxes and other nonvoluntary expenses related to the compensation included in [Q23]
[Q25] Admin and Management Resources Related Voluntary Benefits
All voluntary expenses related to the compensation included in [Q23]. This would include expenses like health care, retirement plans, etc. Limit owner related to contributions to what you would pay if it were an employee.
[Q26] Total Expenses Not Included Elsewhere
All expenses not reported in other questions, except unreported compensation costs.
[Q26b] Total Compensation Costs Not Included Elsewhere
Compensation costs not included elsewhere. These FTE are reported in [Q35].
[Q26c] Compensation Costs Not Included Elsewhere Taxes and Related Nonvoluntary Costs
All taxes and other nonvoluntary expenses related to the compensation included in [Q26b]
[Q26d] Compensation Costs Not Included Elsewhere Voluntary Benefits (Company paid benefits such as health care, retirement plans, etc.)
All voluntary expenses related to the compensation included in [Q26b]. This would include expenses like health care, retirement plans, etc.
Headcount Category
Description
[Q27] IT Managed Services Resources Direct Labor FTE Count (Can be fractional)
Full time equivalent headcount included in [Q8]
[Q28] IT Managed Services Service Management Resources Direct Labor FTE Count (Can be fractional)
Full time equivalent headcount included in [Q9]
[Q29] IT Professional Services Resources Direct Labor FTE Count (Can be fractional)
Full time equivalent headcount included in [Q14]
[Q30] IT Professional Services Service Management Resources Direct Labor FTE Count (Can be fractional)
Full time equivalent headcount included in [Q15]
[Q31] Sales and Marketing Resources Direct Labor FTE Count (Can be fractional)
Full time equivalent headcount included in [Q20]
[Q32] Admin Resources Direct Labor FTE Count (Not included in other counts, Can be fractional)
Full time equivalent headcount for the admin employees included in [Q23]
[Q33] Management Resources Direct Labor FTE Count (Not included in other counts, Can be fractional)
Full time equivalent headcount for the management/owner employees included in [Q23]
[Q34] All Other Cost of Goods Resources Direct Labor FTE Count (Can be fractional)
Full time equivalent headcount included in [Q18] and [Q19]
[Q35] Resources Not Included Elsewhere FTE Count (Can be fractional)
Full time equivalent headcount not included in any other question.
Service Counts
Description
[Q36] Average Number of Managed Services Agreements
Average number of active IT managed services agreements in place across all customers.
[Q37] Average Number of Managed Users
Average number of users covered by active IT managed services agreements.
[Q38] Average Number of Managed Devices
Average number of devices (workstations, servers, network devices, etc.) covered by active IT managed services agreements.
[Q39] If you measured customer satisfaction (CSAT), how many responses did you get from managed clients?
Total number of responses (positive or negative) you collected during the period
Ticket Counts
Description
[Q40] IT Managed Services Reactive Tickets Generated (Customer requests)
Total number of reactive tickets (requests received from the covered customers) received during the period
[Q41] IT Managed Services RMM Tickets Generated
Total number of reactive tickets generated by your RMM platform during the period. Do not double count tickets between [Q41] and [Q42].
Total number of proactive tickets (issues generated internally to proactively support a covered customers environment) received during the period. Do not double count tickets already included in [Q41] and [Q42].
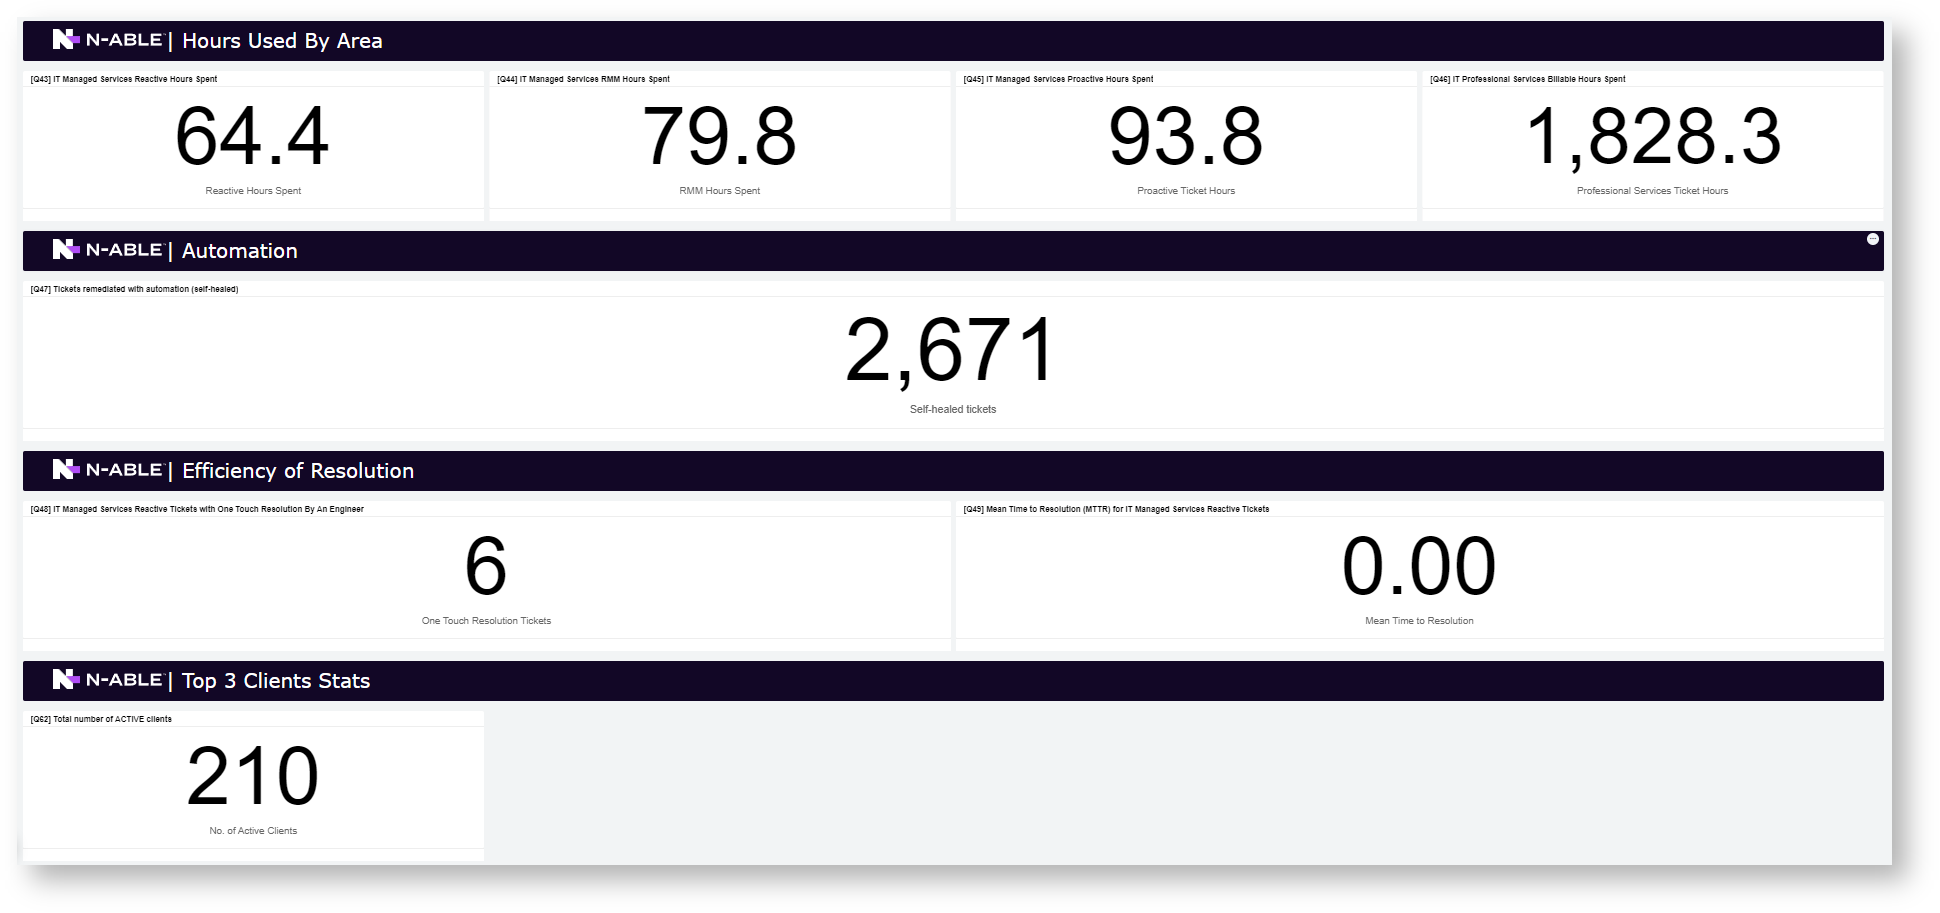
Hours Used by Area
Description
[Q43] IT Managed Services Reactive Hours Spent
Total number of hours spent against the tickets in [Q40]
[Q44] IT Managed Services RMM Hours Spent
Total number of hours spent against the tickets in [Q41]
[Q45] IT Managed Services Proactive Hours Spent
Total number of hours spent against the tickets in [Q42]
[Q46] IT Professional Services Billable Hours Spent
Total number of billable hours that yields revenue in [Q3]
Automation
Description
[Q47] Tickets remediated with automation (self-healed)
Total number of tickets/incidents that were remediated by automation and did not require technician intervention.
Efficiency of Resolution
Description
[Q48] IT Managed Services Reactive Tickets with One Touch Resolution By An Engineer (Only one time entry by a tech on a resolved ticket)
Total number of tickets that were resolved with only one contiguous time entry by an engineer. If you have someone triage or dispatch the ticket, that will not count as an engineer working the issue.
[Q49] Mean Time to Resolution (MTTR) for IT Managed Services Reactive Tickets
Average number of minutes required to resolve tickets reported in [Q40]
Top 3 Clients Stats
Description
[Q50] Total IT Managed Services Revenue from 3 Largest Clients (largest in terms of total revenue)
Total revenue generated by IT managed services agreements for your top 3 clients, in terms of total revenue generated. This would include revenue related to agreements where you provide proactive and reactive remediation labor that is not limited or billed by the hour. It would also include revenue for products that are bundled into your managed services offering such as backup, antivirus, etc. Don't include unmanaged products sold as add-ons to your managed services agreements. For related clients, consider them individual if you treat them as separate clients. If you treat them as one client with multiple branches, count them as one client.
[Q51] Total IT Professional Services Revenue from 3 Largest Clients (largest in terms of total revenue)
Total revenue generated by IT professional services for your top 3 clients, in terms of total revenue generated. This would include time and materials labor or project labor, or any hourly block agreements.
[Q52] Total Other Revenue from 3 Largest Clients (largest in terms of total revenue)
Total revenue generated by any other sale not included in [Q50] and [Q51] for your top 3 clients, in terms of total revenue generated. This would include non-IT related professional services dollars (such as application development work, etc.) and product sales revenue.
[Q53] Average Number of Managed Users from 3 Largest Clients (largest in terms of total revenue)
Average number of users covered by active IT managed services agreements for your top 3 clients.
[Q54] Average Number of Managed Devices from 3 Largest Clients (largest in terms of total revenue)
Average number of devices (workstations, servers, network devices, etc.) covered by active IT managed services agreements for your top 3 clients.
[Q55] IT Managed Services Reactive Tickets Generated (Customer requests) from 3 Largest Clients (largest in terms of total revenue)
Total number of reactive tickets (requests received from the covered customers) received during the period from your top 3 clients
[Q56] IT Managed Services RMM Tickets Generated from 3 Largest Clients (largest in terms of total revenue)
Total number of reactive tickets generated by your RMM platform during the period for your top 3 clients. Do not double count tickets between [Q55] and [Q56].
[Q57] IT Managed Services Proactive Tickets Generated (environment checkups, proactive onsite visits, etc) from 3 Largest Clients (largest in terms of total revenue)
Total number of proactive tickets (issues generated internally to proactively support a covered customers environment) received during the period for your top 3 clients. Do not double count tickets already included in [Q55] and [Q56].
[Q58] IT Managed Services Reactive Hours Spent from 3 Largest Clients (largest in terms of total revenue)
Total number of hours spent against the tickets in [Q55]
[Q59] IT Managed Services RMM Hours Spent from 3 Largest Clients (largest in terms of total revenue)
Total number of hours spent against the tickets in [Q56]
[Q60] IT Managed Services Proactive Hours Spent from 3 Largest Clients (largest in terms of total revenue)
Total number of hours spent against the tickets in [Q57]
[Q61] IT Professional Services Billable Hours Spent from 3 Largest Clients (largest in terms of total revenue)
Total number of billable hours that yield revenue in [Q51]
[Q62] Total number of ACTIVE clients (clients billed for any IT service during the period)
Total number of individual clients that you billed for any IT service. For related clients, consider them individual if you treat them as separate clients. If you treat them as one client with multiple branches, count them as one client.
 N O T I C E