| Financial/Profitability Category | Description |
|---|
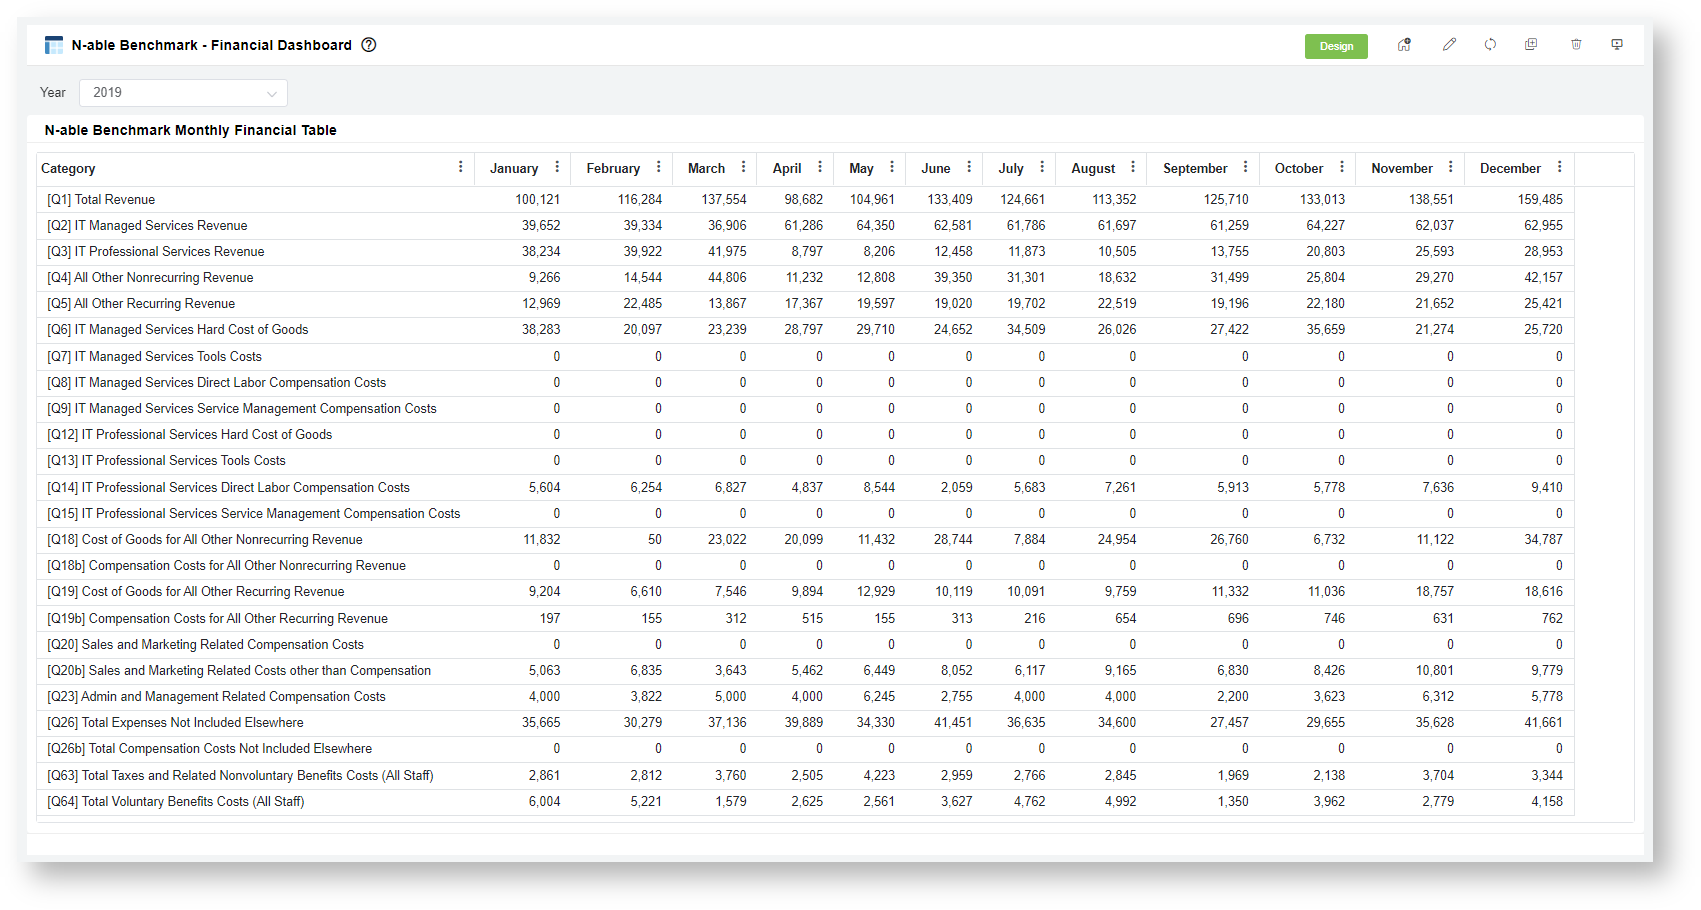
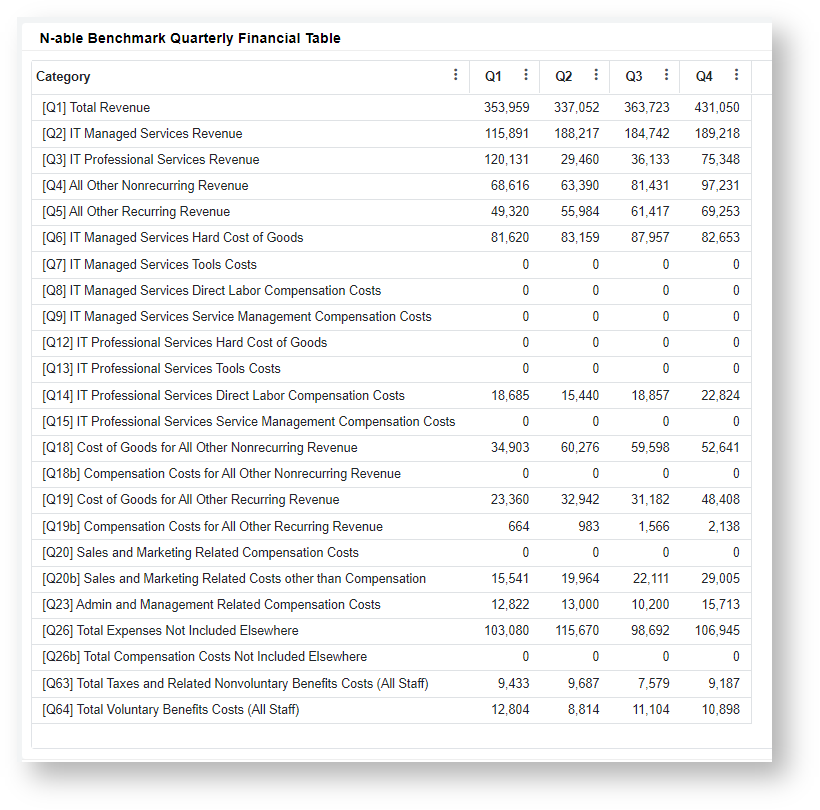
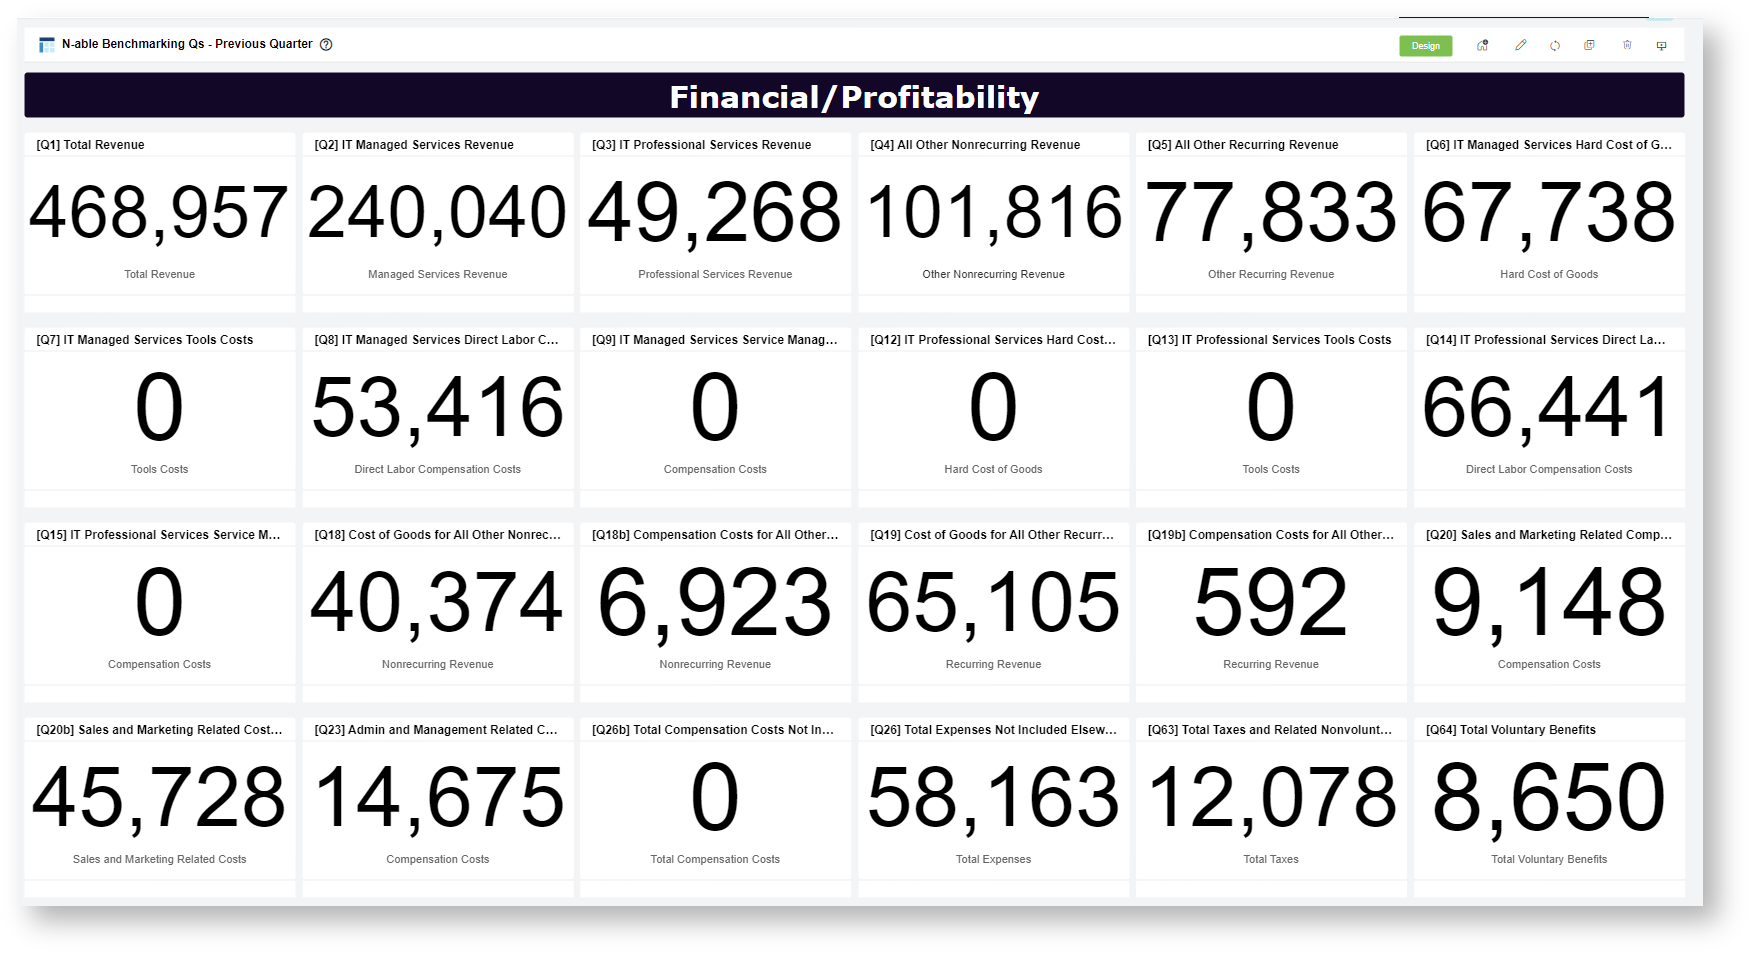
| [Q1] Total Revenue | Total sales revenue for the organization. |
| [Q2] IT Managed Services Revenue (Agreements that include proactive and reactive services, not restricted to hours) | Revenue generated by IT managed services agreements. This would include revenue related to agreements where you provide proactive and reactive remediation labor that is not limited or billed by the hour. It would also include revenue for products that are bundled into your managed services offering such as backup, antivirus, etc. Don't include unmanaged products sold as add-ons to your managed services agreements. |
| [Q3]IT Professional Services Revenue (Project work, T&M Work, Block time revenue distributed across entire block) | Revenue generated by IT professional services. This would include time and materials labor or project labor, or any hourly block agreements. |
| [Q4] All Other Nonrecurring Revenue | Revenue generated by any other nonrecurring sale not included in other revenue categories. This would include non-IT related professional services dollars (such as application development work, etc.) and product sales revenue. |
| [Q5] All Other Recurring Revenue | Revenue generated by any other recurring sales not included in other revenue categories. This would include Cloud services revenue, recurring non-managed services sales, and non-IT related recurring revenue. |
| [Q6] IT Managed Services Hard Cost of Goods (all bundled product costs such as antivirus, backup, RMM costs, etc.) | All hard costs related to revenue in question [Q2]. This would include all bundled services costs like RMM, antivirus, backup, etc. If products are purchased annually, costs should be spread out across 4 quarters. |
| [Q7] IT Managed Services Tools Costs (Tools related to the delivery of managed services like fractional PSA costs, fractional documentation tools costs, etc.) | All tools' costs related to revenue in question [Q2]. This would include PSA costs and documentation tools costs related to the employees included in labor costs on [Q8-Q9]. Additionally, this would include tools costs for software/platforms you use to service your IT managed services customers. If products are purchased annually, costs should be spread out across 4 quarters. |
| [Q8] IT Managed Services Direct Labor Compensation Costs (Direct labor costs for resources or fractional resources delivering managed services, not including service management compensation) | Compensation costs related to techs and engineers directly service the revenue reported in [Q2]. This can be fractional if you are sharing employees between various business units (ie., tech provides both IT MSP support and billable labor). Calculate the split based on hours spent in each business unit as a fraction of their total compensation costs. |
| [Q9] IT Managed Services Service Management Compensation Costs (Full or fractional costs for service management resources) | Compensation costs related to management of service delivery of the revenue reported in [Q2]. This can be fractional if you are sharing employees between various business units (ie. manager manages both IT MSP support and billable labor resources). Calculate the split based on hours spent in each business unit as a fraction of their total compensation costs. |
| [Q10] IT Managed Services Resources Taxes and Related Nonvoluntary Costs (For all staff included in Direct Labor and Service Management Costs) | All taxes and other nonvoluntary expenses related to the compensation included in [Q8] and [Q9] |
| [Q11] IT Managed Services Resources Voluntary Benefits (Company paid benefits such as health care, retirement plans, etc.) | All voluntary expenses related to the compensation included in [Q8] and [Q9]. This would include expenses like health care, retirement plans, etc. |
| [Q12] IT Professional Services Hard Cost of Goods | All hard costs related to revenue in question [Q3]. Depending on your business model, you may not have any hard costs |
| [Q13] IT Professional Services Tools Costs (Tools related to the delivery of Professional Services like fractional PSA costs, fractional documentation tools costs, etc.) | All tools' costs related to revenue in question [Q3]. This would include PSA costs and documentation tools costs related to the employees included in labor costs on [Q14-Q15]. Additionally, this would include tools costs for software/platforms you use to service your IT managed services customers. If products are purchased annually, costs should be spread out across 4 quarters. |
| [Q14] IT Professional Services Direct Labor Compensation Costs (Direct labor costs for resources or fractional resources delivering Professional Services, not including service management compensation) | Compensation costs related to techs and engineers directly services the revenue reported in [Q3]. This can be fractional if you are sharing employees between various business units (ie., tech provides both IT MSP support and billable labor). Calculate the split based on hours spent in each business unit as a fraction of their total compensation costs. |
| [Q15] IT Professional Services Service Management Compensation Costs (Full or fractional costs for service management resources) | Compensation costs related to management of service delivery of the revenue reported in [Q3]. This can be fractional if you are sharing employees between various business units (ie. manager manages both IT MSP support and billable labor resources). Calculate the split based on hours spent in each business unit as a fraction of their total compensation costs. |
| [Q16] IT Professional Services Resources Taxes and Related Nonvoluntary Costs (For all staff included in Direct Labor and Service Management Costs) | All taxes and other nonvoluntary expenses related to the compensation included in [Q14] and [Q15] |
| [Q17] IT Professional Services Resources Voluntary Benefits (Company paid benefits such as health care, retirement plans, etc.) | All voluntary expenses related to the compensation included in [Q14] and [Q15]. This would include expenses like health care, retirement plans, etc. |
| [Q18] Cost of Goods for All Other Nonrecurring Revenue | All costs, except compensation, required to provide the services providing the [Q4] revenue. This would include hardware and software product costs. |
| [Q18b] Compensation Costs for All Other Nonrecurring Revenue | Compensation costs related to the revenue reported in [Q4]. This can be fractional if you are sharing employees between various business units. Calculate the split based on hours spent in each business unit as a fraction of their total compensation costs. |
| [Q18c] All Other Nonrecurring Revenue Resources Taxes and Related Nonvoluntary Costs | All taxes and other nonvoluntary expenses related to the compensation included in [Q18b] |
| [Q18d] All Other Nonrecurring Revenue Resources Voluntary Benefits (Company paid benefits such as health care, retirement plans, etc.) | All voluntary expenses related to the compensation included in [Q18b]. This would include expenses like health care, retirement plans, etc. |
| [Q19] Cost of Goods for All Other Recurring Revenue | All costs, except compensation, required to provide the services providing the [Q5] revenue. This would include recurring product costs. If products are purchased annually, costs should be spread out across 4 quarters. |
| [Q19b] Compensation Costs for All Other Recurring Revenue | Compensation costs related to the revenue reported in [Q5]. This can be fractional if you are sharing employees between various business units. Calculate the split based on hours spent in each business unit as a fraction of their total compensation costs. |
| [Q19c] All Other Recurring Revenue Resources Taxes and Related Nonvoluntary Costs | All taxes and other nonvoluntary expenses related to the compensation included in [Q19b] |
| [Q19d] All Other Recurring Revenue Resources Voluntary Benefits (Company paid benefits such as health care, retirement plans, etc.) | All voluntary expenses related to the compensation included in [Q19b]. This would include expenses like health care, retirement plans, etc. |
| [Q20b] Sales and Marketing Related Costs other than Compensation | Total sales and marketing related costs other than compensation. This would include promotional costs, campaigns, agencies, online and paid search, list purchases, dedicated CRM software costs, promotional website costs, etc. |
| [Q20] Sales and Marketing Related Compensation Costs | Compensation for sales and marketing employees. |
| [Q21] Sales and Marketing Resources Related Taxes and Related Nonvoluntary Costs | All taxes and other nonvoluntary expenses related to the compensation included in [Q20] |
| [Q22] Sales and Marketing Resources Related Voluntary Benefits | All voluntary expenses related to the compensation included in [Q20]. This would include expenses like health care, retirement plans, etc. |
| [Q23] Admin and Management Related Compensation Costs (Not included elsewhere, not including excess owner compensation) | Compensation for admin and management employees not already included in other compensation questions. Limit owner related compensation to the compensation required to replace that individual with an employee at market rate. |
| [Q24] Admin and Management Resources Related Taxes and Related Nonvoluntary Costs | All taxes and other nonvoluntary expenses related to the compensation included in [Q23] |
| [Q25] Admin and Management Resources Related Voluntary Benefits | All voluntary expenses related to the compensation included in [Q23]. This would include expenses like health care, retirement plans, etc. Limit owner related to contributions to what you would pay if it were an employee. |
| [Q26] Total Expenses Not Included Elsewhere | All expenses not reported in other questions, except unreported compensation costs. |
| [Q26b] Total Compensation Costs Not Included Elsewhere | Compensation costs not included elsewhere. These FTE are reported in [Q35]. |
| [Q26c] Compensation Costs Not Included Elsewhere Taxes and Related Nonvoluntary Costs | All taxes and other nonvoluntary expenses related to the compensation included in [Q26b] |
| [Q26d] Compensation Costs Not Included Elsewhere Voluntary Benefits (Company paid benefits such as health care, retirement plans, etc.) | All voluntary expenses related to the compensation included in [Q26b]. This would include expenses like health care, retirement plans, etc. |
 N O T I C E