 N O T I C E
MSPbots WIKI is moving to a new home at support.mspbots.ai![]() to give you the best experience in browsing our Knowledge Base resources and addressing your concerns. Click here
to give you the best experience in browsing our Knowledge Base resources and addressing your concerns. Click here![]() for more info!
for more info!
N O T I C E
MSPbots WIKI is moving to a new home at support.mspbots.ai![]() to give you the best experience in browsing our Knowledge Base resources and addressing your concerns. Click here
to give you the best experience in browsing our Knowledge Base resources and addressing your concerns. Click here![]() for more info!
for more info!
Objectives:
- I
- |
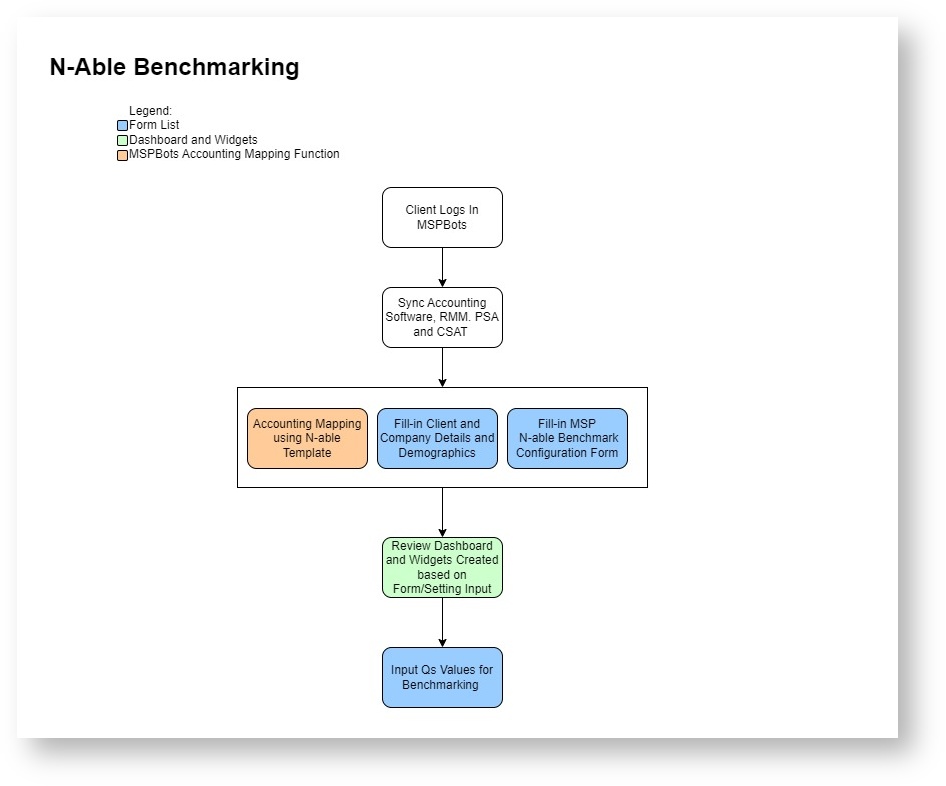
N-able Benchmarking Process Flow
Accounting Mapping N-Able Template
TBD
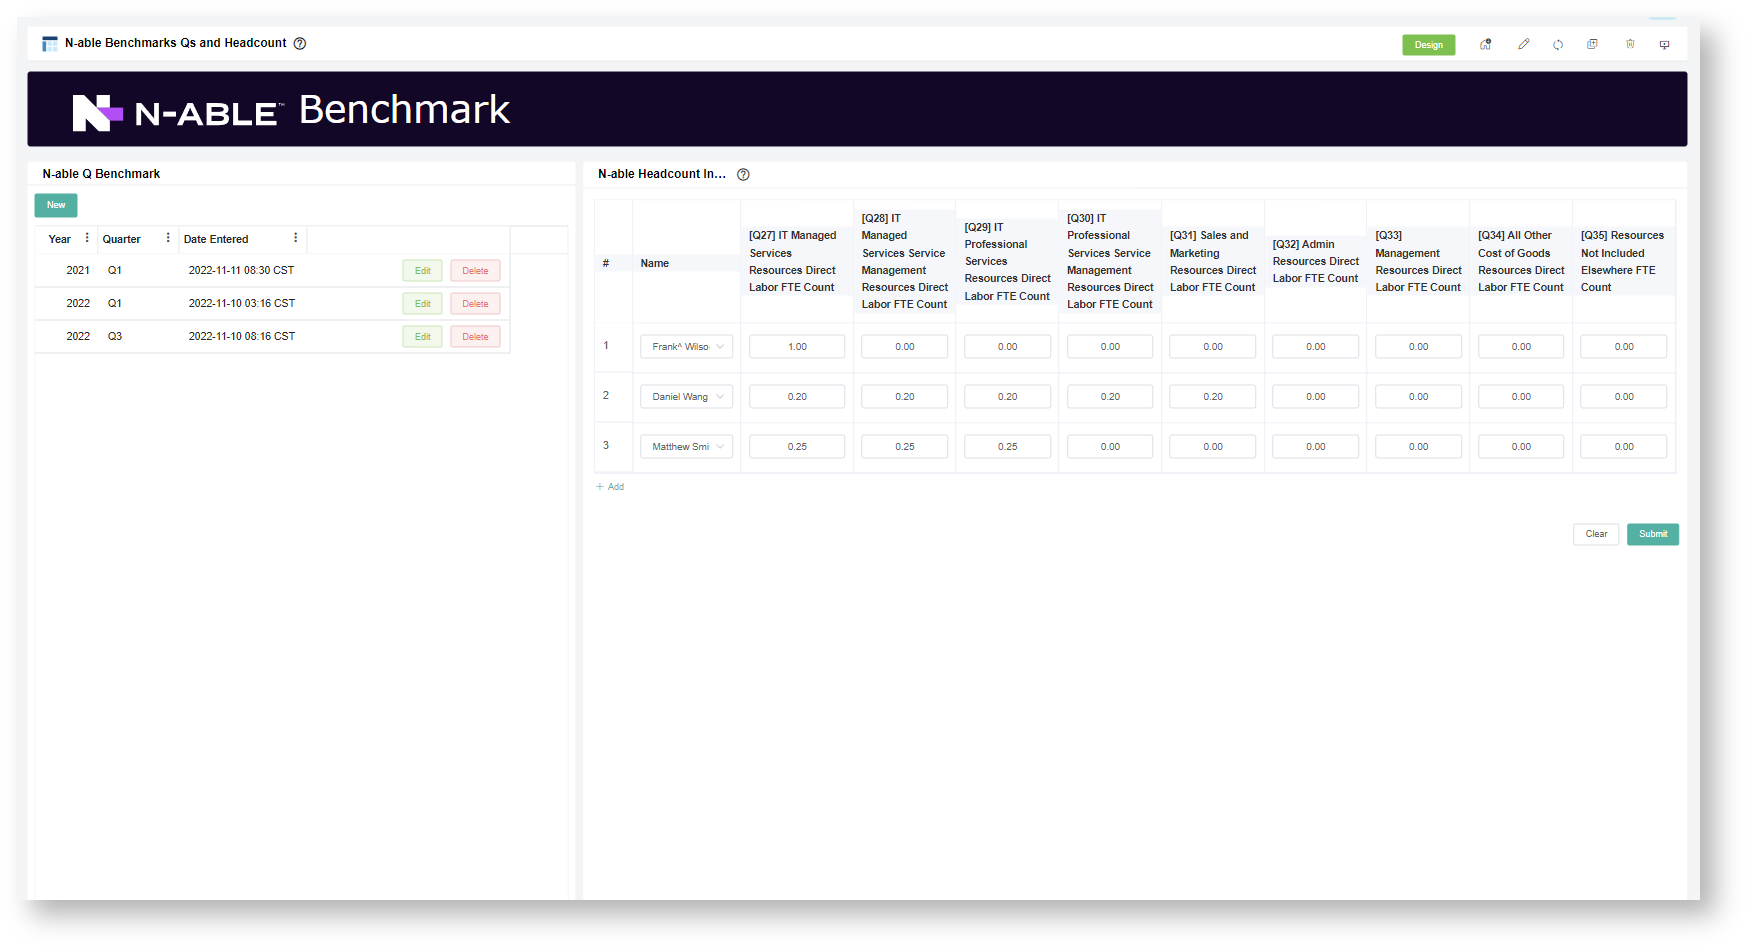
N-able Benchmark Qs and Headcount Information
Dashboard Link: MSPbots
Description:
This Dashboard contains the form for the initial setup for the benchmarking processes:
1. N-able Benchmark Qs Form:
- This contains the per Quarter data for your Q values results.
- At the end of the Quarter, you can Add new Q Benchmark record and do edits if needed.
- Click New button. The form automatically pulls in the various Q values of the quarter and has the ability to save manually inputted data.
2. N-able Headcount
N-Able Client and Benchmark Configuration Form
Form Link: MSPbots
Description: The dashboard contains form to set up the N-Able configuration for Client benchmark input reference.
1. N-able Client Info and Demographics Form:
- This is where you input and submit your company details, demographics and accounting period setup.
2. N-able Benchmark Configuration Form
3. N-able Configuration Supplementary Form
- For Product or Service Addition
N-Able Qs Values for Benchmarking
N-Able Benchmarking Dashboards:
| No | Dashboard | Description | Link |
|---|---|---|---|
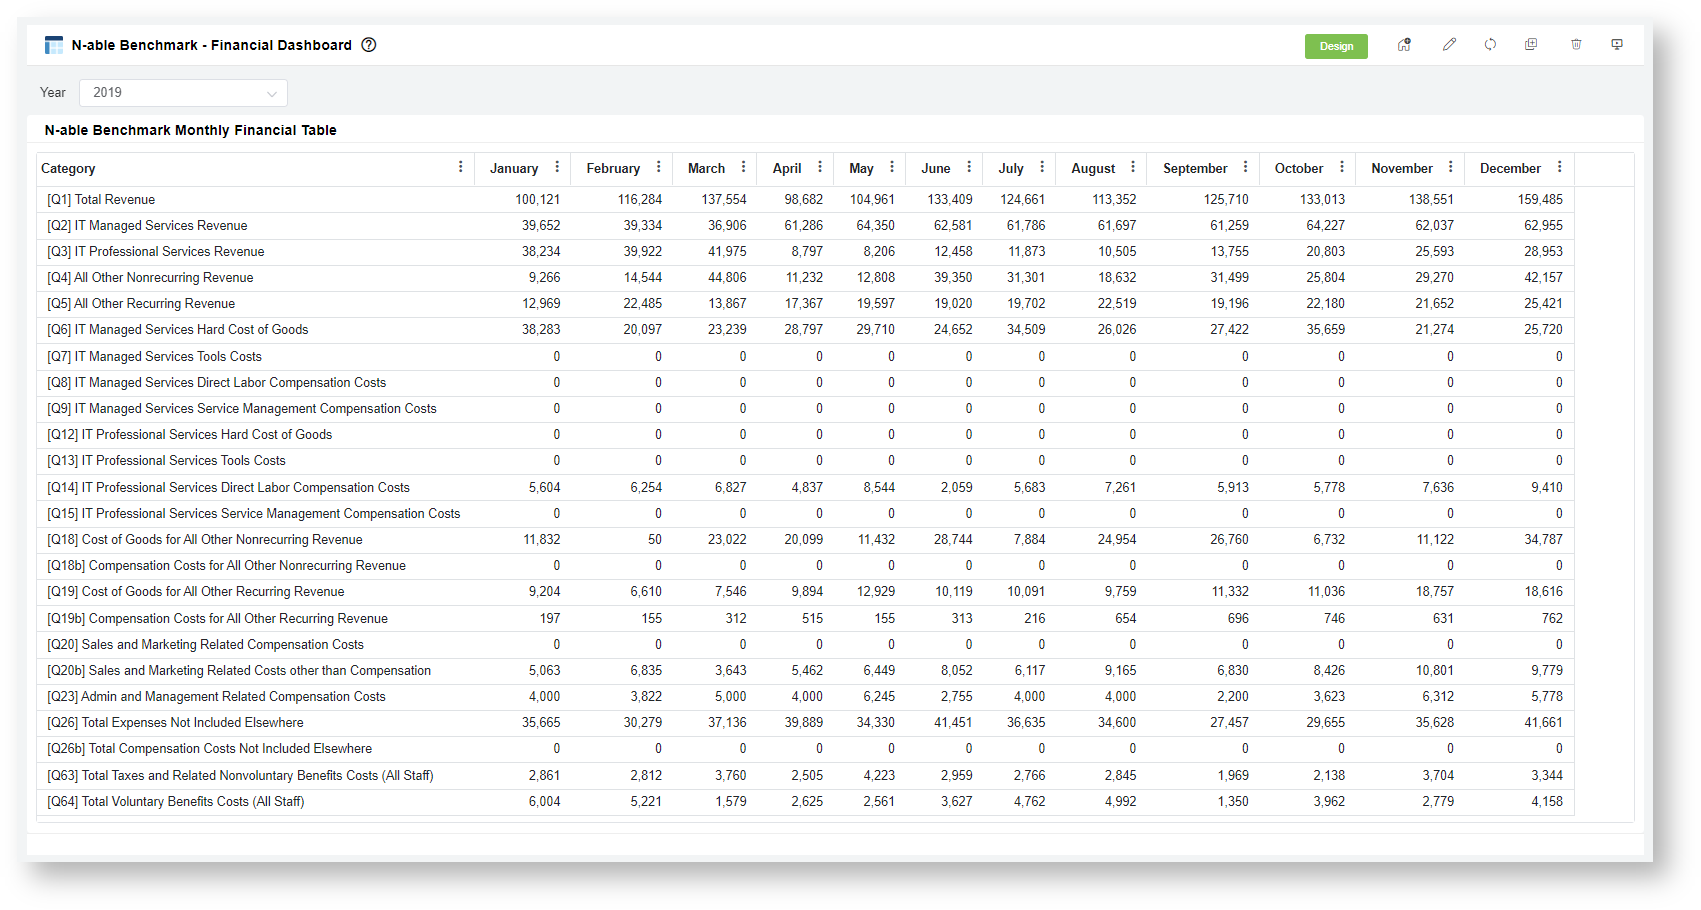
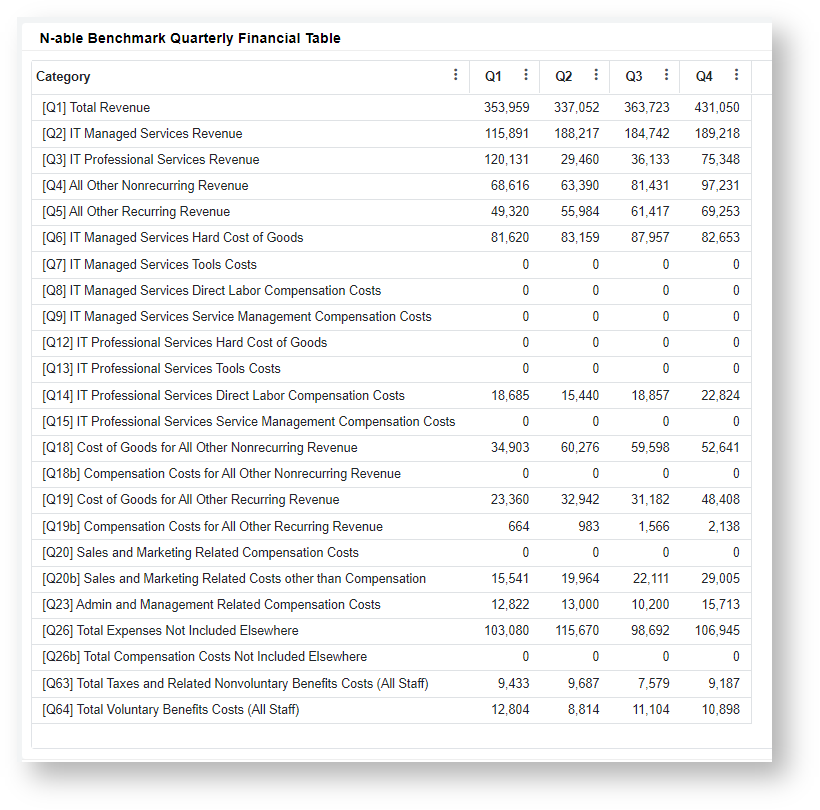
| 1 | N-able Benchmarking - Financial Dashboard | A dashboard displaying the account categories (Qs) amount by monthly and quarter in a given year. | MSPbots |
| No | Dashboard | Description | Link |
|---|---|---|---|
| 2 | N-able Benchmark - Headcount Dashboard | ||
In-progress TBD
| No | Dashboard | Description | Link |
|---|---|---|---|
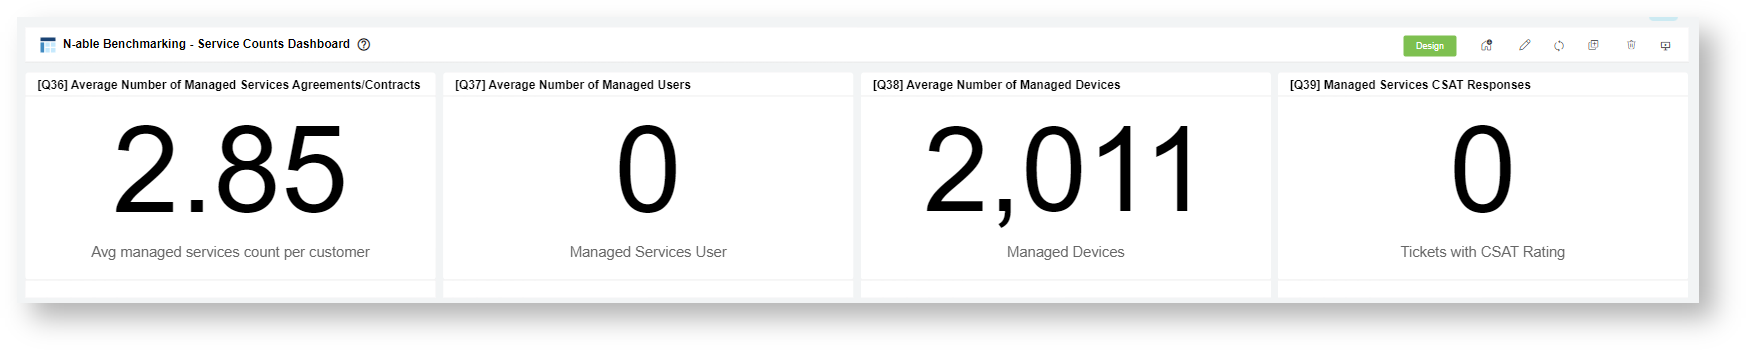
| 3 | N-able Benchmarking - Service Count Dashboard | This dashboard displays the widgets that contain details regarding various data regarding managed services agreements, number of managed users and devices, and tickets count with CSAT responses. | MSPbots |
| No | Dashboard | Description | Link |
|---|---|---|---|
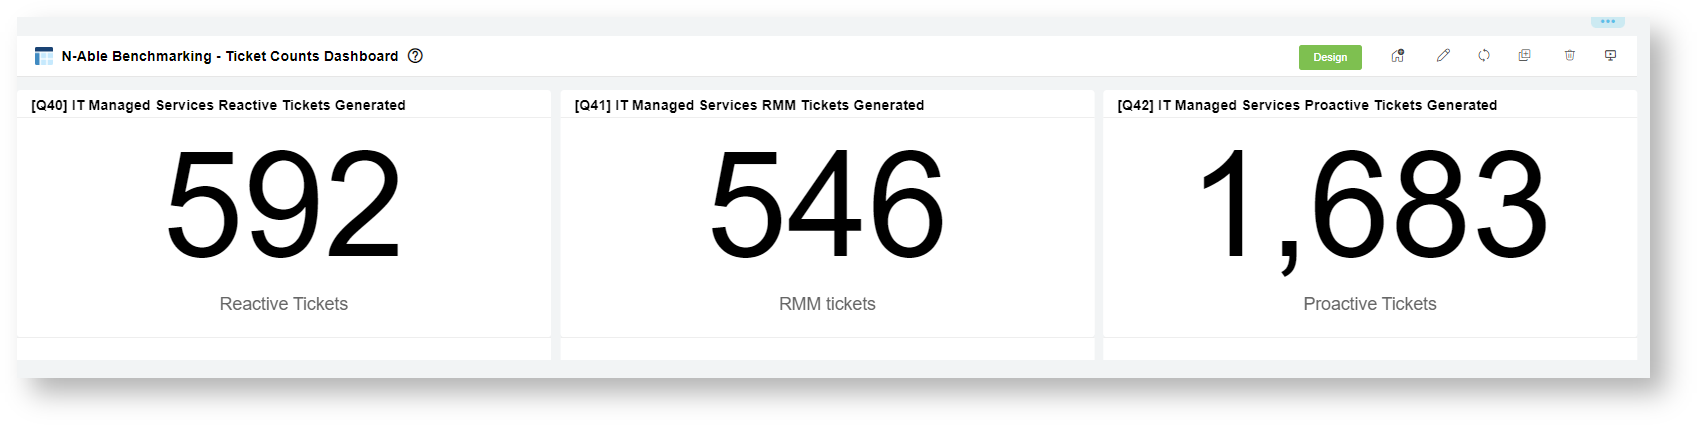
| 4 | N-able Benchmarking - Ticket Counts Dashboard | This dashboard displays the details for the IT managed service ticket counts for the last quarter period: Total Customer reactive tickets [Q40], RMM reactive tickets [Q41], and total number of Proactive Tickets generated [Q42]. | MSPbots |
| No | Dashboard | Description | Link |
|---|---|---|---|
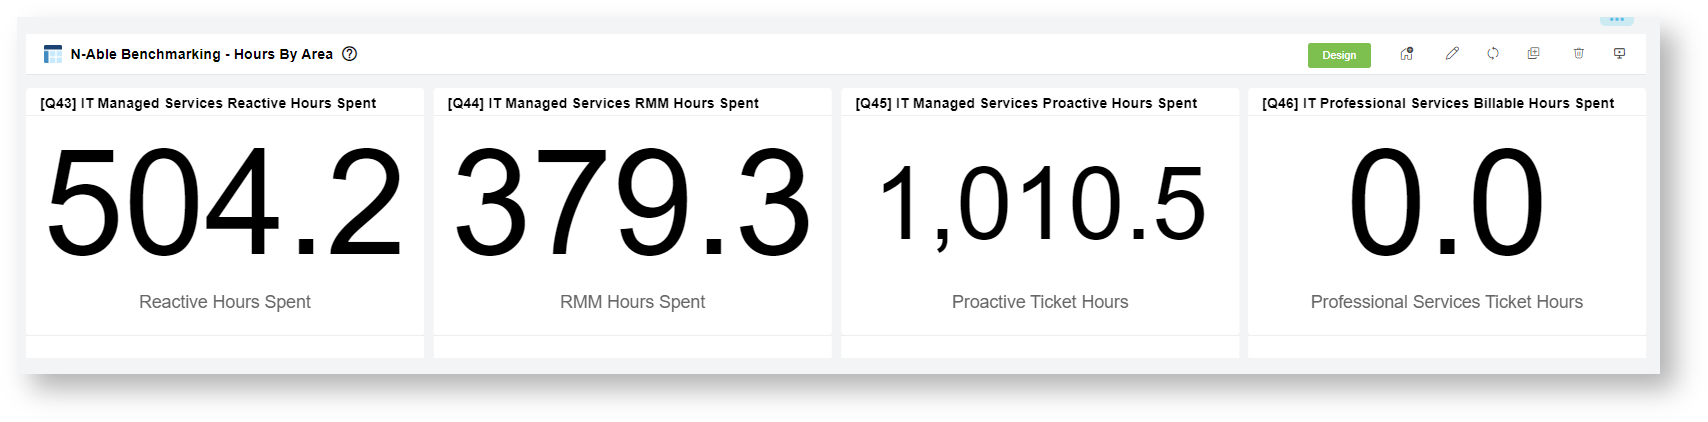
| 5 | N-able Benchmarking - Hours by Area | This dashboard shows the widgets where the information regarding the hours spent for the last quarter is shown for managed and professional services (Reactive, RMM and Proactive). It also shows the total IT professional services billable hours spent. | MSPbots |
| No | Dashboard | Description | Link |
|---|---|---|---|
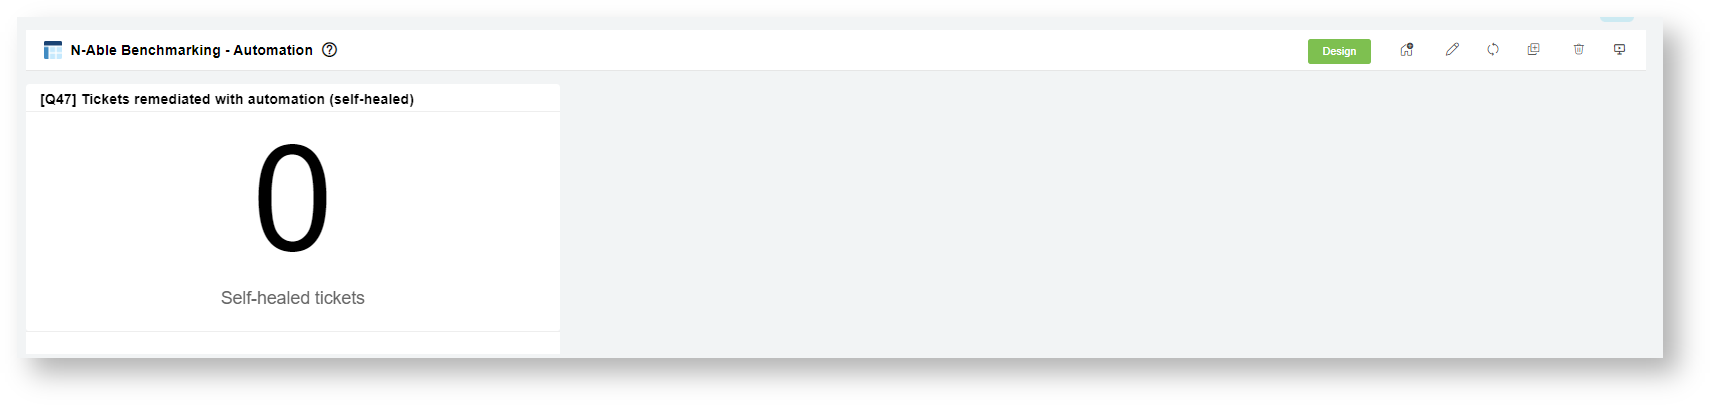
| 6 | N-Able Benchmarking - Automation | This dashboard shows the widget/s containing details regarding the tickets that are self-healed (worked only by bots). | MSPbots |
| No | Dashboard | Description | Link |
|---|---|---|---|
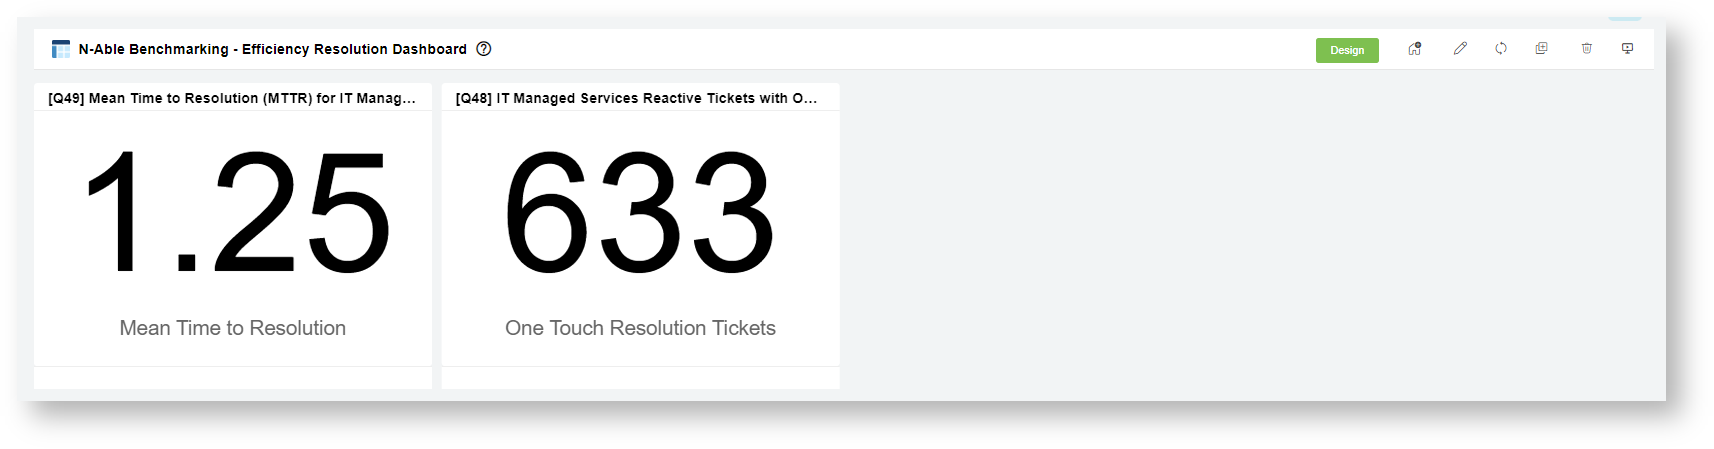
| 7 | N-Able Benchmarking - Efficiency Resolution Dashboard | This dashboard displays the details about your efficiency resolution performance. It shows your Mean Time to Resolution (MTTR) for service reactive ticket and the Total number of tickets with one touch resolution by your Tech or Engineer. | MSPbots |
| No | Dashboard | Description | Link |
|---|---|---|---|
| 8 | N-Able Benchmarking - Top 3 Client Stats |
TBD
| No | Dashboard | Description | Link |
|---|---|---|---|
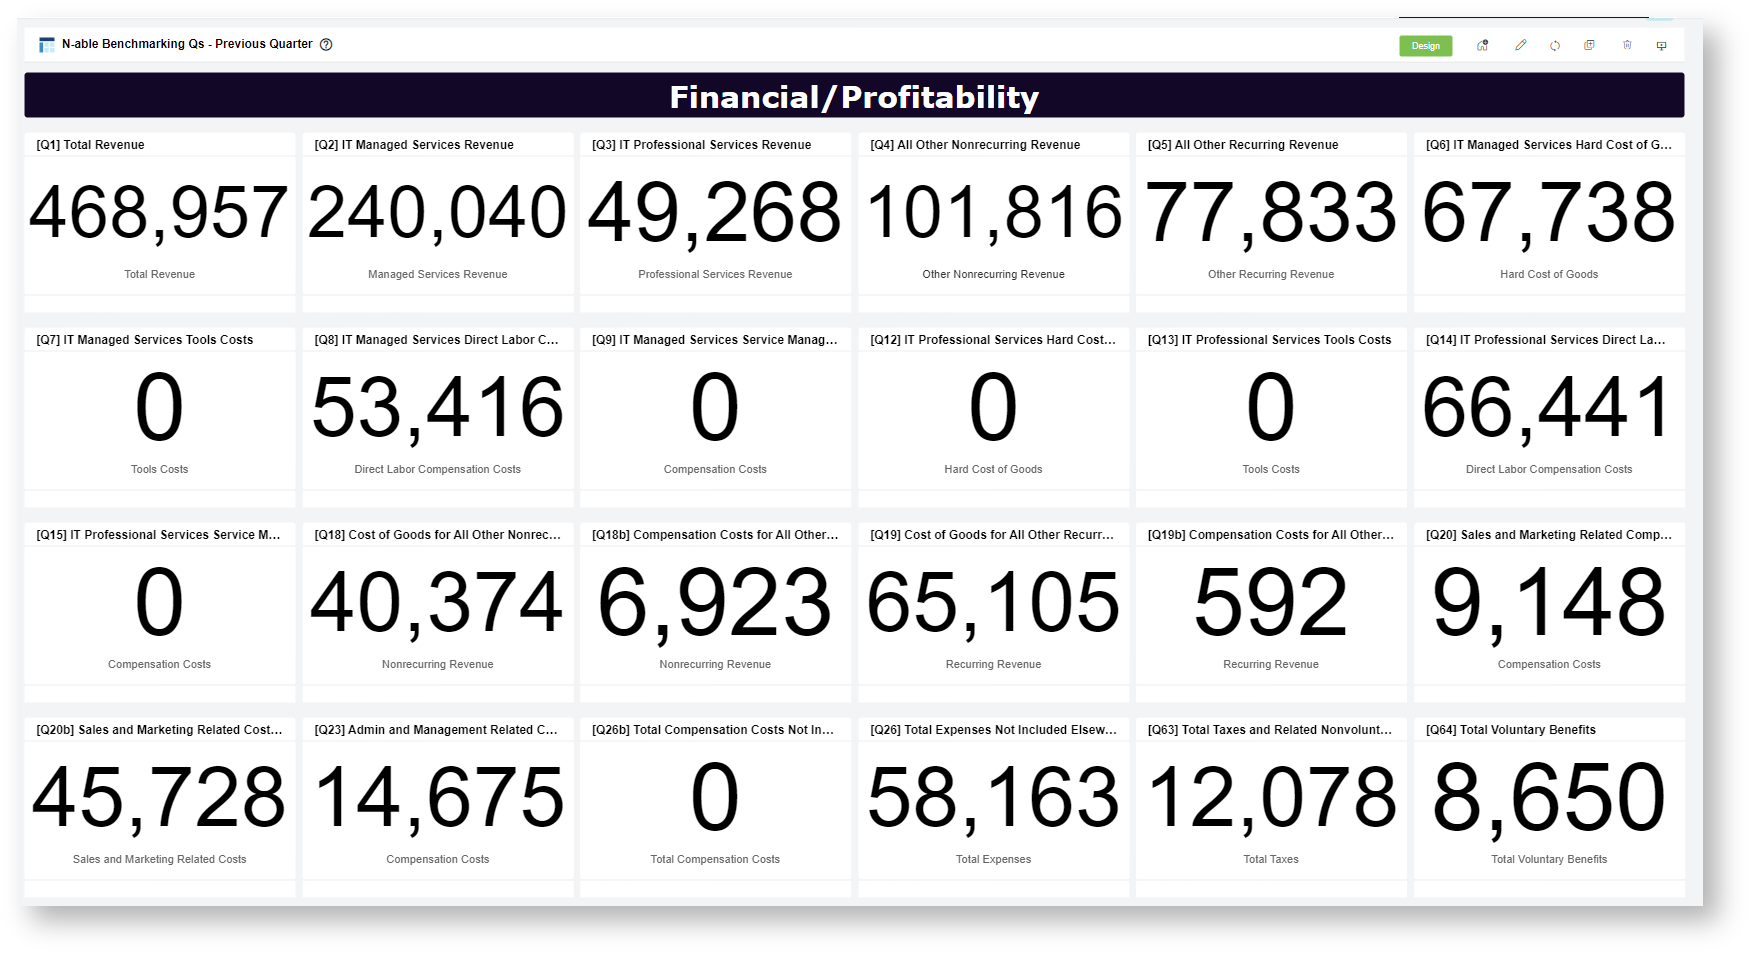
| 9 | N-Able Benchmarking - Previous Quarter | MSPbots |
Overview
Content Tools
N O T I C E
MSPbots WIKI is moving to a new home at support.mspbots.ai![]() to give you the best experience in browsing our Knowledge Base resources and addressing your concerns. Click here
to give you the best experience in browsing our Knowledge Base resources and addressing your concerns. Click here![]() for more info!
for more info!