 N O T I C E
MSPbots WIKI is moving to a new home at support.mspbots.ai![]() to give you the best experience in browsing our Knowledge Base resources and addressing your concerns. Click here
to give you the best experience in browsing our Knowledge Base resources and addressing your concerns. Click here![]() for more info!
for more info!
N O T I C E
MSPbots WIKI is moving to a new home at support.mspbots.ai![]() to give you the best experience in browsing our Knowledge Base resources and addressing your concerns. Click here
to give you the best experience in browsing our Knowledge Base resources and addressing your concerns. Click here![]() for more info!
for more info!
This article shows how to create a radar chart widget. It applies to MSPbots users with an Autotask integration.
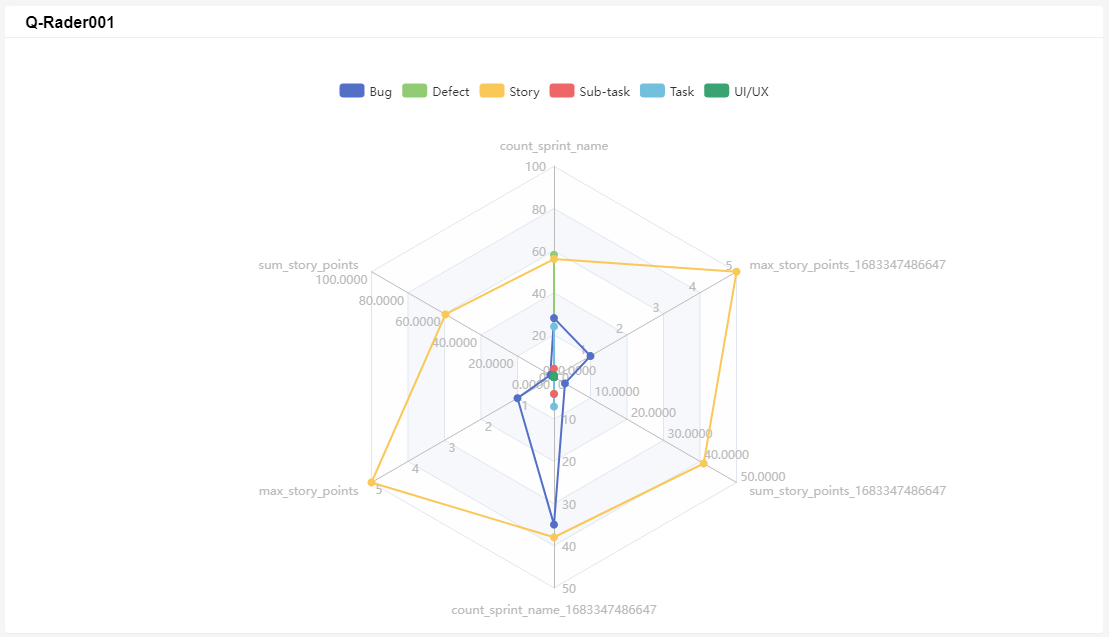
An example of a radar chart widget:
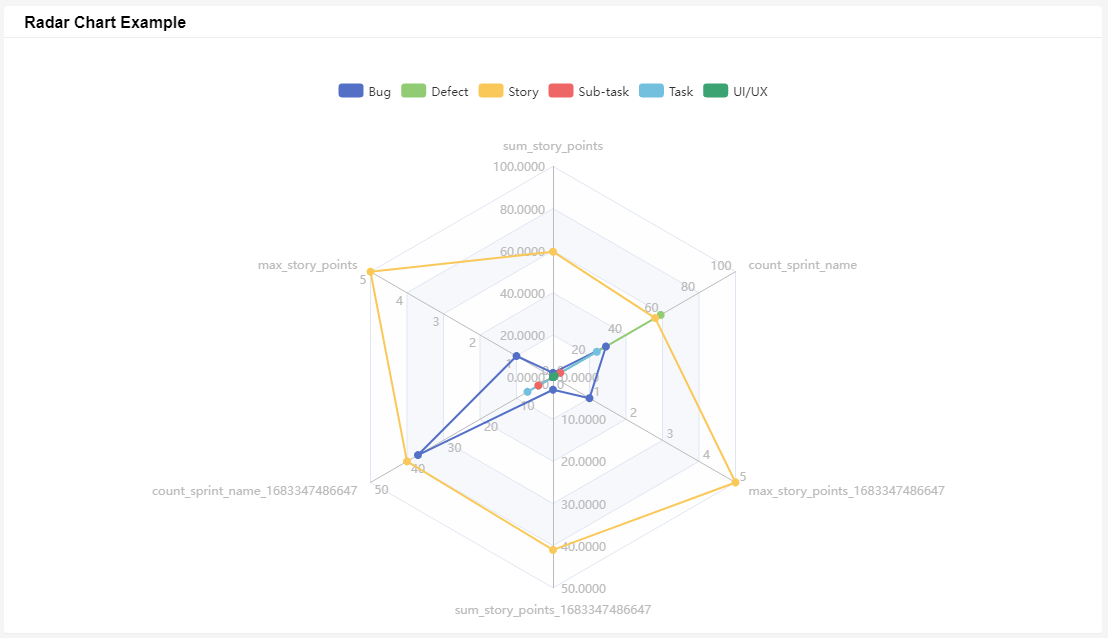
How to Create a Radar Chart Widget
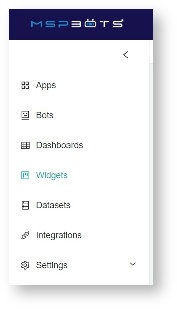
- Navigate to Widgets on the MSPbots app menu.
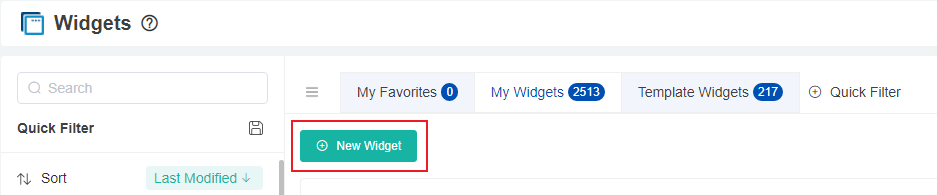
- Under My Widgets, click New Widget.
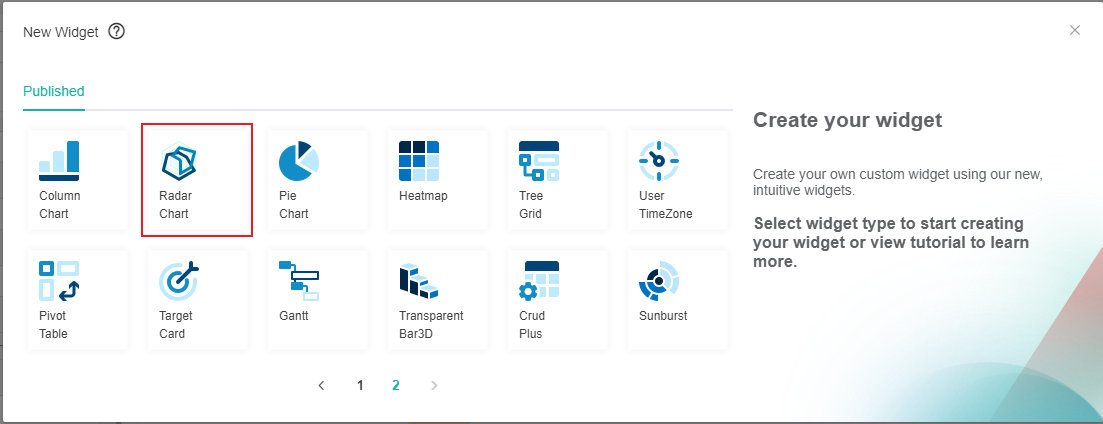
- Select the Radar Chart widget type on the New Widget window.
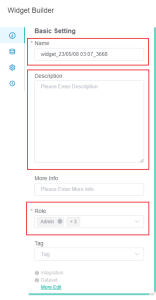
- When the Widget Builder window opens, go to the Basic Setting tab. Provide the following and click Apply:
- Name - Give the widget a name.
- Description - Give the widget a short description.
- Role - Select or edit the roles that will have access to the widget. The roles selected by default are Admin, User, and Dashboard Only.
- Go to the Dataset tab and click the
 Add Dataset button.
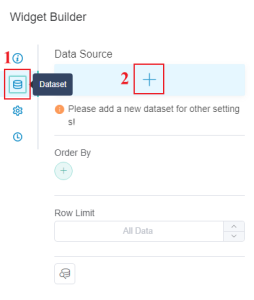
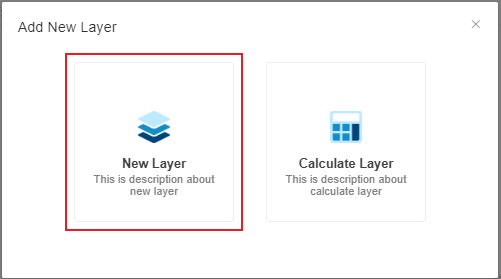
- Select New Layer when the Add New Layer window opens. This action will bring up the Dataset window.
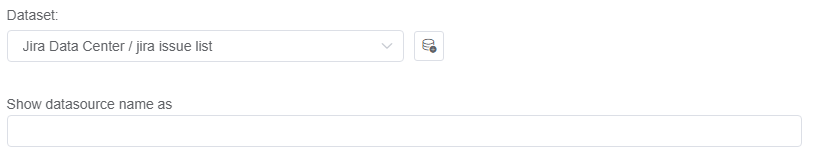
- On the Dataset window,
- Select the Dataset containing the information you want to use.
- Give a Name for the Datasource (optional).
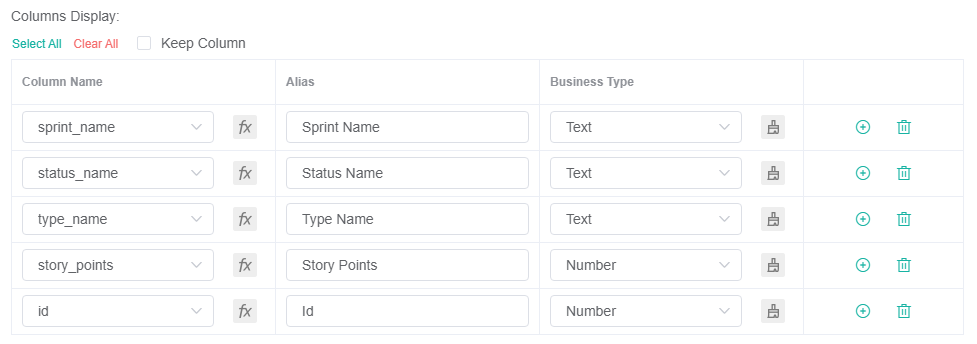
- For Columns Display,
- Using the Column Name dropdown, select the field you want to show in the drill through. Click the
 button to add more rows.
 - Give an Alias and select a Business Type for each.If the Business Type is Number, please refer to: Options for Custom Formatting in Your Widgets and Dashboards.
- Using the Column Name dropdown, select the field you want to show in the drill through. Click the
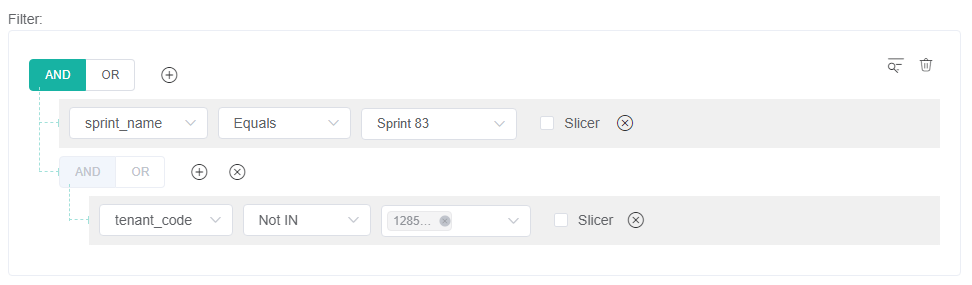
- For Filter,
- Click the button and choose between Add Condition and Add Group.
- Add all the fields you want to be filtered.
- Set a condition/logic for each field using the next 2 dropdowns. For a guide on each options, refer to: What Conditions are Available for Creating Widgets?
- Select a logical operator for the filter group (AND or OR).
- Click the
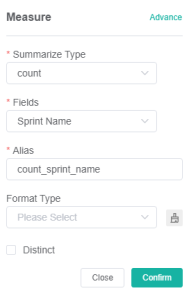
- For Measure,
- Click the
 button to show the Measure window.
 - Select a Summary Type.
- Select a Field to use in the computation.
- Give an Alias for the measure.
- Select a Format Type.
- Click Confirm.
- Click the
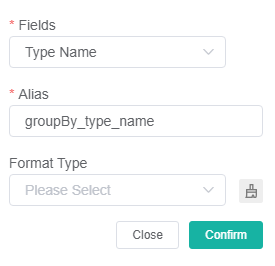
- For Dimensions,
- Click the button.
- Select a field to be used for grouping the data.
- Give an Alias for the measure.
- Select a Format Type.
- Click Confirm.
- Click the
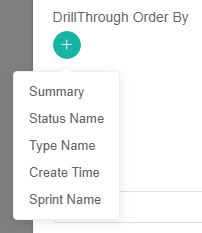
- For DrillThrough Order By,
- Click the
 button.
 - Select a parameter. This will automatically sort according to the selected parameter without manual sorting.
- Click the
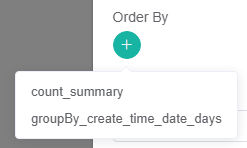
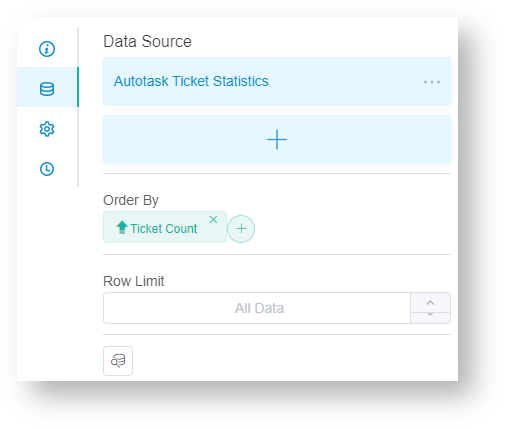
- For Order By,
- Click the button.
- Select a parameter.Sorts the data based on the selected field.
- Click the
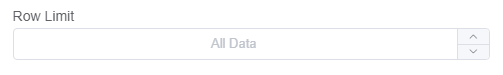
- Row Limit - Sets a limit on how many rows of data will be shown.
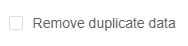
- Remove duplicate data - Please choose whether or not to enable Remove Duplicate Data based on the specific situation.
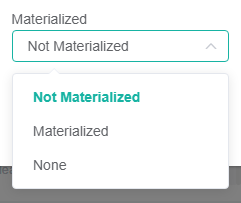
- Materialized - Please select whether to materialize based on the actual situation.
- Click Save to keep the configuration.
- Other optional settings are:
- Order By - Sorts the data based on the selected field.
- Row Limit - Sets a limit on how many rows of data will be shown.
- The same 2 options are available on the dataset tab, the difference is that they apply to the radar chart shown instead of the drill-down.
- Click Apply to save the setup.
- Go to Config tab.
Select the Dimension. This will determine which parameter to base the radar chart on.
Set the Measure. This will determine which parameters are included in the radar chart.Multiple measures can be selected.
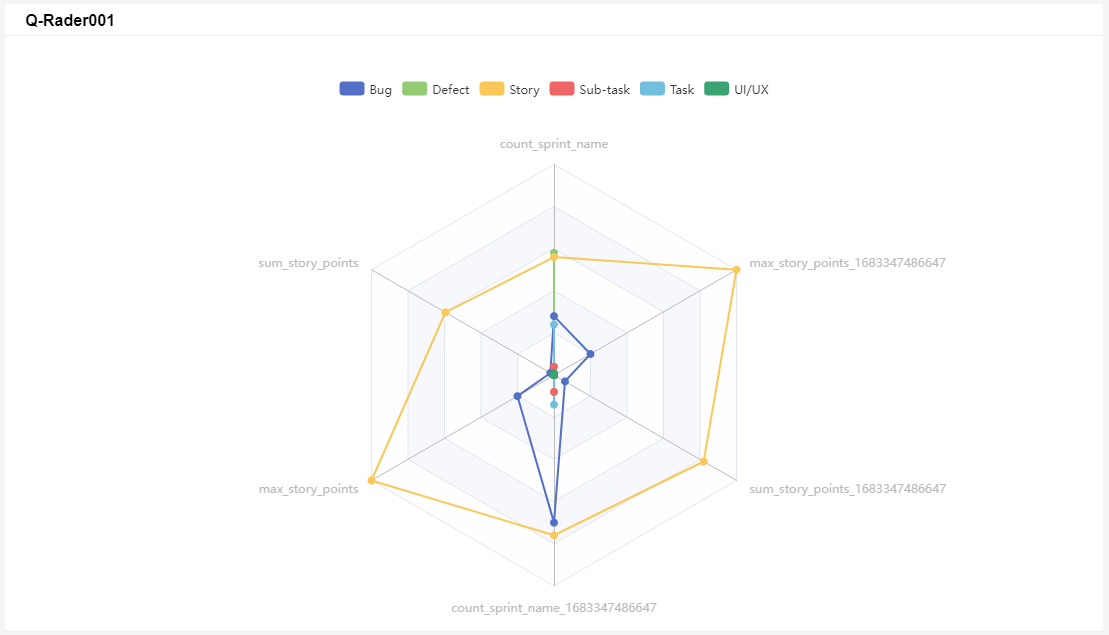
Select whether to open the Show Axis Label (default is not open).
if open, then the radar chart will display the axis label.
if not, then it will not display.
- Click Apply. This will show a preview of the radar chart created.
Overview
Content Tools
N O T I C E
MSPbots WIKI is moving to a new home at support.mspbots.ai![]() to give you the best experience in browsing our Knowledge Base resources and addressing your concerns. Click here
to give you the best experience in browsing our Knowledge Base resources and addressing your concerns. Click here![]() for more info!
for more info!