 N O T I C E
MSPbots WIKI is moving to a new home at support.mspbots.ai![]() to give you the best experience in browsing our Knowledge Base resources and addressing your concerns. Click here
to give you the best experience in browsing our Knowledge Base resources and addressing your concerns. Click here![]() for more info!
for more info!
N O T I C E
MSPbots WIKI is moving to a new home at support.mspbots.ai![]() to give you the best experience in browsing our Knowledge Base resources and addressing your concerns. Click here
to give you the best experience in browsing our Knowledge Base resources and addressing your concerns. Click here![]() for more info!
for more info!
This app gives a complete visibility on all active projects, which ones are on track in terms of delivery time and budget hours, and the total Cost Performance Index (CPI).
They can also monitor projects per status, customer, and project manager. Users can deep dive on active project tickets to see more details affecting project completion.
List of Dashboards
Dashboard Name | Description |
|---|---|
| Project Summary | This dashboard provides an overview of all active projects so that stakeholders can easily monitor their progress and provide timely support. It shows the Cost Performance Index (CPI), % of on track in terms of delivery date and budget hours, and breakdown of projects per status, customer, manager. |
| Project Details | This dashboard allows users to deep dive on specific projects or customers and see more details that affect the project completion such as % Budget Remaining, Start Date, and Scheduled Date. |
| Project Completion | This dashboard shows an overview of project completion by dividing active projects based on number of days before scheduled completion date. |
| Active Project Tickets Summary | This dashboard shows the count of active project tickets per board, per status, and per date created. In addition, it gives full visibility of ageing project tickets with respect to Created Date and Last Updated Date. |
Terms and Calculations
Terms | Definition/Calculation |
|---|---|
| Cost Performance Index (CPI) | Ratio of calculated budget labor and actual labor put in a project. This helps measure the project's effectiveness and efficiency of a project. |
| % On Track Delivery Date | % of projects that are not beyond the scheduled completion date |
| % On Track Budget Hours | % of projects with actual labor hours not exceeding the budget hours |
| Budget % Remaining | (Budget Hours - Actual Labor Hours) / Budget Hours |
| Timeline % Elapsed | % of the project duration, which is computed as scheduled completion date - scheduled start date, that has elapsed |
Last Activity | Date of last time entry for a project |
| Agreement Attached | Count of unique agreements tagged to the project |
| Actual Start | Date of first time entry for a project |
| Actual End | Date of project closing |
| Days Past Schedule End | (If project is open) Number of days after scheduled completion date |
| Days to Completion | Count of days before scheduled completion date |
| Project Ticket Age | For active project tickets, calculated as (Current Date - Ticket Created Date) or (Current Date - Last Updated Date) |
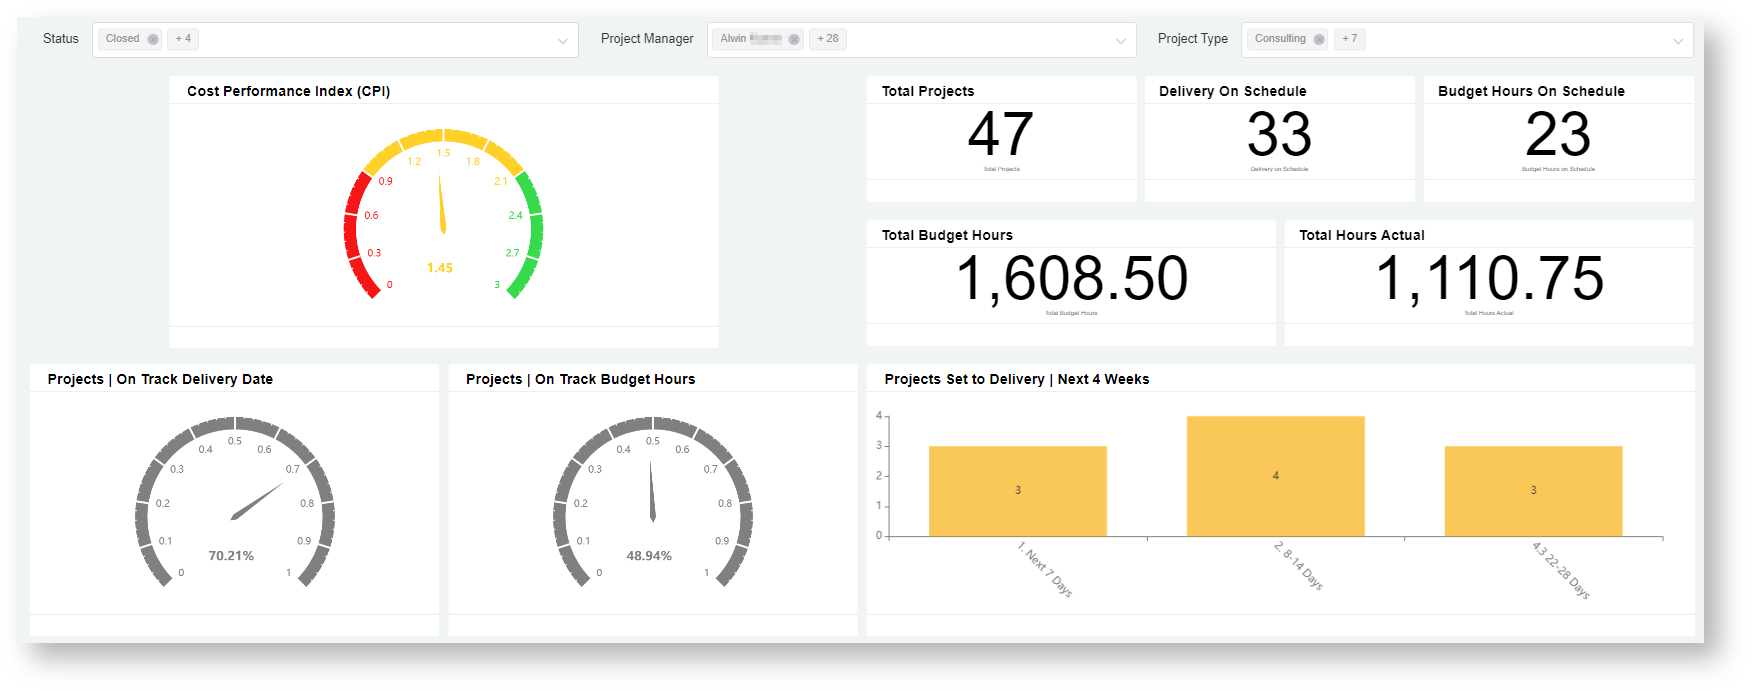
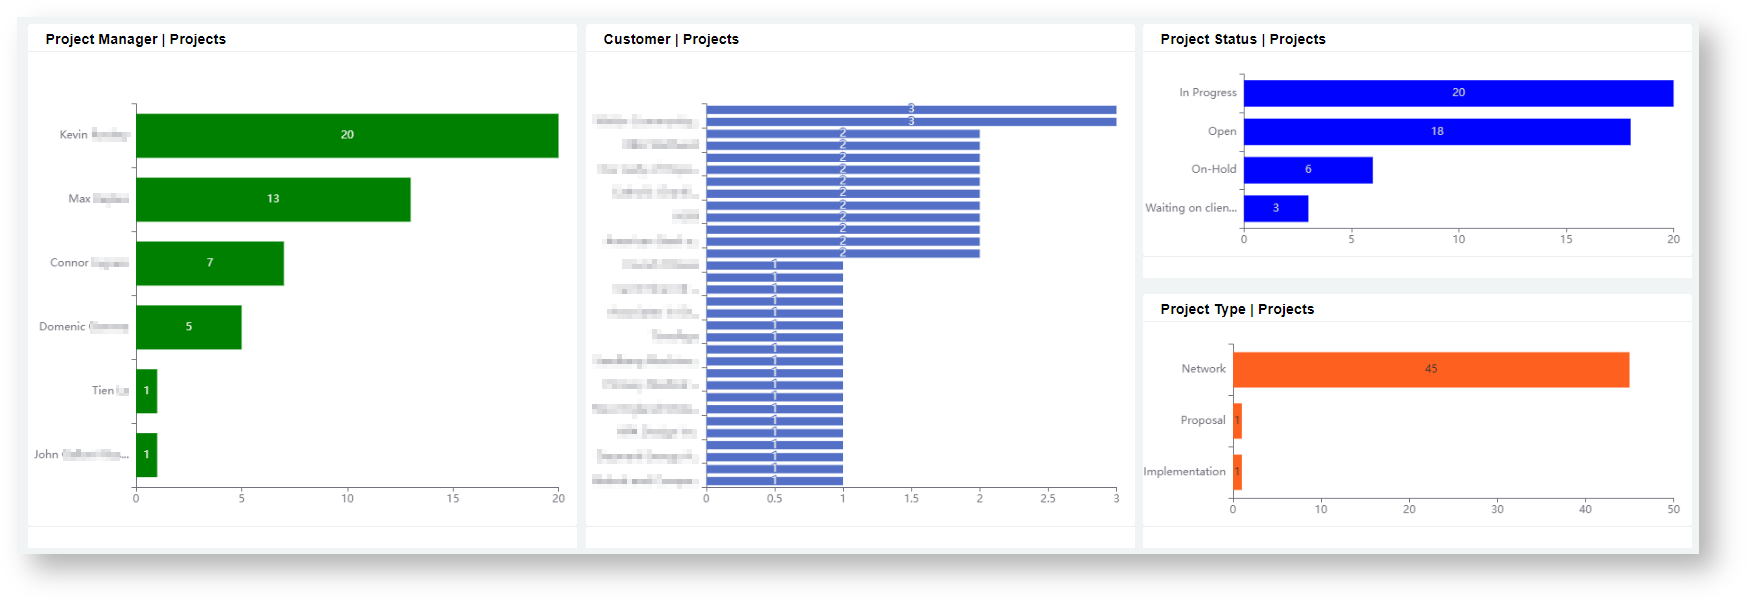
Project Summary
This dashboard provides an overview of all projects so that stakeholders can easily monitor their progress and provide timely support. It shows the Cost Performance Index (CPI), % of on track in terms of delivery date and budget hours, and breakdown of projects per status, customer, manager.
Available slicers are: Status, Project Manager, and Project Type
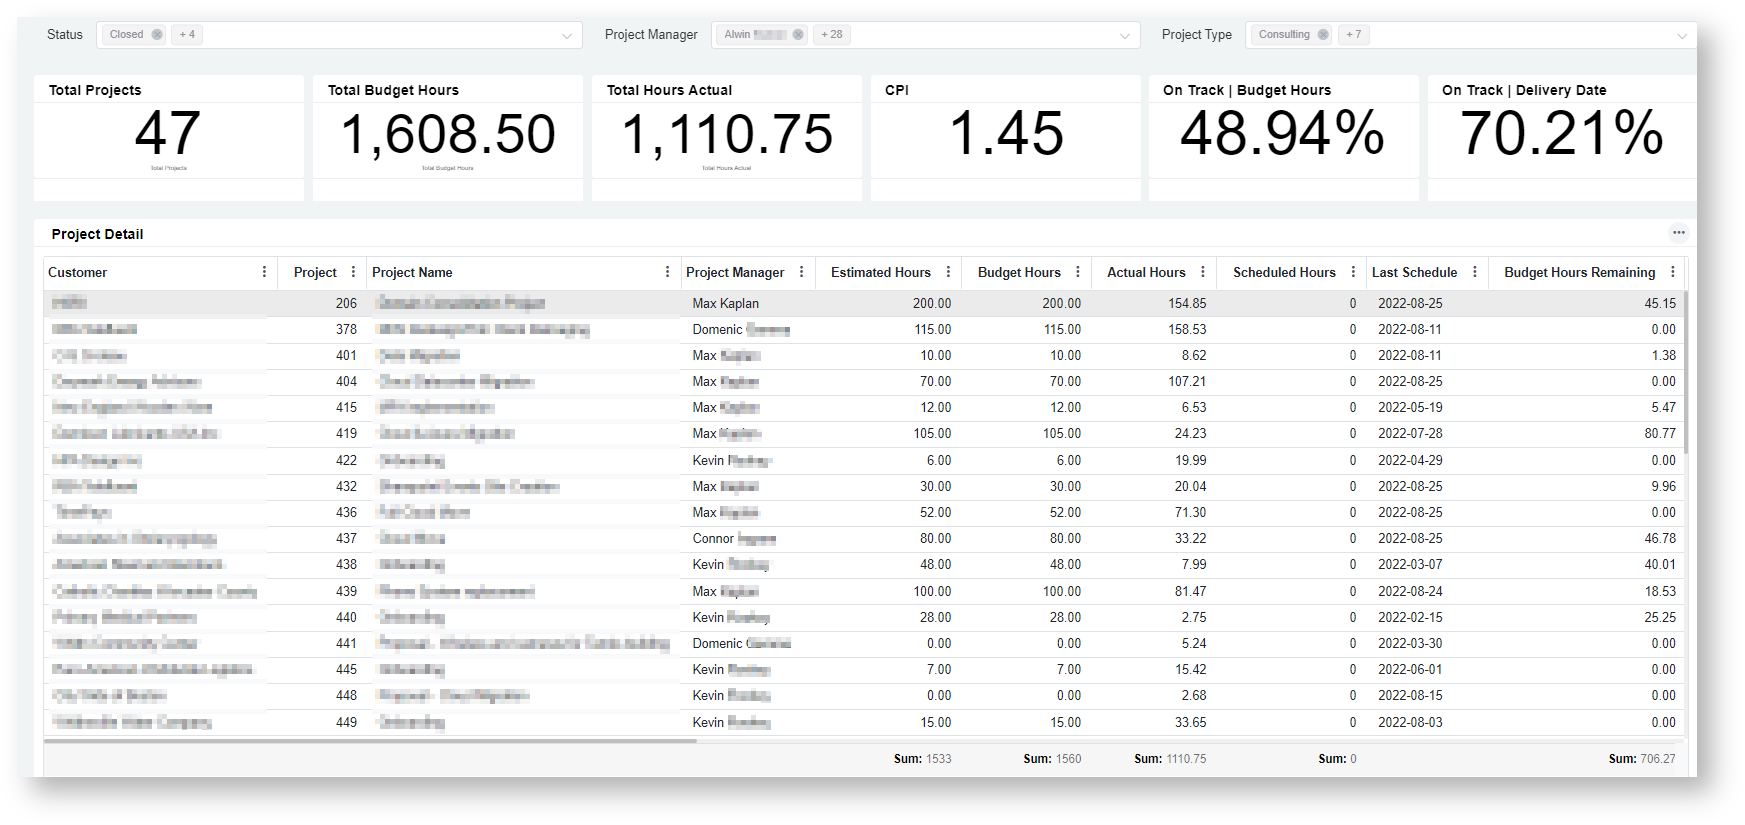
Project Details
This dashboard allows users to deep dive on specific projects or customers and see more details that affect the project completion such as % Budget Remaining, Start Date, and Scheduled Date.
Available slicers are: Status, Project Manager, and Project Type
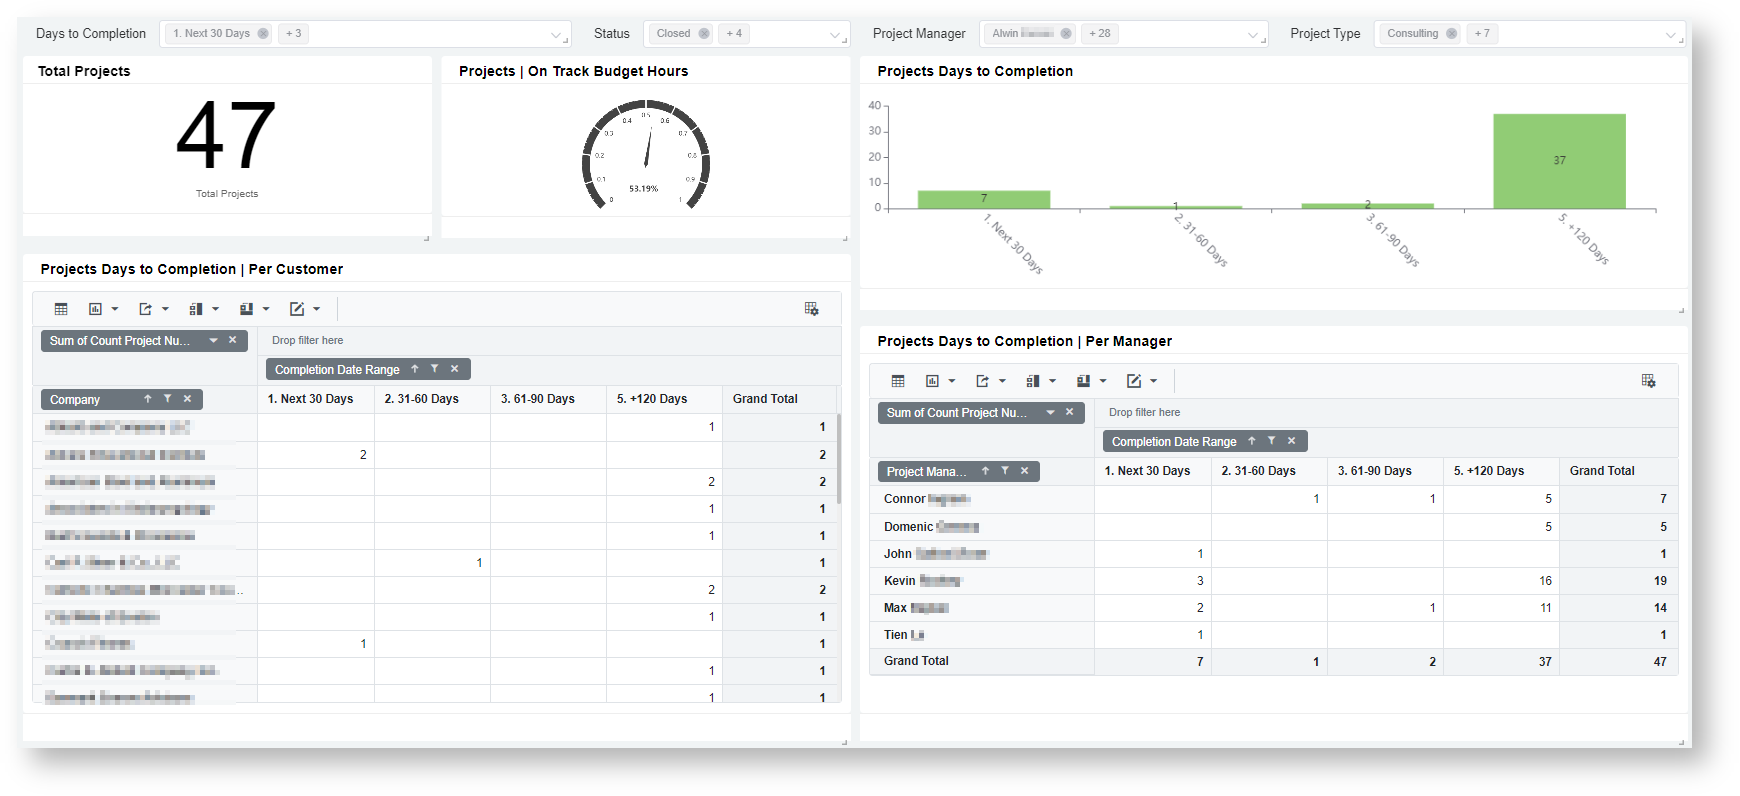
Project Completion
This dashboard shows an overview of project completion by dividing projects based on number of days before scheduled completion date.
Available slicers are: Days to Completion, Status, Project Manager, and Project Type
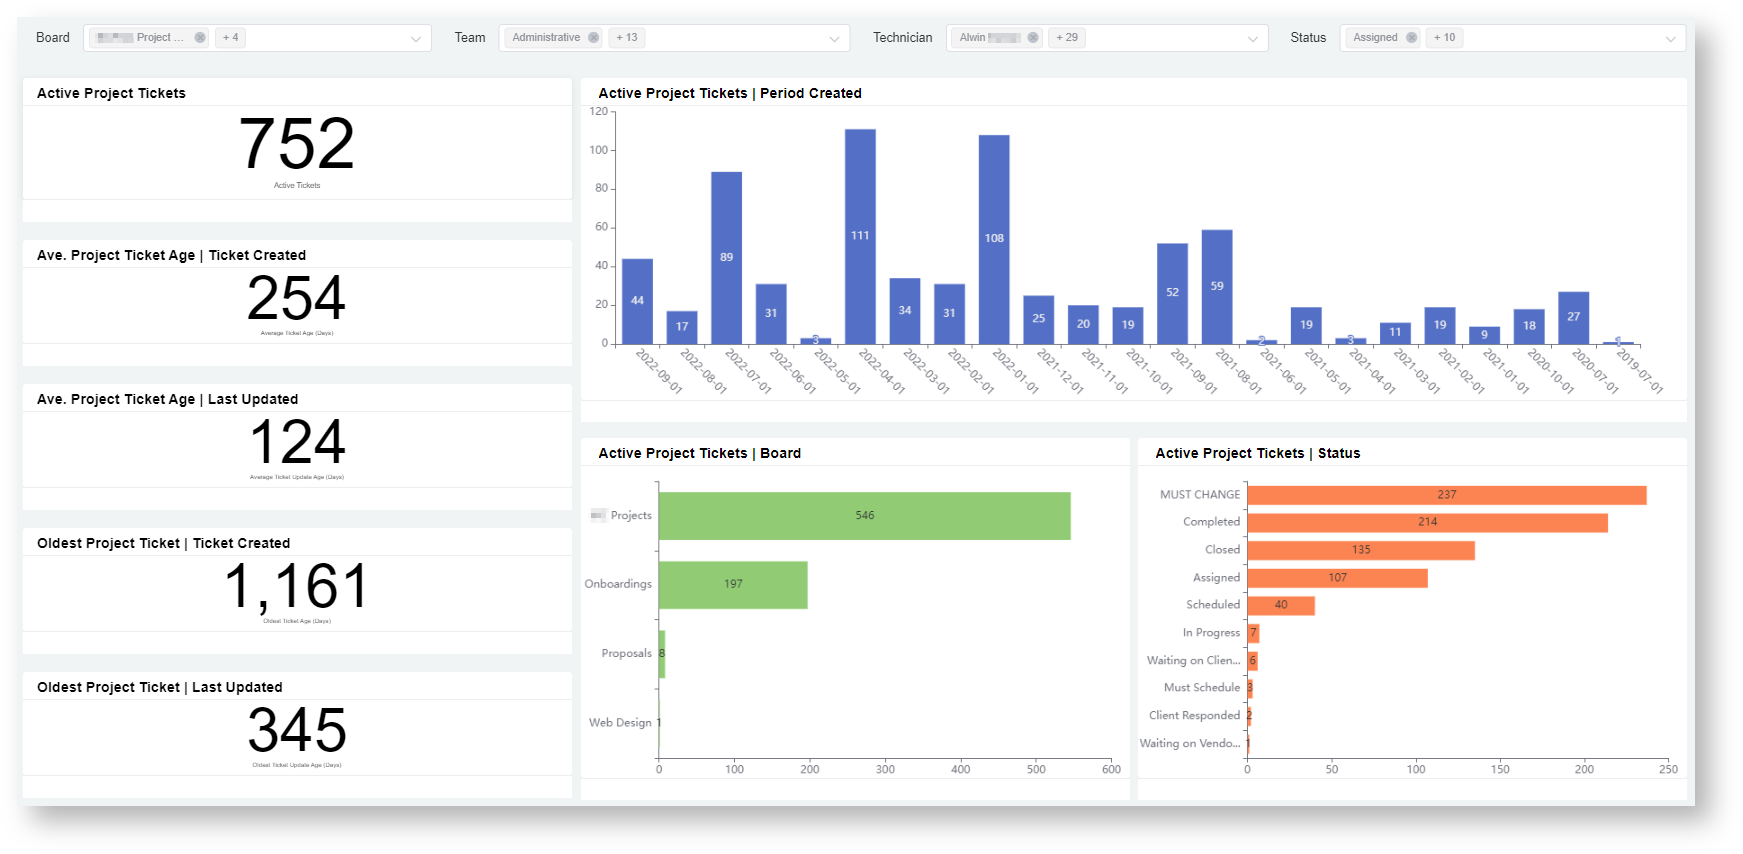
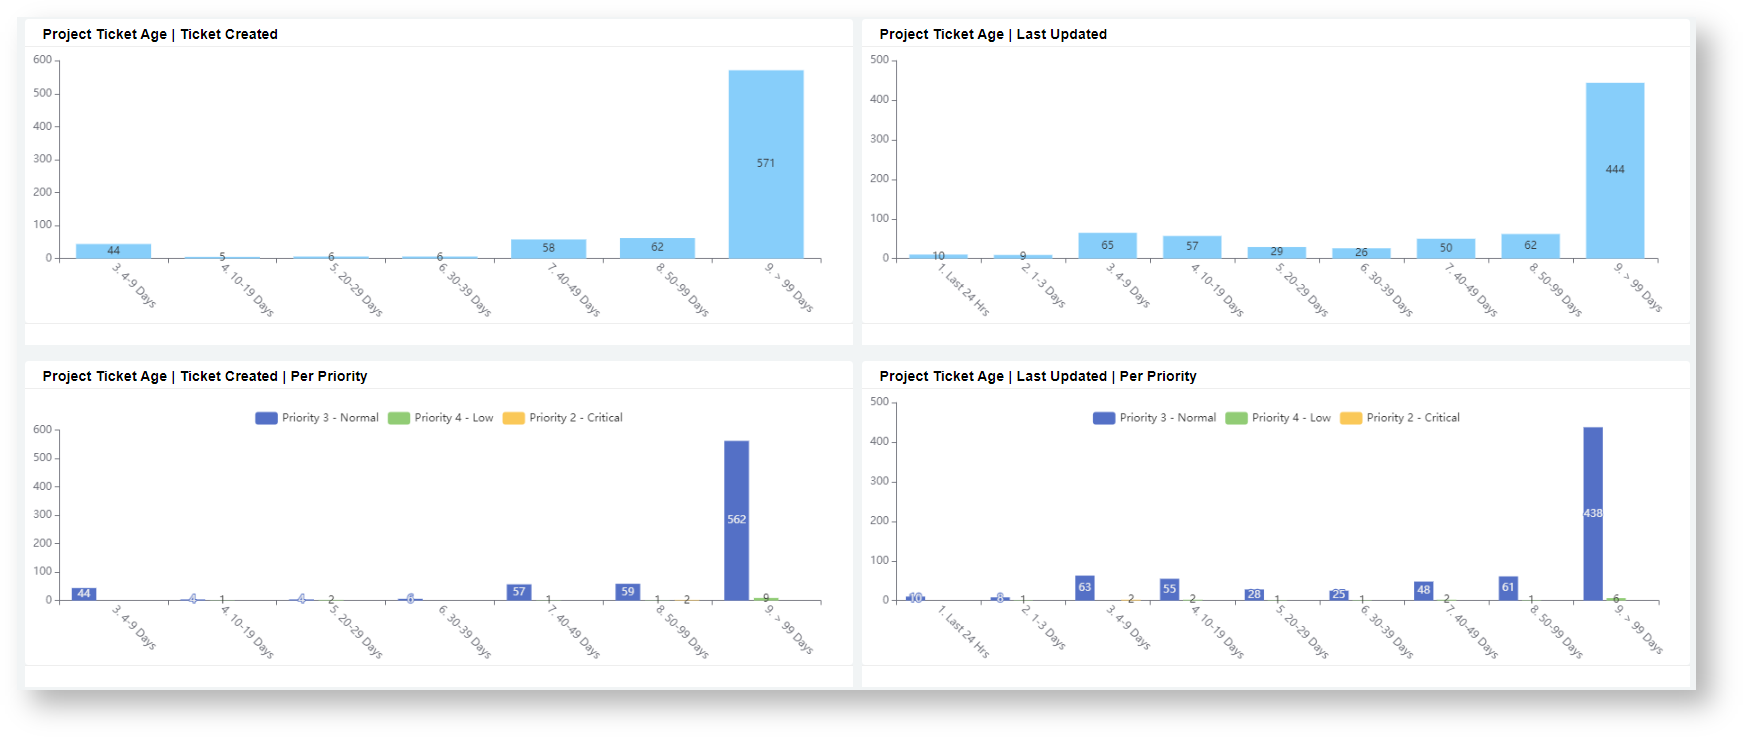
Active Project Tickets Summary
This dashboard shows the count of active project tickets per board, per status, and per date created. In addition, it gives full visibility of ageing project tickets with respect to Created Date and Last Updated Date.
Available slicers are: Board, Team, Technician, and Status
Overview
Content Tools
N O T I C E
MSPbots WIKI is moving to a new home at support.mspbots.ai![]() to give you the best experience in browsing our Knowledge Base resources and addressing your concerns. Click here
to give you the best experience in browsing our Knowledge Base resources and addressing your concerns. Click here![]() for more info!
for more info!