 N O T I C E
MSPbots WIKI is moving to a new home at support.mspbots.ai![]() to give you the best experience in browsing our Knowledge Base resources and addressing your concerns. Click here
to give you the best experience in browsing our Knowledge Base resources and addressing your concerns. Click here![]() for more info!
for more info!
Page History
| Table of Contents |
|---|
The N-able Benchmarking
...
Step 1 - Sync your software/s to MSPBots
Visit the following wiki Link on how-to integrate your software/s: https://wiki.mspbots.ai/display/MKB/Integrations
Step 2 - Install the N-able Benchmarking package
1. Login to MSPBots
2. Go to Marketplace > App page
3. Search N-able Benchmarking package. Then, click and install.
Step 3 - Setup your Accounting Mapping using the N-able template
Prerequisite: Accounting software already integrated with MSPBots
1. Login to MSPBots
2. Go Settings menu > Click Accounting Mapping

3. Under the Accounting Mapping Dashboard,
3.1. Select your Accounting Software integration e.g. Quickbooks Online.
3.2. And then, select only the Profit & Loss Statement option
4. Hover into the Map to section. Select N-able Benchmark Template.

5. To categorize, drag and drop the items (accounts) from the left to the correct mapping on the right.
6. Then click Save button to save the mapping.
Step 4 - Configure your N-able Benchmark Categories
Prerequisite: Installed N-able Benchmarking Package
1. Login to MSPBots
2. Go to Apps page
3. Under My Application page, Search N-able Benchmarking. Click to open.
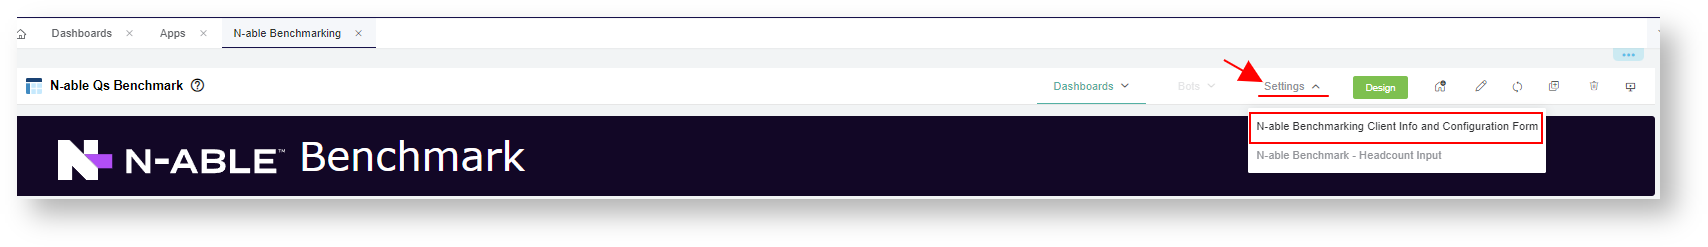
4. Hover into Settings menu. Then, click N-able Benchmarking Client Info and Configuration Form
6. How-to Configure the N-Able Client and Benchmark Configuration Form:
...
N-able Client Info and Demographics Form:
...
- This is where you input your company details, demographics and accounting period setup.
...
- Client Info Fields
- Demographics
- Accounting period
...
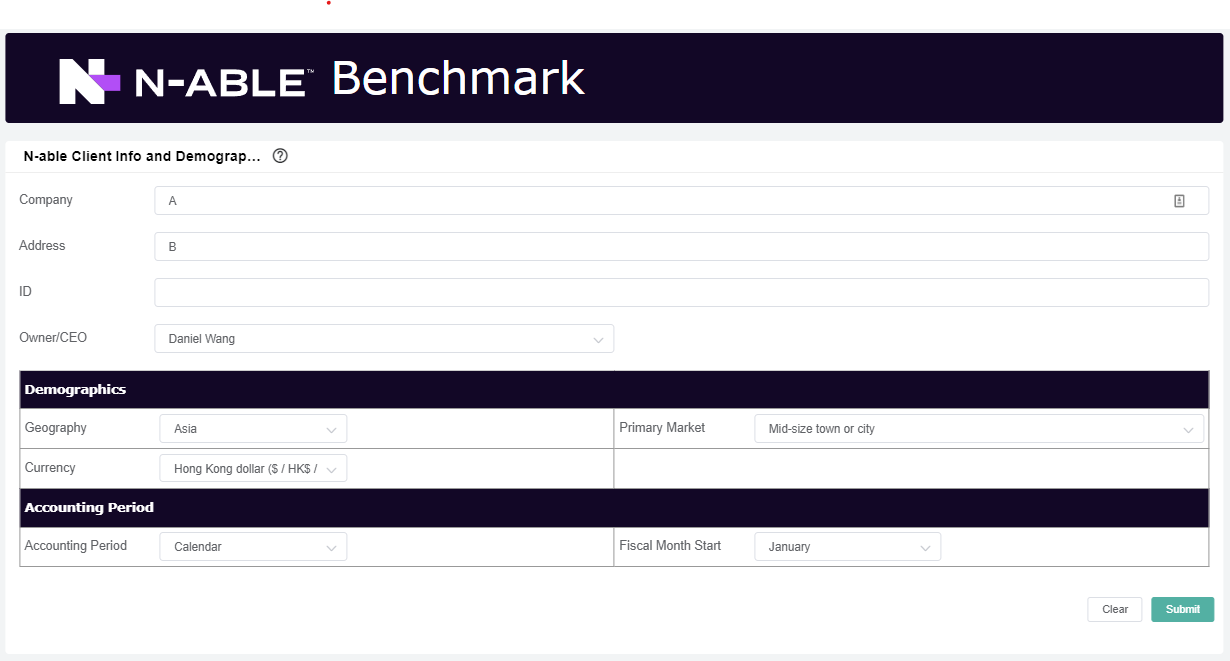
1. Update the ff:
- Company - input company name
- Address - Input your company address
- Owner/CEO/Contract - select from the drop down list of names
- Geography - In what geography do you primarily operate?
- Primary Market - select the type of primary market which you operate
- Currency - Select the currency to which your answers are entered
- Accounting Period - Select your accounting period either calendar/fiscal
- Fiscal Month Start - select your fiscal month start
2. Click Submit.
...
N-able Benchmark Configuration Form
...
- This is where you configure your categories .
- Include or exclude the lists of filter for each categories type.
...
- Managed Services
...
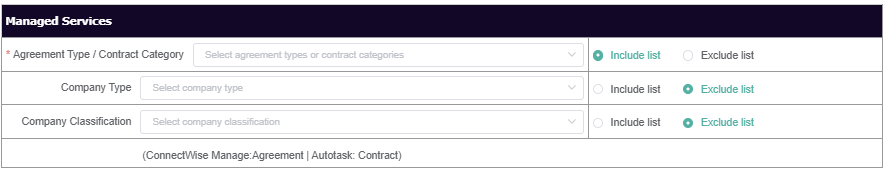
1. Select the filter types for the ff:
- Agreement Type / Contract Category - Agreement types for ConnectWise and Contracts for Autotask.
- Company Type -
- Company Classification -
2. For each field select either "Include List" or "Exclude List".
| Note |
|---|
|
...
- Managed Services Reactive Work
...
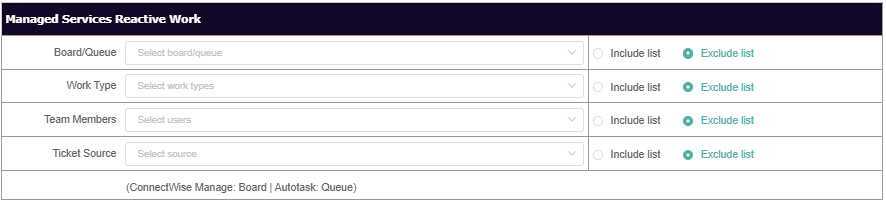
3. Select the filter types for the ff:
- Board/Queue -
- Work Type -
- Team Members -
- Ticket Source -
4. For each field select either "Include List" or "Exclude List". (see note at step 2)
...
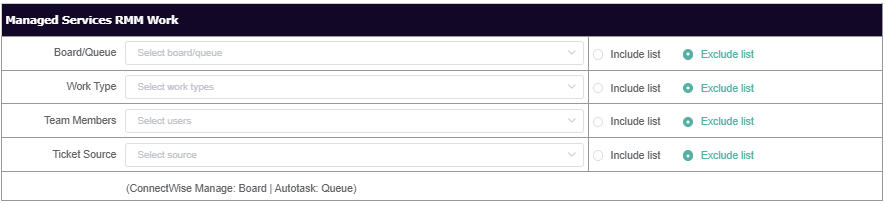
- Managed Services RMM Work
...
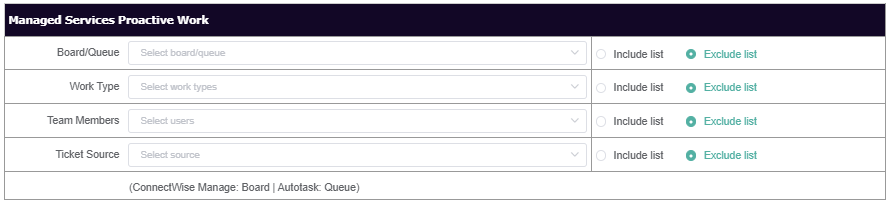
- Managed Services Proactive Work
...
...
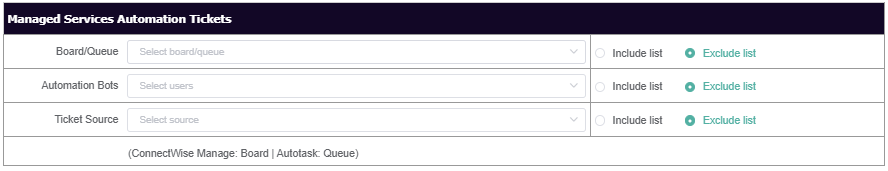
- Managed Services Automation Tickets
...
...
- Professional Services
...
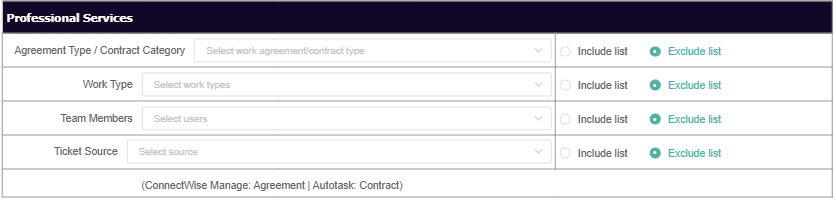
5. Select the filter types for the ff:
- Agreement Type/ Contract Category
- Work Type
- Team Members
- Ticket Source
6. For each field select either "Include List" or "Exclude List". (see note at step 2)
...
- Excluded Client on Top 3
...
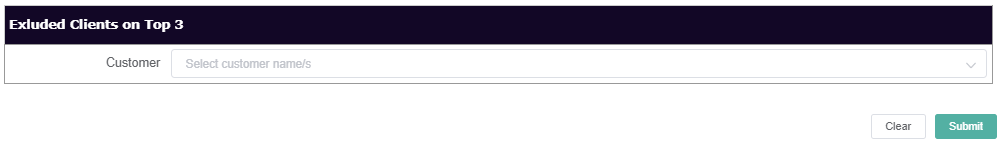
7. Select the customer/s you want to exclude in the Top 3 Clients results.
8. Click Submit.
...
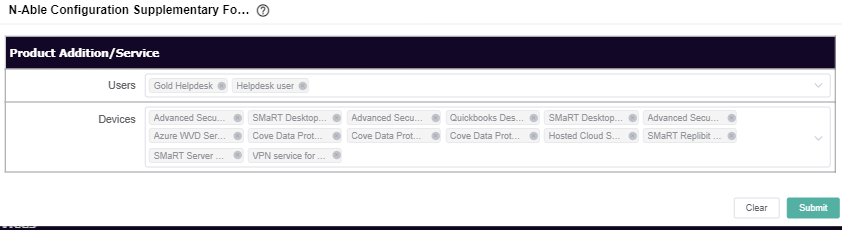
N-able Configuration Supplementary Form
...
- After the initial submission of the N-able Configuration Form, This is where to Product or Additions for Managed Services
...
- Product or Service Addition
...
| Info |
|---|
Prerequisite:
The filter results will take into account the Agreement Types/Contract for Managed Services submitted as basis for the needed type of additions. |
1. Select the the additional Managed Product or Services.
- Users
- Devices
2. Click Submit
Step 5 - Update your N-able Headcount
Prerequisite: Installed N-able Benchmarking Package
1. Open the the N-able Benchmarking app
2. Hover to the Settings menu. Then, click N-able Benchmark - Headcount Input

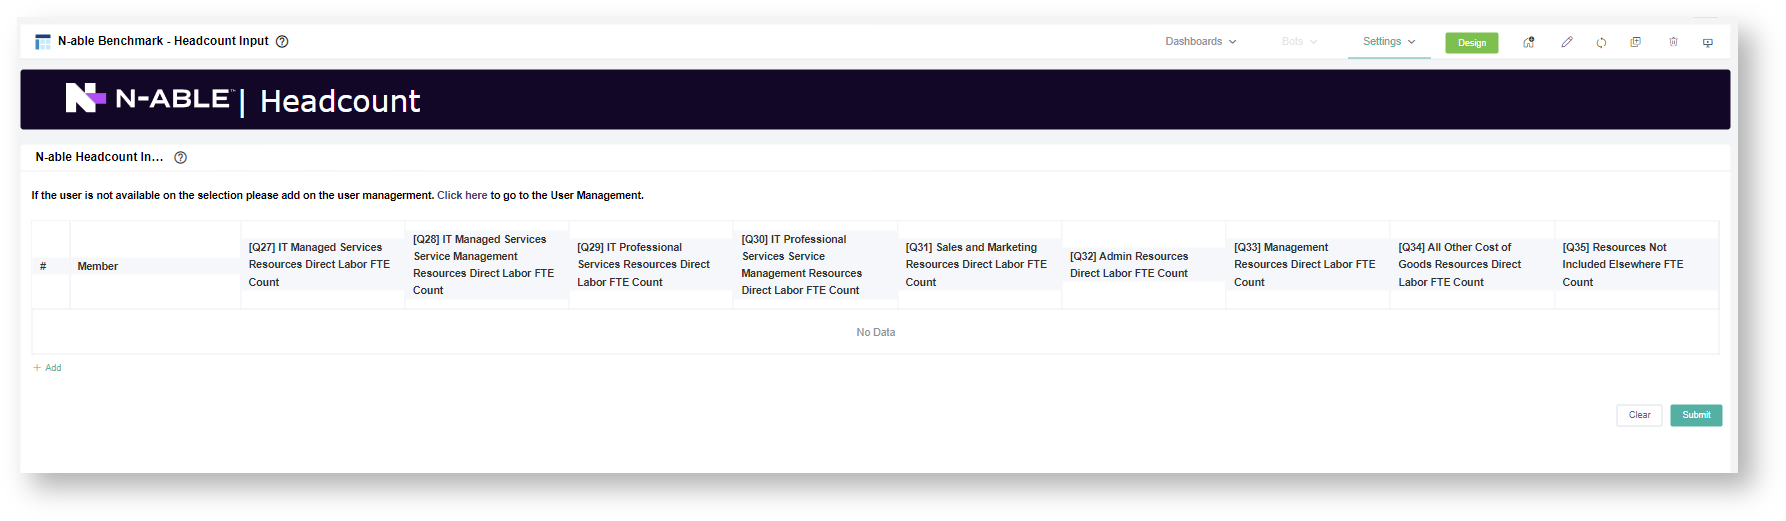
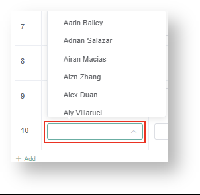
3. To add new member, click + Add.
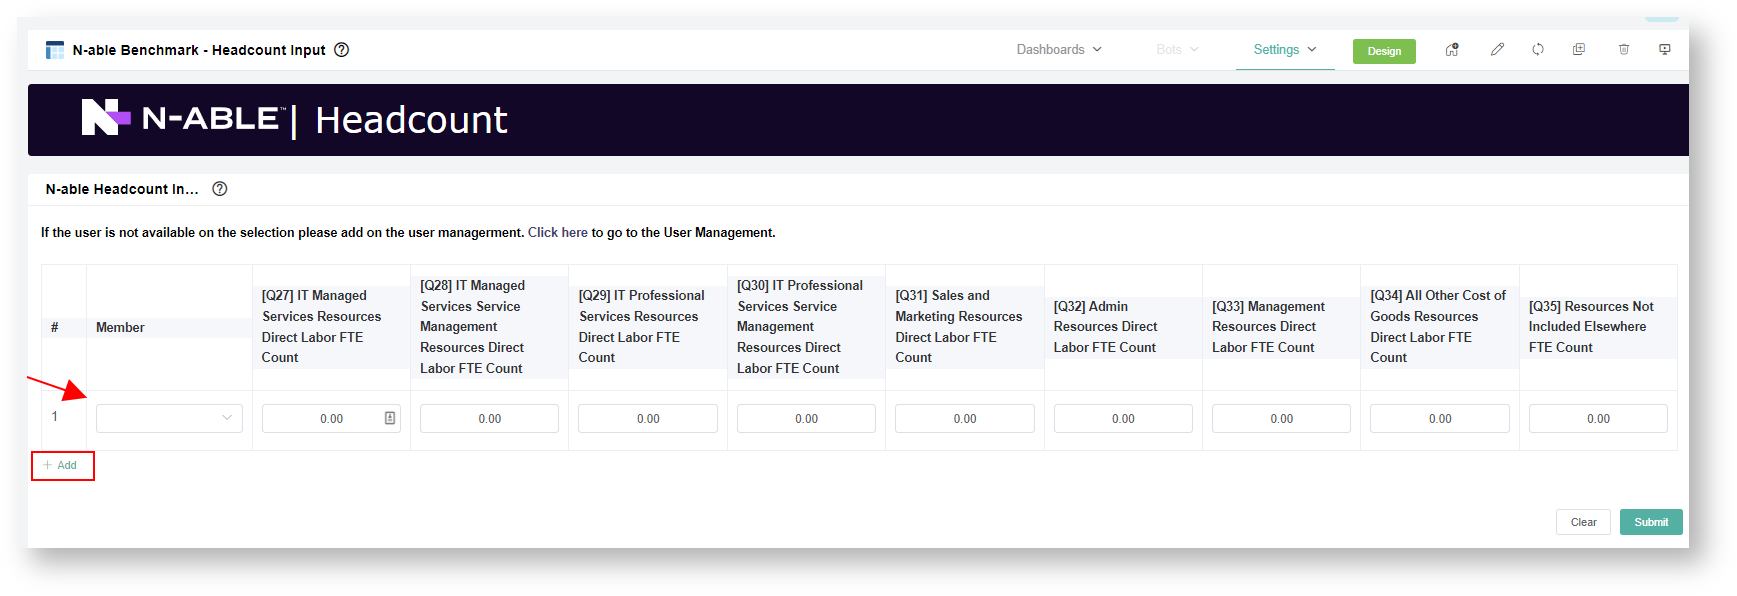
4. Then click the drop-down member field to select the specific user.
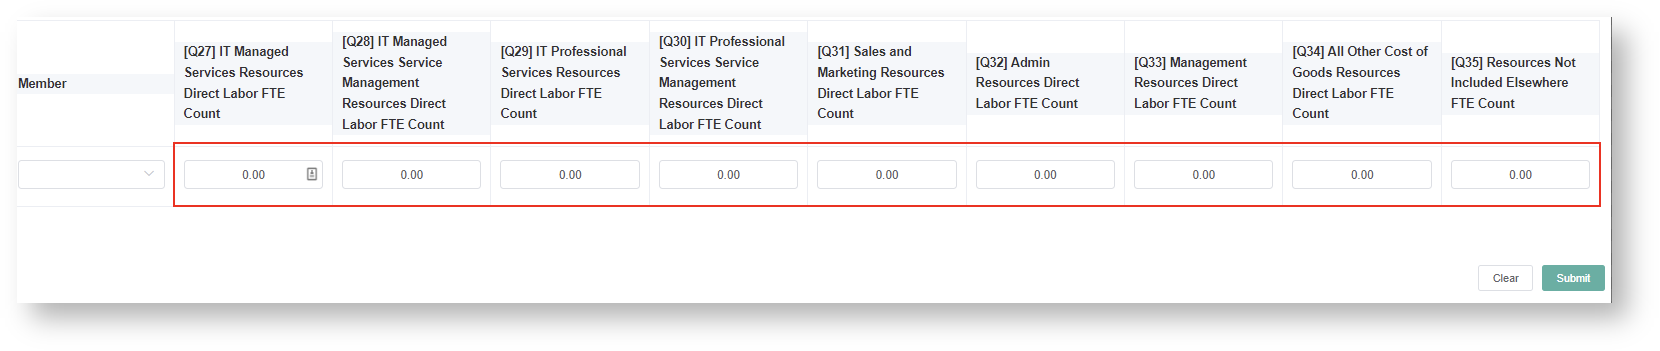
5. For each column, Input your member % Labor FTE Count per Qs resources ( allocation for IT Managed Services, IT Professional Services, Sales and Marketing, Management, All other costs, and Resources No Included)
...
| title | The percentage allocation should be in decimal values. |
|---|
5. Click Submit.
Step 6 - Review the Previous Quarter Results
Prerequisites:
Completed the following:
- Accounting Mapping setup
- N-able Configuration setup
- N-able Headcount input
1. Open the the N-able Benchmarking app
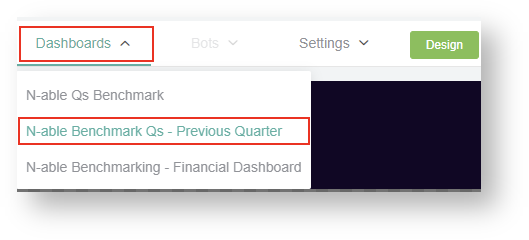
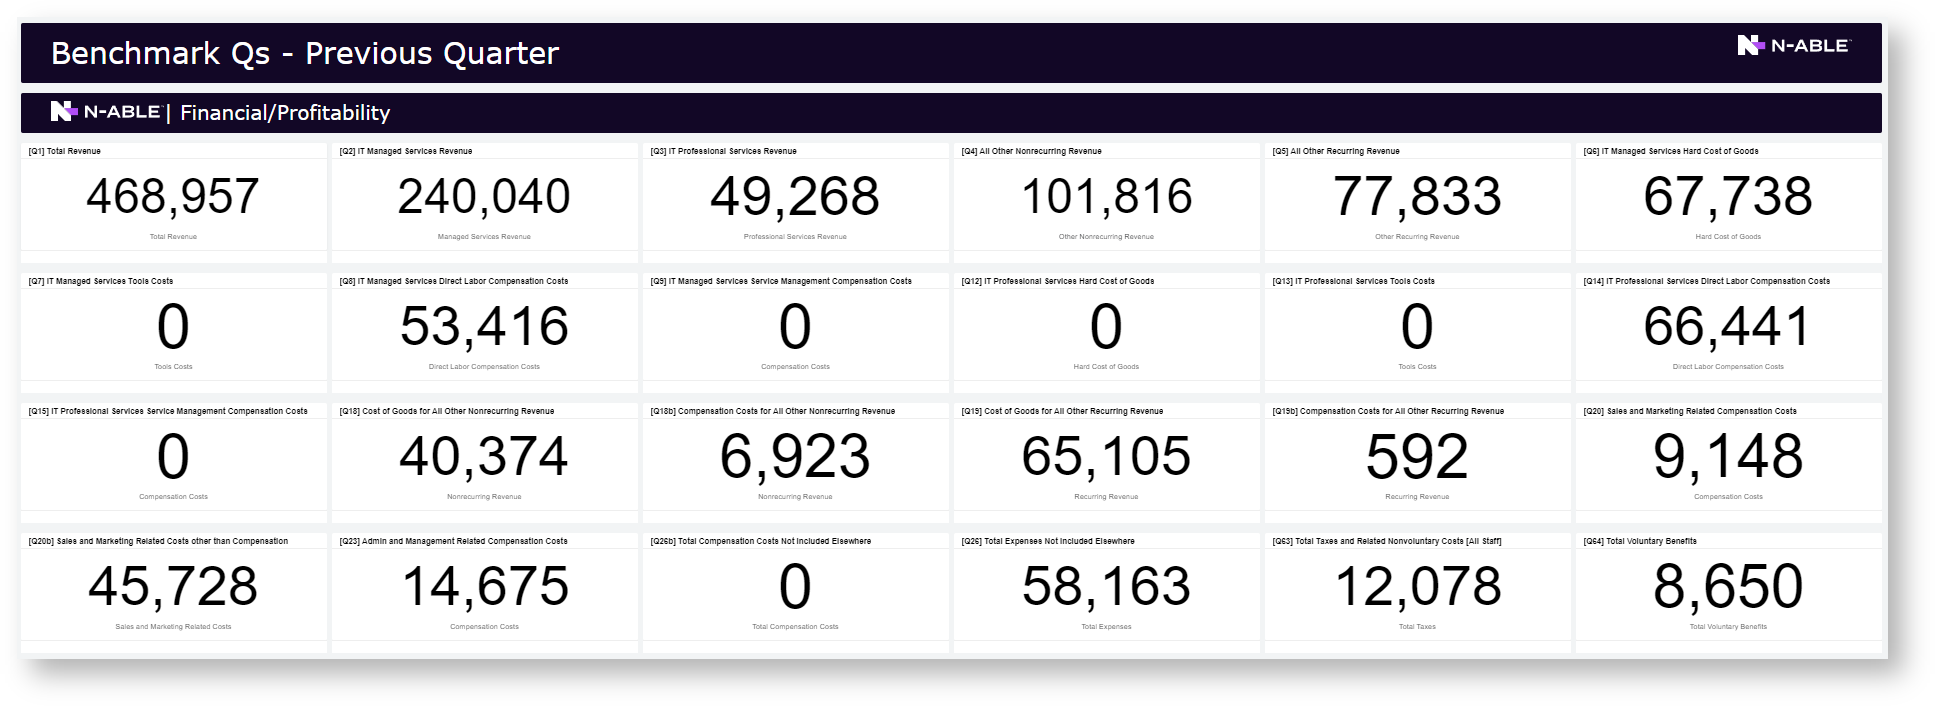
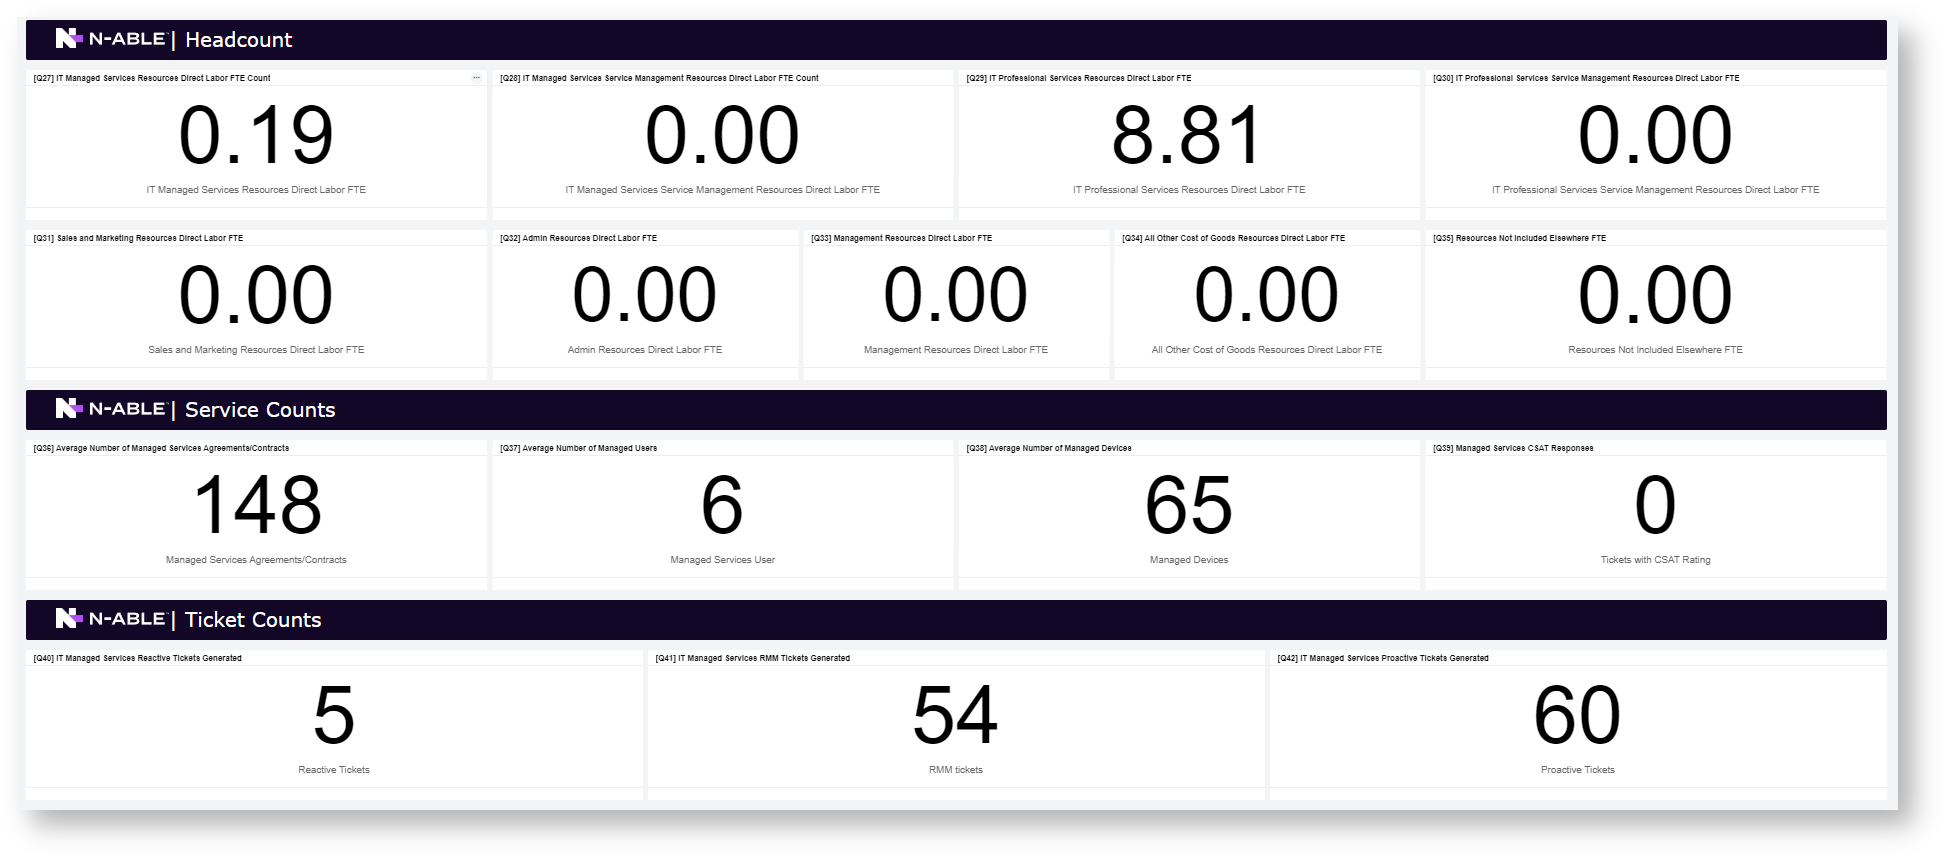
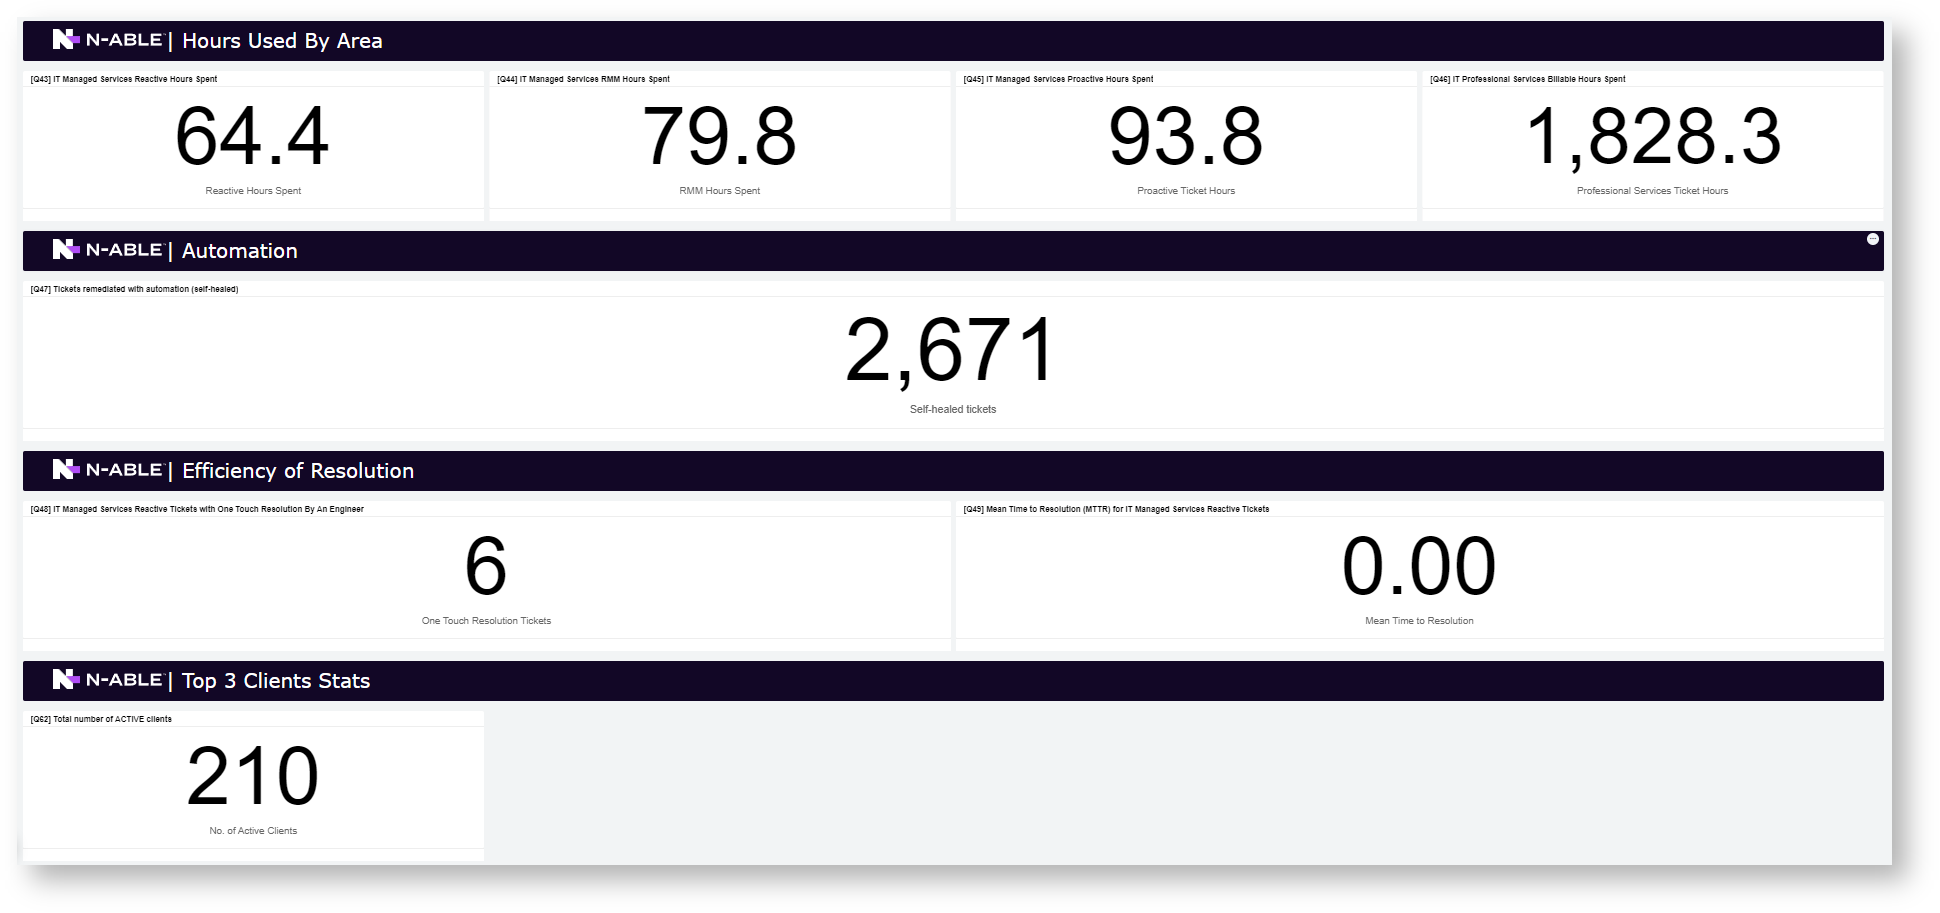
2. Hover to the Dashboard menu. Then, click N-able Benchmark - Previous Quarter
...
N-Able Benchmarking - Previous Quarter
...
3. Hover to the Dashboard menu. Then, click N-able Benchmark - Financial Dashboard
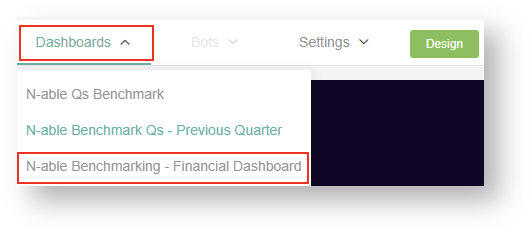
...
N-able Benchmarking - Financial Dashboard
...
Step 7 - Input you Q values for Benchmarking
Prerequisites:
Completed the following:
- Accounting Mapping setup
- N-able Configuration setup
- N-able Headcount input
1. Open the the N-able Benchmarking app
2. Hover to the Dashboard menu. Then, click N-able Qs Benchmark
...
N-able Qs Benchmark
This Dashboard contains the form for the Qs input for the benchmarking processes:
app automates data collection and calculation for 62+ key performance indicators (KPIs) for benchmarking based on the MSP Advisor standard. To get started, To get started, follow the step-by-step guide on the N-able Benchmarking App How to Set Up page. If you are an N-able client, you can get this for free. Reach out to MSPbots Product Team or MSP Advisor to get detailed information about joining the program.
This article shows the N-able Benchmarking process, who can use the app, and how to set up your N-able benchmark and quarterly updates with MSPbots.
What's on this page:
| Table of Contents |
|---|
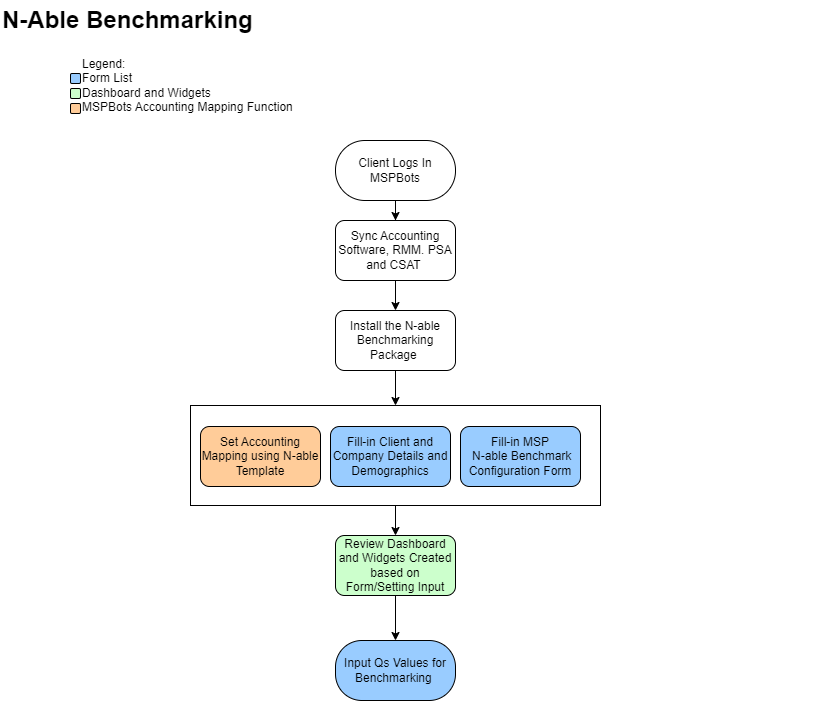
N-able Benchmarking Process
...
The N-able Benchmarking process diagram below gives an overview of how to set up your N-able benchmark.

Who can use the N-able Benchmarking app?
...
The N-able Benchmarking app is available to ConnectWise, Autotask, N-Central, Datto RMM, ConnectWise Automate, QuickBooks, and Xero users. Only individuals with admin and financial roles can edit the KPI and dashboard settings, and only captains can add new KPIs for peer groups.
How to set up the N-able Benchmarking app and settings
...
Follow this step-by-step guide for configuring the N-able Benchmarking app.
Step 1. Sync your software with MSPbots.
...
Visit the Integrations page in the MSPbots Help Center for instructions on connecting your software to MSPbots. The N-able Benchmarking app is pre-installed and available from the My Applications page of the MSPbots app. If you don't see the app on the list, proceed to Step 2 below.
Step 2. Install the N-able Benchmarking Package.
...
| Note |
|---|
Only MSPbots and its partners can do the following installation steps. To install the N-able Benchmarking Package, send an installation request to our partner MSP Advisor at dave@mspadvisor.com, or email us at product@mspbots.ai. |
To install the N-able Benchmarking app:
- Log in to the MSPbots app and go to Marketplace> Apps.
Locate the N-able Benchmarking package and click it to install.

Step 3. Set up your Accounting Mapping using the N-able template.
...
| Note |
|---|
Your accounting software must be fully integrated with MSPbots before you can successfully set up Accounting Mapping. |
- On the MSPbots app, click Settings > Accounting Mapping.
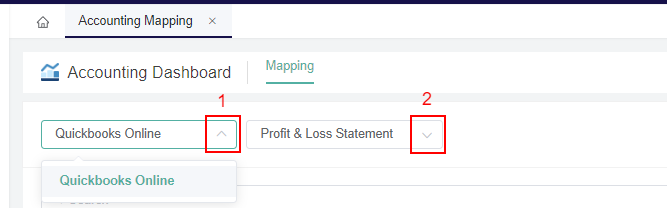
- On the Accounting Mapping tab, go to the Accounting Dashboard section.
- Select your Accounting Software integration, e.g., Quickbooks Online,and click the Profit & Loss Statement option.

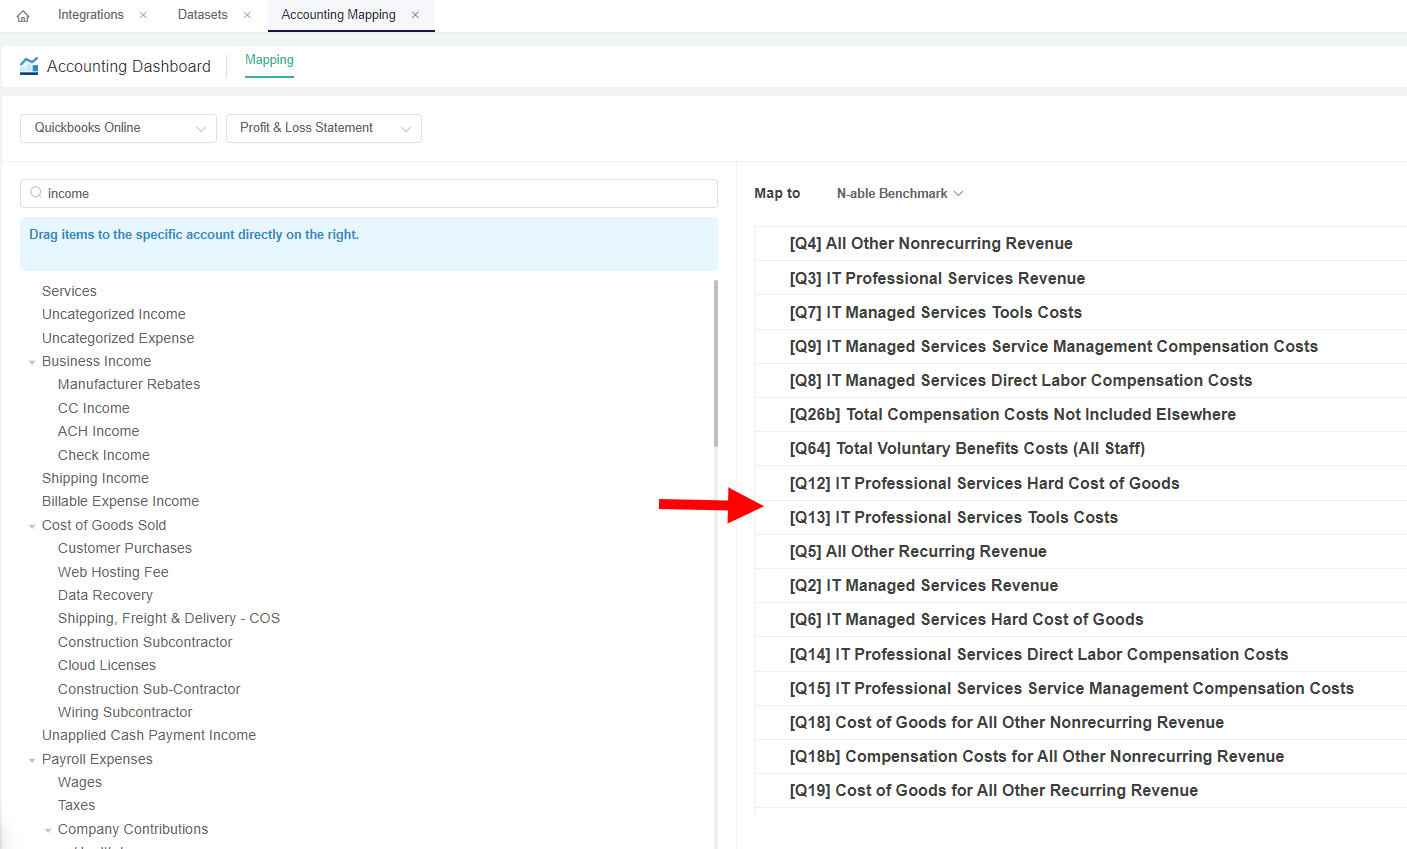
- Go to the Map to section and select N-able Benchmark from the templates.
- Next, categorize by dragging and dropping the accounts from the left to the correct mapping on the right.

- Click the Save button to save the mapping.
Step 4. Configure your N-able benchmark categories.
...
- Go to Apps on the MSPbots app.
Locate N-able Benchmarking on the My Applications page and click on it to open.

Note Only MSPbots and its partners must do the installation. To install the N-able Benchmarking Package, please send an installation request to our partner, MSP Advisor at dave@mspadvisor.com, or email us at product@mspbots.ai.
- Go to Settings and select each configuration form.

- Click N-able Benchmark Client Information and Demographics Form. This form is where you enter your company details, demographics, and accounting period setup.
- Enter the details and click Submit.
- Next, click N-able Benchmark Configuration Form. This form is where you will set filters to break your operational data into various service categories.
- Set the filters for each category to include or exclude lists. This will be the basis for the calculation. Click Submit when done.
- Lastly, select N-able Configuration Managed Users and Devices Form. This is where you will detail how you count your managed users and devices. supplementary configurations for your Managed Services corresponding to the Product Additions/Services.
- Go through each setup and click Submit.
Step 5. Update and allocate your N-able Headcount % Labor FTE.
...
- Open the N-able Benchmarking app.
- Go to Settings and select N-able Benchmark - Headcount Input.

- Refer to the widget for N-able Headcount Q Benchmark Reference-Last Quarter Hours Allocation for the auto-calculated allocation percentage results between your Professional Services, Managed Services, and Non-Ticket Service Tickets Hours.

- Scroll down to the N-able Headcount Form Input section and allocate your % Labor FTE for each headcount. You can override or use the Q27 and Q29 IT Professional Services Resources Direct Labor FTE previous quarter results. For each column, input your member % Labor FTE Count per Qs resources. This includes the allocation for IT Managed Services, IT Professional Services, Sales and Marketing, Management, All other costs, and Resources Not Included.

The percentage allocation should be in decimal values (total 1.00 max value).
The Advance Headcount switch allows the user to input Qs data with more granularity and provides a comprehensive view of labor costs, enabling better decision-making, cost control, resource optimization, and improved overall efficiency and performance within your MSP.
When the Advance Headcount switch is enabled, the direct labor calculations for the following Qs are more detailed:- [Q27] Subtotal - Managed Services Resources
- [Q27a] IT Tier 1 Managed Services Resources Direct Labor Contribution
- [Q27b] IT Tier 2 Managed Services Resources Direct Labor Contribution
- [Q27c] IT Tier 3 Managed Services Resources Direct Labor Contribution
- [Q27d] IT Triage Managed Services Resources Direct Labor Contribution
- [Q27] Subtotal - Managed Services Resources
- [Q29] Subtotal - Professional Services Resources
- [Q29a] IT Tier 1 Professional Services Resources Direct Labor Contribution
- [Q29b] IT Tier 2 Professional Services Resources Direct Labor Contribution
- [Q29c] IT Tier 3 Professional Services Resources Direct Labor Contribution
- [Q31] Subtotal - Sales and Marketing Resources
- [Q31a] "Hunter" Sales Resources Direct Labor Contribution
- [Q31b] "Farmer" Sales Resources Direct Labor Contribution
- [Q31c] Hybrid "Hunter/Farmer" Sales Resources Direct Labor Contribution
- [Q31d] Inside Sales Resources Direct Labor Contribution
- [Q31e] Marketing Resources Direct Labor Contribution
- [Q31f] Sales and Marketing Admin Resources Direct Labor Contribution
- [Q31g] Sales and Marketing Management Resources Direct Labor Contribution
- [Q33] Subtotal - Management Resources
- [Q33a] Other Middle Management Resources Direct Labor Contribution
- [Q33b] C-Level Resources Direct Labor contribution
- [Q34] Subtotal - All Other Cost of Goods Resources
- [Q34a] All Other Nonrecurring Cost of Goods Resources Contribution
- [Q34b] All Other Recurring Cost of Goods Resources Contribution
To show top-level values only, switch the Advance Headcount toggle off.
- Click Submit. The data entered in the form will be the basis for calculation.
- You can click +Add if more headcounts need to be added then repeat Steps 4 to 5.
Step 6. Review the previous quarter's results.
...
| Note |
|---|
The following must be configured before you can review the dashboards:
|
N-able Benchmarking - Qs Yearly Results
This dashboard displays the previous quarter's results per category. To review this dashboard:
- Open the N-able Benchmarking app.
- Go to Dashboards and click N-able Benchmark - Qs Yearly Results.

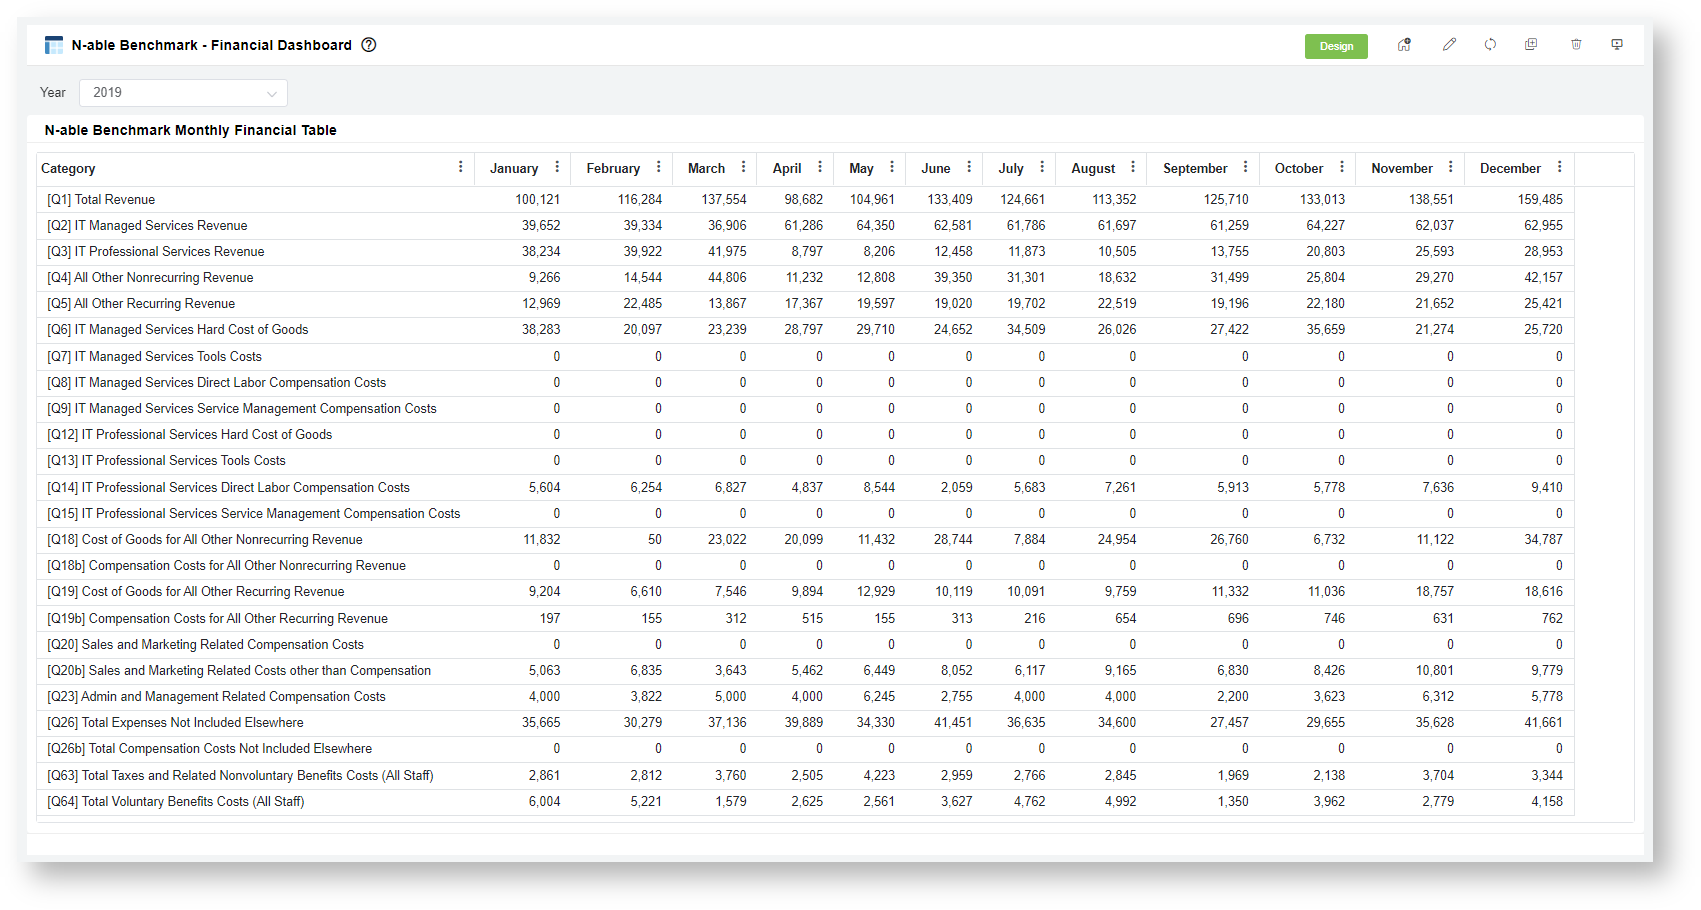
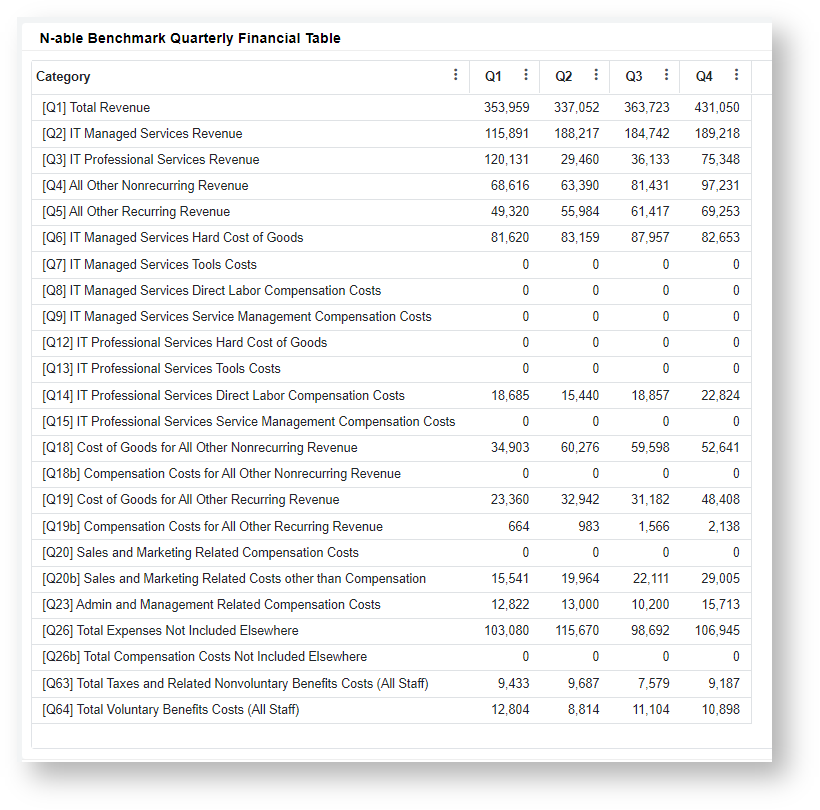
N-able Benchmarking - Financial Dashboard
This displays the monthly and quarterly total amount per category (Qs) in a given year.
To review this dashboard:
- Open the N-able Benchmarking app.
Go to Dashboards and click N-able Benchmark - Financial Dashboard.

Step 7. Submit your quarterly data to the benchmark.
...
The N-able Qs Benchmark dashboard contains the form for the Q values needed for the quarterly benchmarking. At the end of each quarter
...
, you can create a new Q Benchmark record.
...
The form automatically pulls
...
the various Q values
...
for the previous quarter's results.
...
You can also opt to manually input the data
...
for the benchmark
...
in the manual column.
3. To add a new benchmark record, Click the New button
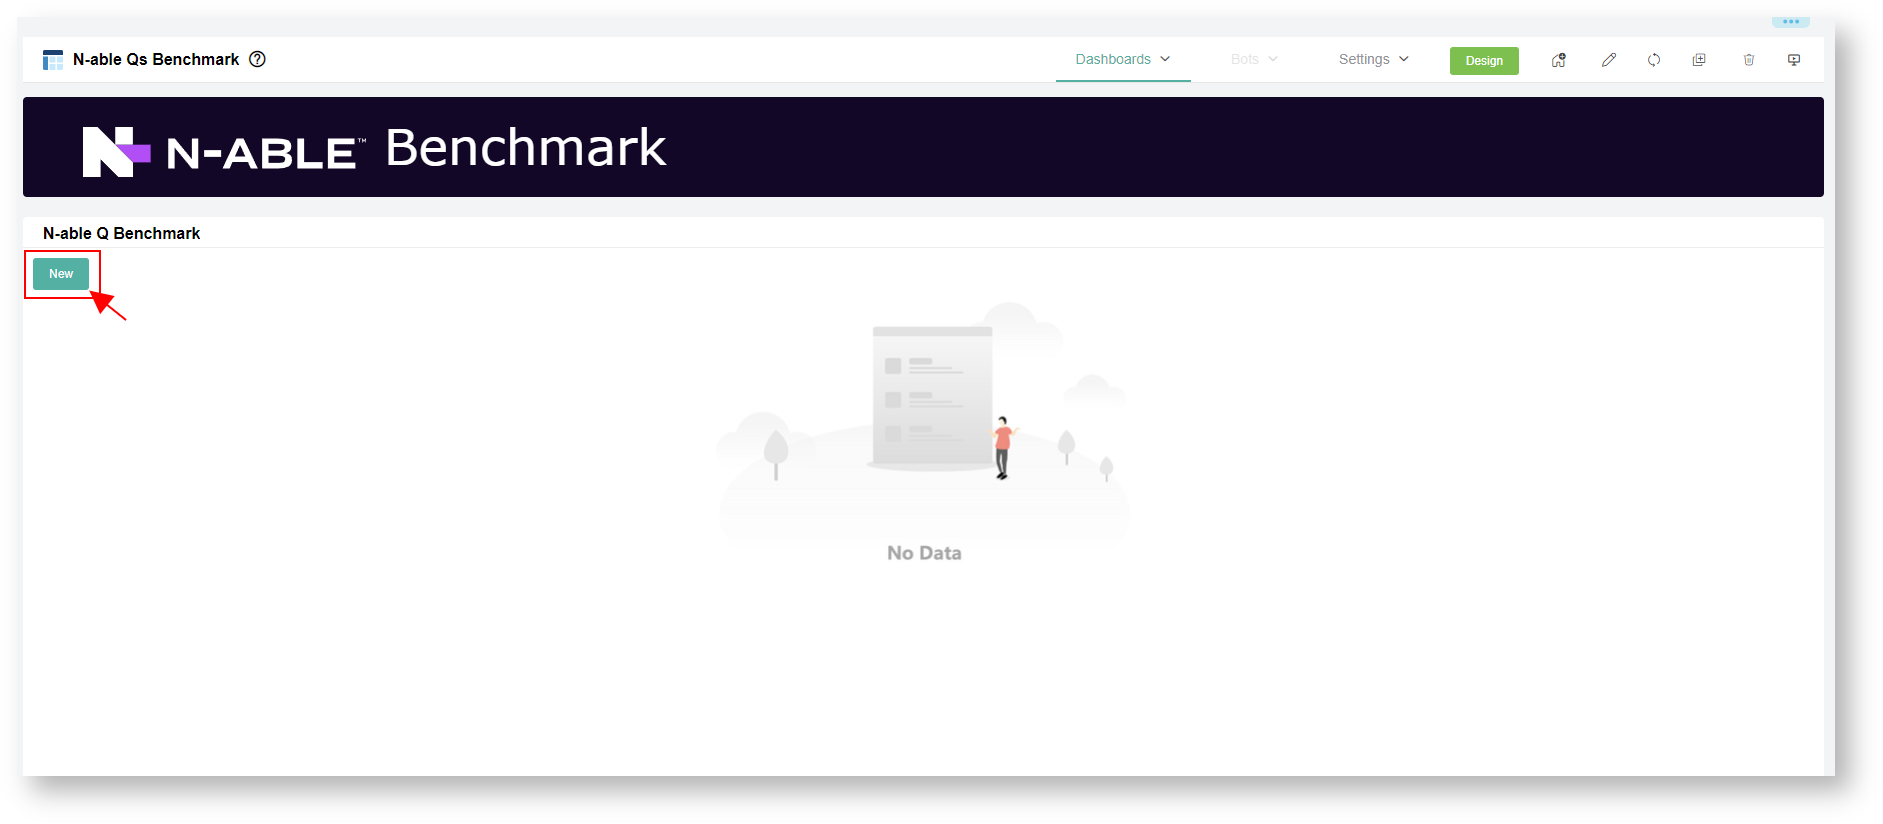
...
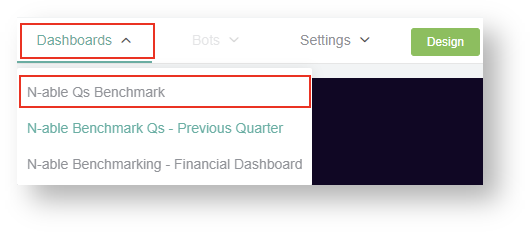
To access the N-able Qs Benchmark form:
- Open the N-able Benchmarking app.
- Go to Dashboards and click N-able Qs Submission Form.

- Add a new benchmark record by clicking the New button.

- Update the Q Benchmark form
...
- .
- Select a Year.
- Select a Quarter
- .
- Enable the Publish to MSP Advisor toggle switch to publish the result.

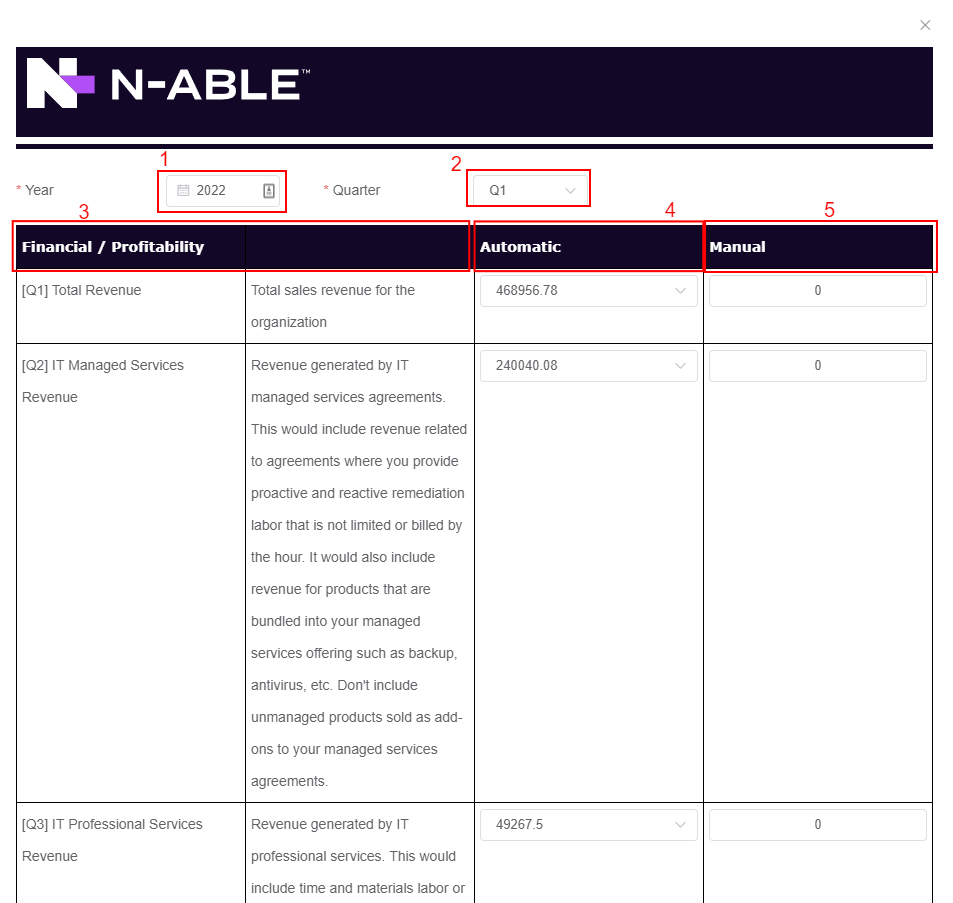
- Scroll down Qs Category(Financial / Profitability) to see the definitions and all the Qs categories for input.
- Go to the Automatic column
- to automatically see the previous quarter's Qs results
- . If the Automatic column shows a value of zero (0), then you need to manually input your Qs data.
- Enter a new value in the Manual column if you prefer not to use the automatic data. The app will use the manual data over the automatic result.
...
| title | If the Automatic column shows ZERO value, then you need to manually input your Qs data. |
|---|
...
- After updating all the Q values, click the Add button to save the record.
...
| title | See the list of Benchmark Qs Definition |
|---|
Benchmark Qs Definition
...
Step 8. View your Qs widget benchmarking results.
...
To view the N-able Benchmarking Qs Widgets calculation results per category:
- Open the N-able Benchmarking.
- Go to Dashboards and click the N-able Qs Benchmarking

Step 9. Review exception tickets.
...
To access the N-able Exception Report:
- Open the N-able Benchmarking.
- Go to Dashboards and click the N-able Exception Report.

Exception data pertains to tickets that did not meet the logical setup based on your N-able Benchmark Configuration (Refer to Step 4).These are:
- Non-service Time Entries
- Dual-service Tickets (Tickets tagged as both Managed and Professional)
- Uncategorized Service Tickets
- Implied Professional Service Tickets
The N-able Exception Report helps you review and analyze tickets to properly set up your benchmark configurations.
...
Overview
Content Tools