 N O T I C E
MSPbots WIKI is moving to a new home at support.mspbots.ai![]() to give you the best experience in browsing our Knowledge Base resources and addressing your concerns. Click here
to give you the best experience in browsing our Knowledge Base resources and addressing your concerns. Click here![]() for more info!
for more info!
Page History
MSPbots offers a reporting feature that enables you to generate reports for sharing with important members teammates and leaders of your organization. These reports are designed to facilitate data-driven decision-making and aid in monitoring your company or team's performance against key metrics. This page provides guidance on creating a report guides you in creating and configuring it reports to deliver relevant information to specific individuals based on a predefined schedule.
What's on this page:
| Table of Contents |
|---|
What are the benefits of using reports?
...
Reports are important tools for leaders when communicating critical Leaders rely on reports to communicate important information to clients and among their teams. With the The MSPbots app , allows you can to create and send reports that contain summaries of summarize historical data, metrics, and trends useful in that can be used for decision-making, problem diagnosis, capacity planning, and overall performance improvement. You can share these reports externally with clients or internally within with teams via scheduled reporting a link or manual PDF generationformat following a reporting schedule.
Relevant applications and permissions
...
You can set up dashboards for all MSPbots apps, BI packages, and applicable integrations. Only users with admin permissions can create dashboards and reports. If you don't have enough permissions, contact your administrator for help. `
How to create a report
...
Do the following to set up your report:
- Open the MSPbots app as administrator.
- Navigate to Dashboards on the menu and click the New Dashboard button.

- In the Dashboard window, select Report.


- When the Add New Dashboard window opens, do the following:
- Enter your dashboard's name in the Name field.
- Click the Role dropdown menu and select the roles that will have access to the dashboard.
- Click the Tag dropdown menu and select one or multiple tags to label your new dashboard.
- Next, provide a Description for your dashboard.
- Click Continue. This opens the tab for your new dashboard.


- When the tab for your new report opens, click Add Widget. This opens the Add Widget window.


- Next, on the Add Widget window, click Widgets List and select the widgets to show in your report.

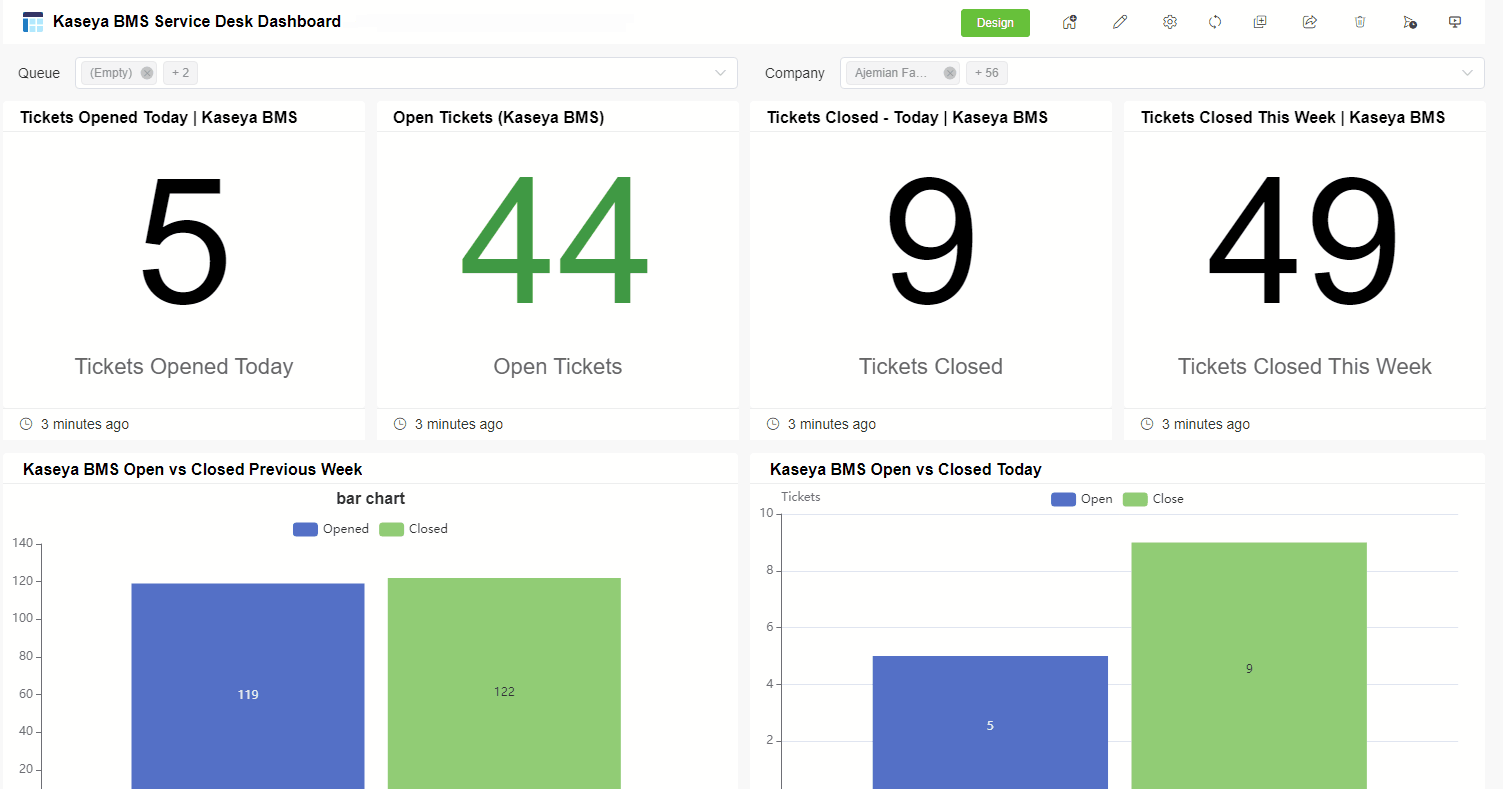
*The assets in the image are for demonstration only.
You can also click New to create new widgets to add to your report or click Slicer List to add slicers. - Click the Add Selected button when you're done with selecting widgets and slicers for your report. The selected widgets will now appear on in the new report you have just created.
- Optional: If needed, modify your report's size and orientation. Click the Size dropdown menu to select A4 or letter, and click the Orientation dropdown menu to select portrait or landscape.


- Click the Save Dashboard to save the settings.


The new report you have just created will now appear under My Dashboards.

What
...
other actions can I
...
do on my report's page?
...
- Adjust the settings - Click the Design button to modify the widget settings and to adjust the report's size, and orientation.
- Edit the report's basic information when you click
 .
. - Refresh the data on your report - Click
 to refresh all widgets. Hovering over the refresh icon for two seconds will open the auto-refresh settings.

Info title Widget Auto-refresh Rule The following rules apply once the auto-refresh feature is enabled and the refresh interval is set:
- If the current time when you open the dashboard dashboard is equal to or later than the last refresh time plus the auto-refresh interval, then the page will refresh automatically. A new countdown will start from the current time.
Example: The last refresh time is 9:00 and the auto-refresh interval is set to 5 minutes.
If you access the dashboard at 9:08, it will automatically refresh once and start a new auto-refresh timer at 9:08. - If you open the dashboard before the the last refresh time plus the auto-refresh interval, the dashboard will not refresh. It will refresh automatically when the set interval is reached.
Example: The last refresh time is 9:00 and the auto-refresh interval is set to 5 minutes.
Using the same example, the dashboard will not refresh if you access it at 9:02, which is earlier than 9:00 and the set refresh at 5 minutes. If you stay on the page until 9:05, the dashboard will automatically refresh at 9:05. However, if you leave the page before 9:05, the last refresh time will remain at 9:00. - The dashboard will follow the set auto-refresh interval while it is open, and the automatic page refresh will stop when the dashboard is closed.
- If the current time when you open the dashboard dashboard is equal to or later than the last refresh time plus the auto-refresh interval, then the page will refresh automatically. A new countdown will start from the current time.
- Share your report - Click
 to share the report via shareable link, snapshot, and embedding.

For more information on sharing your report; refer to the following pages: - Delete your report by clicking
 .
. - Create a schedule for sending your report. Click the Schedule Report
 icon for this. Refer to the section on How to Create a Scheduled Report for guided instructions.
 - Export a PDF copy of your report. - Click
 to export the report in PDF format.
...
You can configure reports to send according to a predefined schedule. Follow these steps:
...
Navigate to Dashboards on the menu and open the report that needs to be configured for a new schedule.
...
Click ![]() the Schedule Report icon to access the Schedule Report page.
the Schedule Report icon to access the Schedule Report page. 
...
| Info |
|---|
Existing scheduled reports are found in the Scheduled tab like the example in the image below. |

...
| Info |
|---|
The default Delivery option is to send via email. There is no support for other options or customization at this time. |
...
Go to the Email recipient(s) dropdown menu and select the emails of the individuals you want to send the report to. You can select multiple email addresses.
...
- If needed, customize the time zone according to different locations and preferences worldwide.
- Select Advanced Scheduler for more configuration options on your report's frequency.
...
Include PDF Attachment - Select this option to send your report in PDF format. This is the default selection.
- Include Shareable link - Select this option to automatically add the {{report_link}} token which will attach your dashboard's link to the email. The placeholder {{report_link}} represents the actual dashboard link.

...
| Info | ||
|---|---|---|
| ||
|

- When it displays Your dashboard was exported successfully, it means that the PDF file has been exported successfully and will be automatically downloaded. You can check the downloaded file in Downloads of your browser.
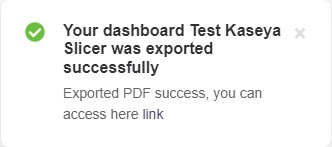
Tip If the report contains a slicer with the QueryParams="Company", the exported PDF file name includes the company name obtained from the slicer with QueryParams="Company". For example, if a report has a Company slicer=mspbots, then the exported PDF file name will include the company name mspbots.

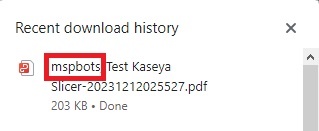
If the report does not contain a slicer with the QueryParams="Company", the exported PDF file name does not display the company name.
- When it displays Your dashboard was exported successfully, it means that the PDF file has been exported successfully and will be automatically downloaded. You can check the downloaded file in Downloads of your browser.
- Send a
...
- Report Name
- Last Sent Timestamp
- Frequency
- Next Scheduled Time
- Recipients
- Saved Slicer(s)

...
- Edit - Click Edit to modify the information of the scheduled report. Once you're done, click Save.
- Send Now - Click Send Now to immediately send the scheduled report email to the recipients.
- Send To Me - Click Send To Me to send the scheduled report to your email. You can use this option to preview the report before sending it to clients or teams.
- Delete - You can delete the scheduled report by clicking Delete and confirming when prompted.

Other options:
...
Send carbon copies or blind carbon copies of your report to individuals by clicking the CC or BCC links. You can also select multiple email addresses from these dropdown lists.
...
- filtered dashboard for the associated company of each recipient
...
- .
- This option only appears when there
...
- is a slicer with QueryParams="Company" in the
...
- dashboard.
- If you
...
- select this option, scheduled reports will be sent with filters
...
- according to the recipients' mapped company.
...
- For this
...
- , you need to configure the PSA
...
- by selecting an option from the PSA dropdown menu. The available options
...
- are Autotask, ConnectWise, Kaseya, Syncro, and Halo.
...
- Save Slicer
...
- . This option only appears when
...
- the dashboard
...
- has a slicer, excluding the
...
- Company
...
- slicer .
...

The
...
- Save Slicer option is
...
- ON by default. When
...
- this optio is
...
- ON, the current slicer selection
...
- is saved and applied to the scheduled reports.
The slicers displayed
...
- in your dashboard are set during dashboard creation. If you need to modify the slicers,
...
- go to the
...
- dashboard
...
- and click Design > Add Widget to add or delete slicers.
- View logs. Click
...
- the Log tab to view the record of the sent schedule reports
...
- , including the following information.
- Status
- Report Name
- Sent Timestamp
- Recipients
- Saved Slicer(s)
...

Related Topics
Content by Label showLabels false max 5 showSpace false excludeCurrent true cql label in ("reports","dashboards")
Overview
Content Tools