...
Simplesat Dashboards Sample View
 Image Removed
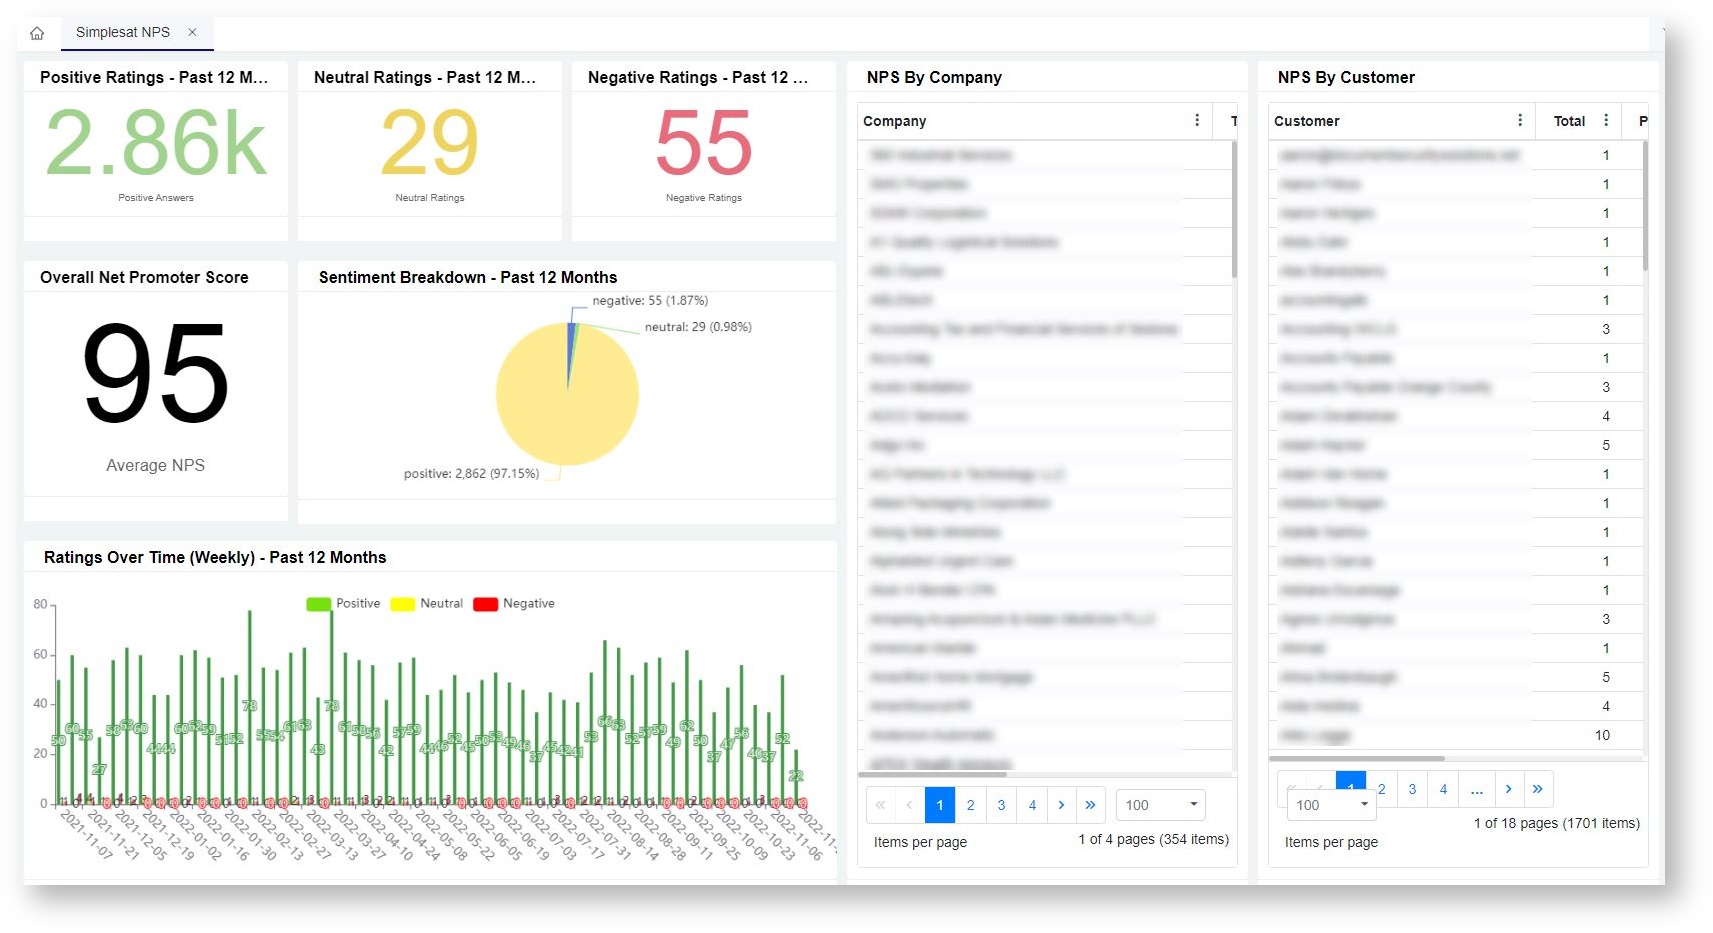 Image Added
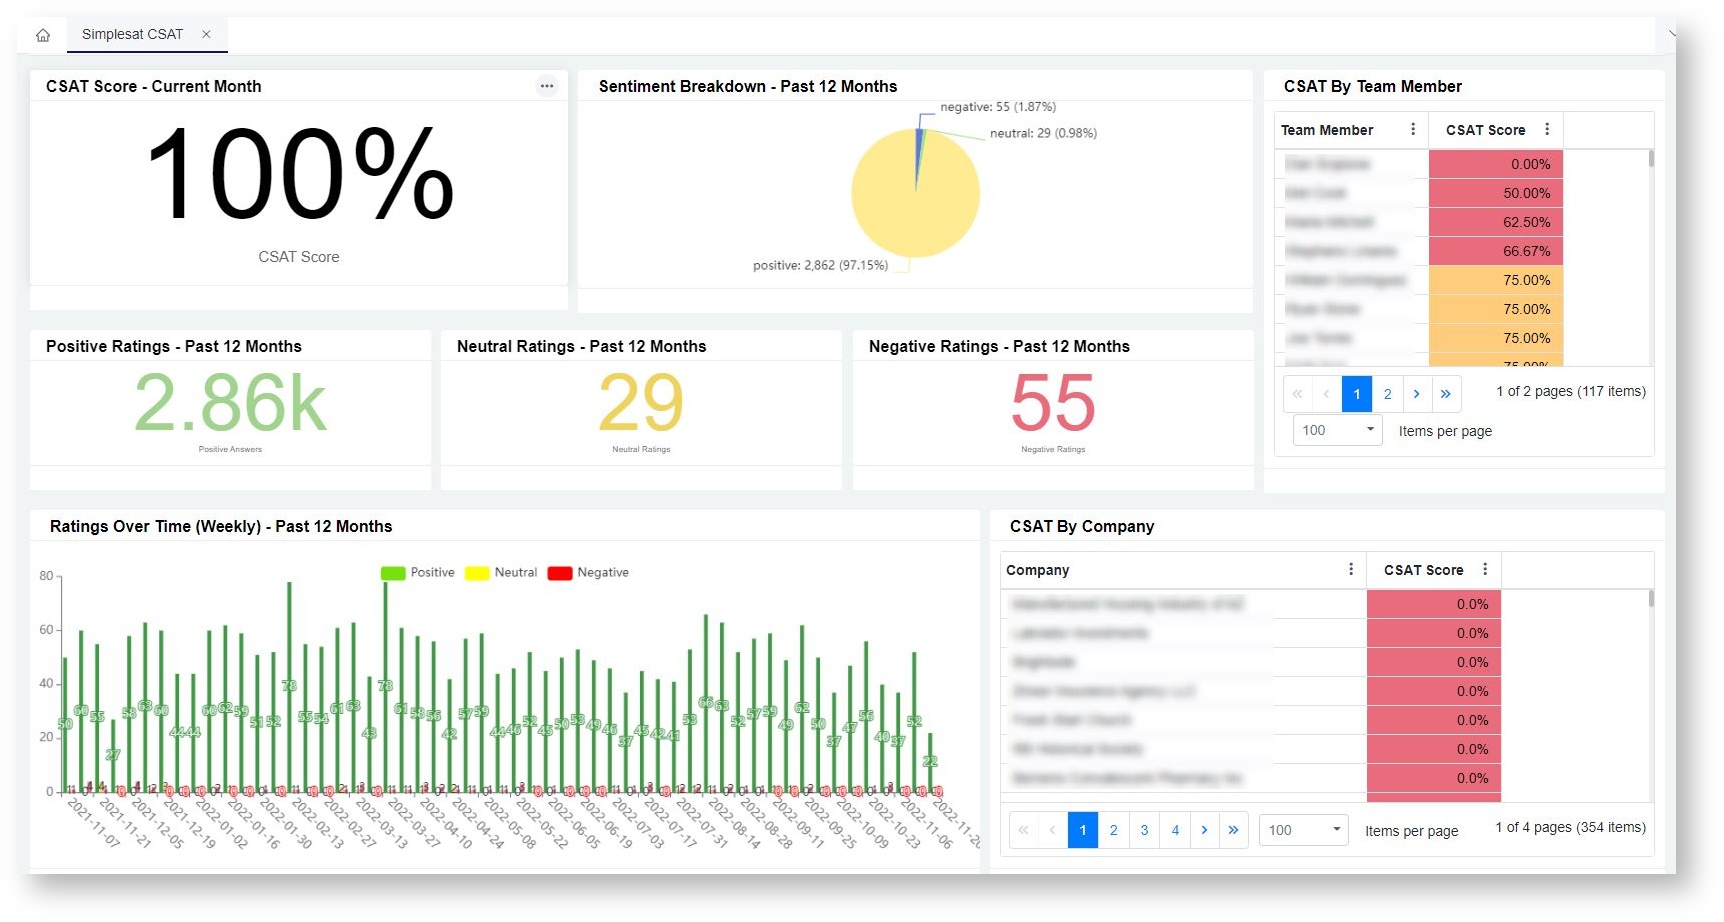 Image Added
 Image Removed
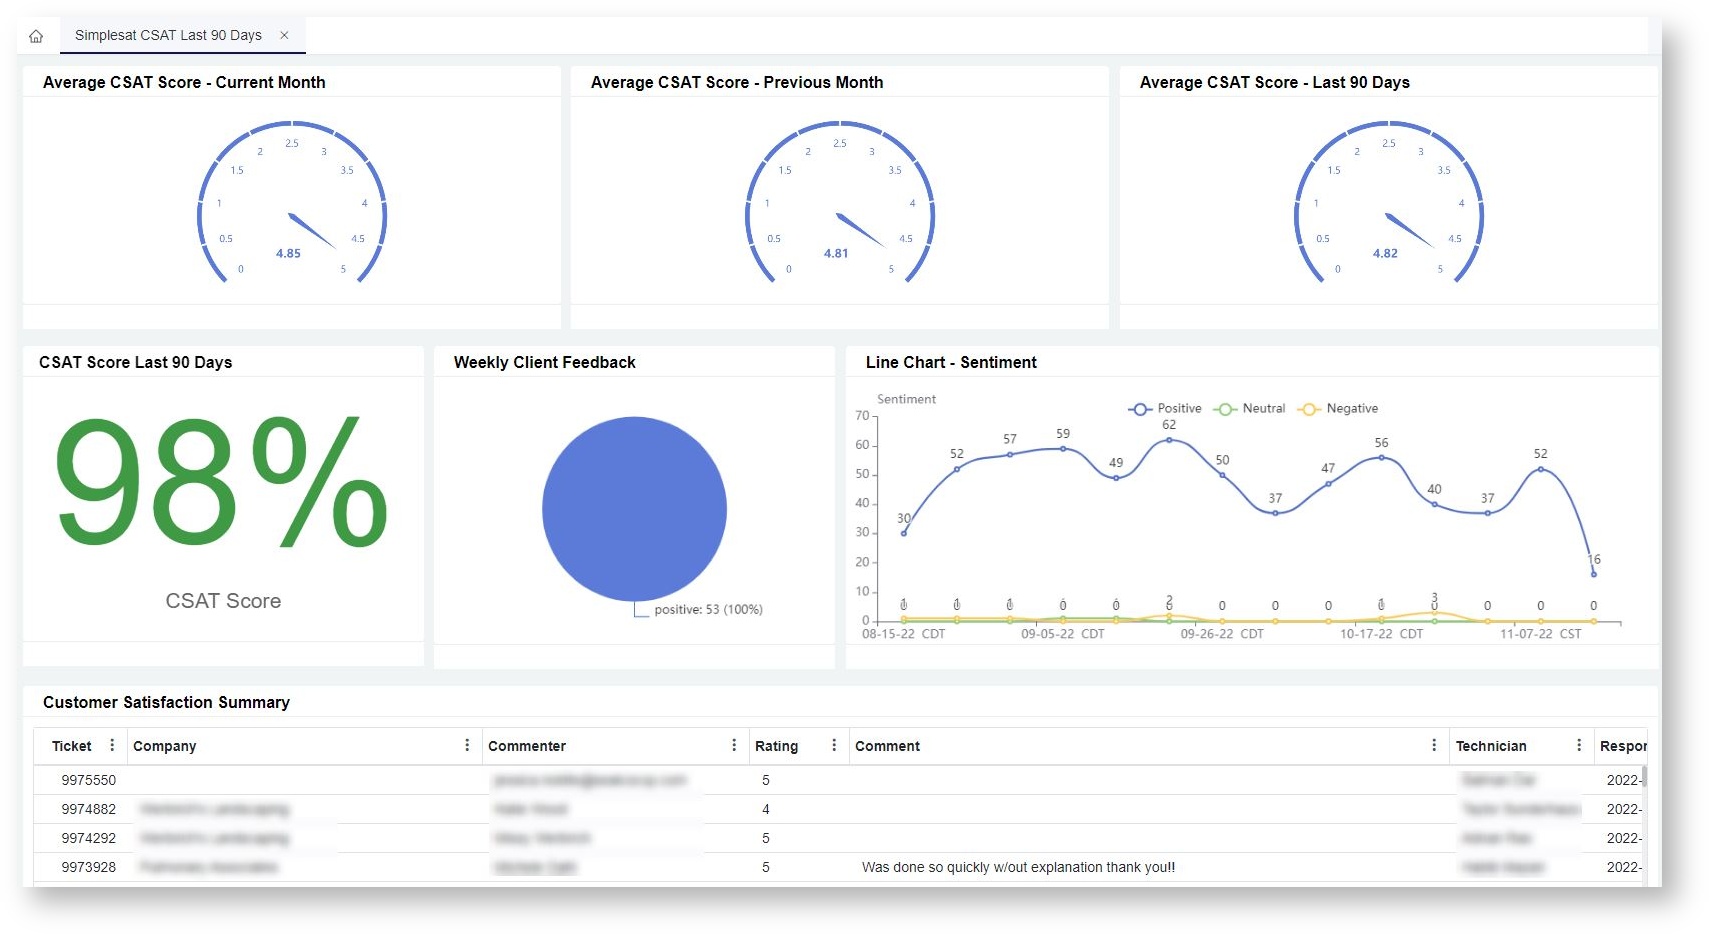 Image Added
Dashboard Information
Dashboard Name | Description |
|---|
| Simplesat CSAT | A dashboard showing the overall CSAT score and its breakdown per team member, per company, per sentiment, and over time. |
| Simplesat NPS | A dashboard showing the overall NPS score and its breakdown per team member, per company, per sentiment, and over time. |
| Simplesat CSAT Last 90 Days | A dashboard showing CSAT metrics for different time ranges: current week, current month, previous month, and last 90 days. |
Widgets Information
| Widget Name | Type | Description | Link Dashboard |
|---|
| CSAT Score - Current Month | Card Number | A card number displaying the CSAT score in % | Simplesat CSAT |
| Positive Ratings - Past 12 Months | Card Number | A card number displaying the total number of positive ratings |
| Neutral Ratings - Past 12 Months | Card Number | A card number displaying the total number of neutral ratings |
| Negative Ratings - Past 12 Months | Card Number | A card number displaying the total number of negative ratings |
| Sentiment Breakdown - Past 12 Months | Pie Chart | A pie chart showing % of positive, neutral, and negative ratings |
| Ratings Over Time (Weekly) - Past 12 Months | Column Chart | A bar chart showing levels of each sentiment across previous weeks |
| CSAT by Team Member | Grid | A table showing CSAT scores per team member in ascending order |
| CSAT by Company | Grid | A table showing CSAT scores per company in ascending order |
| Feedback Stream - Full | Grid | A table showing complete information |
of | on each feedback received |
NPS | Overall Net Promoter Score | Card Number | A card number displaying the NPS score | Simplesat NPS |
| Positive Ratings - Past 12 Months | Card Number | A card number displaying the total number of positive ratings |
| Neutral Ratings - Past 12 Months | Card Number | A card number displaying the total number of neutral ratings |
| Negative Ratings - Past 12 Months | Card Number | A card number displaying the total number of negative ratings |
| Sentiment Breakdown - Past 12 Months | Pie Chart | A pie chart showing % of positive, neutral, and negative ratings |
| Ratings Over Time (Weekly) - Past 12 Months | Column Chart | A bar chart showing levels of each sentiment across previous weeks |
| NPS by Company | Grid | A table showing NPS scores per company in ascending order |
| NPS by Customer | Grid | A table showing NPS scores per customer in ascending order |
| Feedback Stream - Full | Grid | A table showing complete information |
of | on each feedback received |
| Average CSAT Score - Current Month | Progress Tracker | A progress tracker displaying the average CSAT score in the current month | Simplesat CSAT Last 90 Days |
| Average CSAT Score - Previous Month | Progress Tracker | A progress tracker displaying the average CSAT score from the previous month |
| Average CSAT |
Temp - Current Month| Score - Last 90 Days | Progress Tracker | A progress tracker displaying the average CSAT score |
in current with conditional formattingAverage Temperature - Past Progress Tracker| Card Number | A progress tracker displaying the average CSAT score |
in the last 90 days with conditional formatting| for the previous month |
| Line Chart - Sentiment | Line Chart | A progress tracker displaying the average CSAT score for the last 90 days |
| CSAT Score Last 90 Days | Card Number | A card number displaying the CSAT score for the last 90 days in % |
Sentiment Line Chart | Line Chart | A line chart showing levels of each sentiment across previous weeks |
| Customer Satisfaction Summary | Grid | A table showing complete information |
of ratings | rating from customers |
| Weekly Client Feedback | Pie Chart | A pie chart showing % of positive and negative feedback for the week |
...
Purchasing the Simplesat
...
BI Package
- Navigate Log in to Apps on the MSPbots app menu.
- Scroll down the page and click + Add From Marketplace.
 Image Removed
- Go to the Apps section and select Simplesat Dashboards Package from the list.
 Image Removed
 When the Simplesat Dashboards Package window opens, click the Add button to install the package.
 Image Removed
Viewing the Simplesat Dashboards
- MSPbots and go to MarketPlace.
- On the Marketplace tab, click the BI Packages tab.
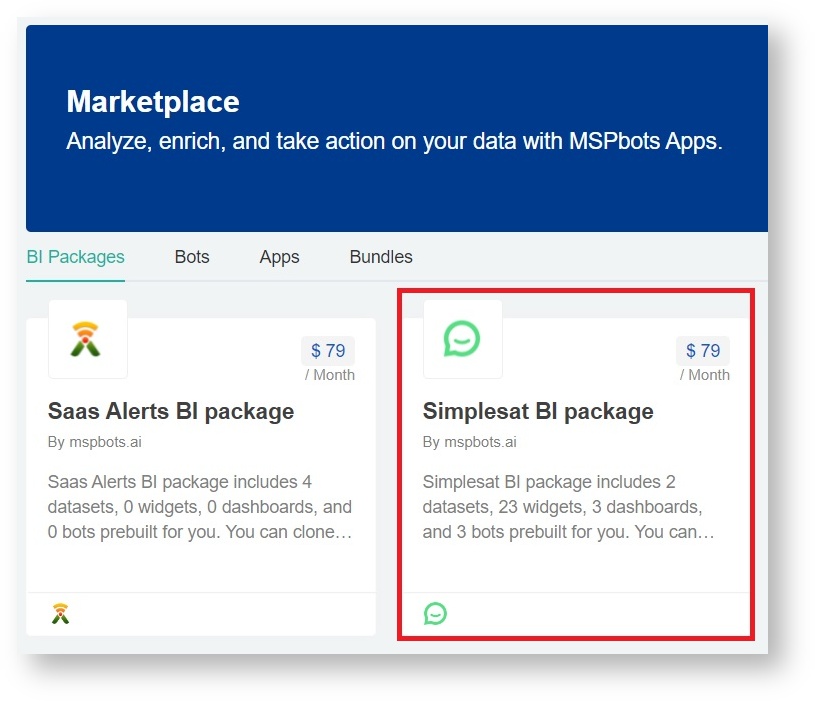 Image Added
 - Locate the Simplesat BI package package and click it. This action will take you to the Purchase window.
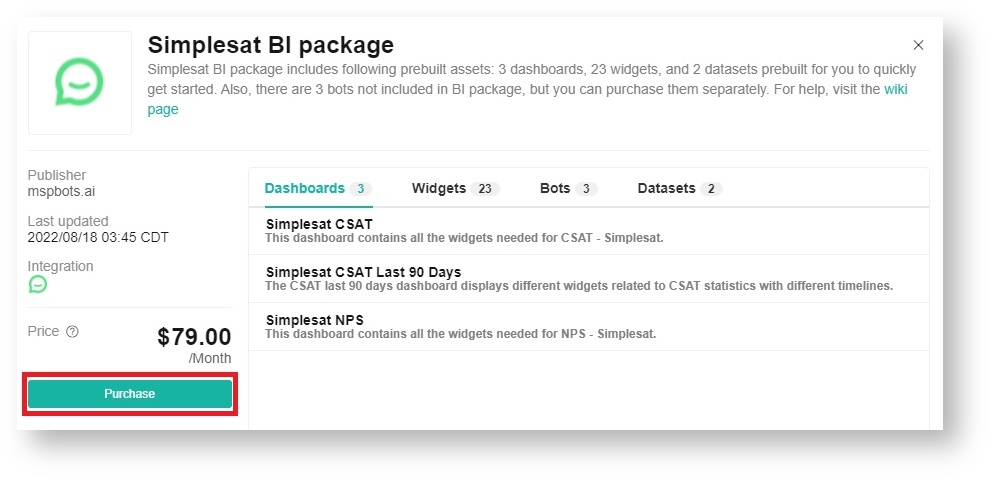 Image Added
 - Read the inclusions in the package and click Purchase when ready.
- Next, select the type of purchase plan. Then, click the Purchase button.
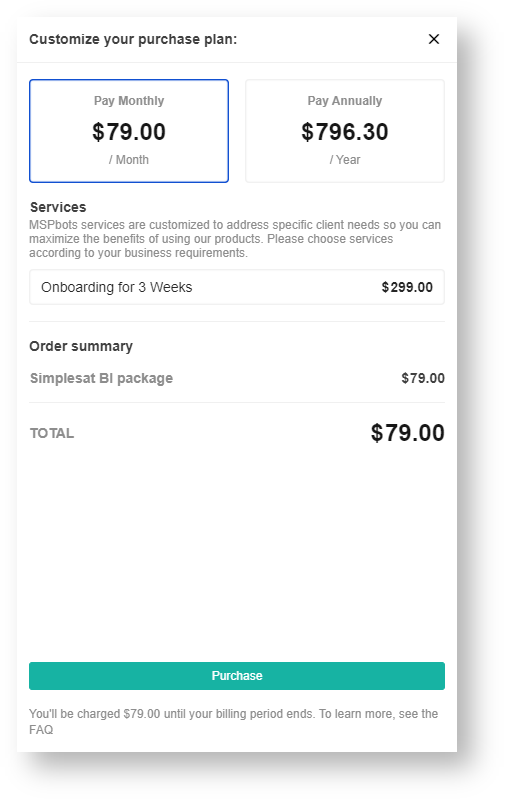 Image Added
 - Input your Credit Card details and click Save.
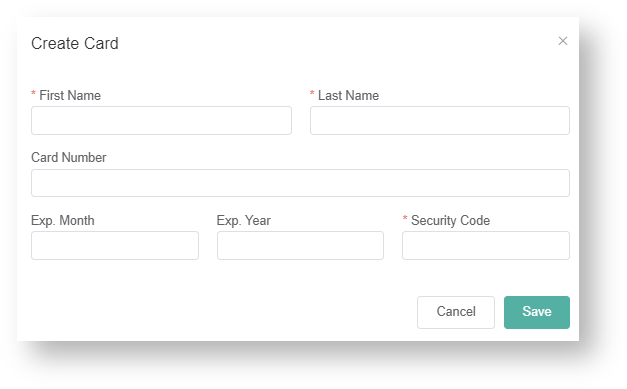 Image Added
 - Proceed to complete your order.
Accessing the Simplesat BI Packages
The steps below are done after purchasing the Simplesat BI Package.
- Log in to MSPbots and go to the Apps page.
- Locate the Simplesat BI Package then click it to open.
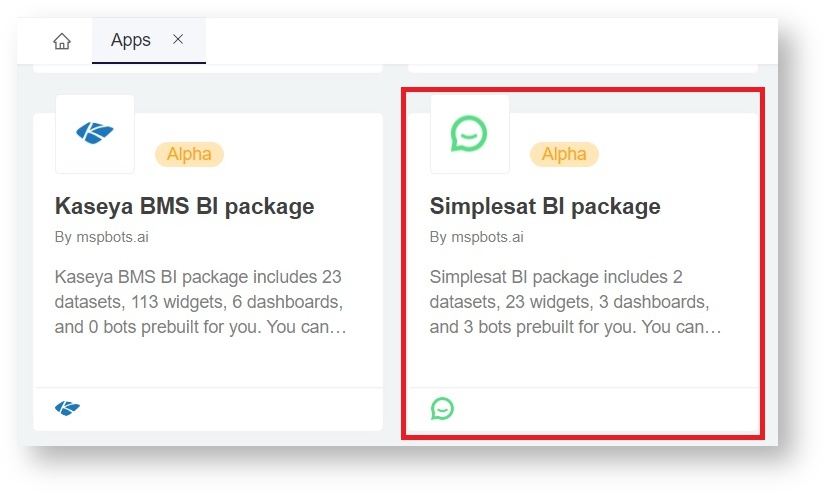 Image Added
 - On the Dashboards tab, select the dashboard, widget, dataset, or bot that you want to view.
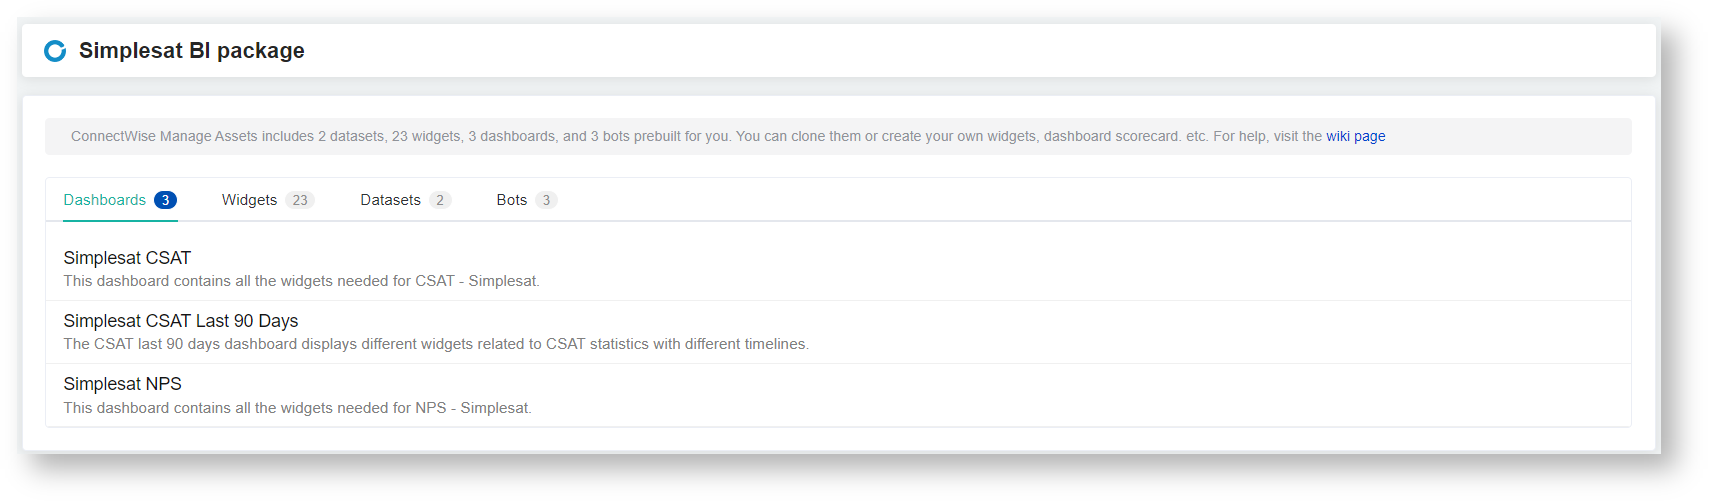 Image Added
 - Navigate to Apps on the MSPbots Apps page.
- Click on Simplesat Dashboards Package.
 Image Removed
 - Go to Dashboards on the upper right corner of the screen and hover over it. View a dashboard by selecting it from the drop-down menu.
 Image Removed
 N O T I C E