The Datto RMM Dashboard Package provides a clean and efficient way to monitor machines in a network. This dashboard package features the Alerts Dashboard, where alerts like Open Alerts and Alerts Resolved are viewed, and the Machine Monitoring Dashboard, where machine statuses like Servers Offline and Machines Requiring Reboot are found. It also allows technicians to fix problematic machines and audit sites promptly.
Read this article for a walkthrough of the Datto Dashboard Package and information on the following topics:
Sample Views of the Datto RMM Dashboards
Machine Monitoring Dashboard
 Image Added
Alerts Dashboard
 Image Added
Dashboard Information
Dashboard Name | Description |
|---|
Introduction
Datto Dashboards view
 Image Removed
  Image Removed
Dashboard Name | Description | What problem does it solve? | Target User/s? | Why should the target user care about this/ why is it cool to use? |
|---|
| Machine Monitoring | This dashboard template for Datto RMM |
contains a listing of | lists all the machines in your AEM account |
with | , including the corresponding status |
as well as | and alerts needed to monitor |
your | machines. |
| Alerts | This dashboard displays different gauges that |
shows | show different Alert statistics. |
Widgets Information
Widget | Widget Name | Widget Type | Description | Link Dashboard |
|---|
What problem does it solve? | Target User/s | Why should the target user care about this/ why is it cool to use? | | Servers Offline - Datto | Card Number | Server Offline - Datto shows the count of server machines that are offline or |
Service Offline | Card Number | A card number widget showing the count of machines classified as servers that are not online nor | suspended. | Machine Monitoring |
| Machines Requiring Reboot | Card Number |
A card number showing | The Machines Requiring Reboot widget shows the count of machines that are |
not online require | requires a reboot. |
| Machines Without Recent Audits | Card Number |
A card number widget showing | The Machines Without Recent Audits widget shows the count of unsuspended machines that have no audit earlier than 7 days ago. |
| Out of contact |
MachinesThis is a | The Out of contact machines widget shows the count of devices |
with | last seen earlier than 7 days ago. |
| Open Alerts | Card Number |
This is a | Open Alerts shows the count of open alerts in AEM that |
aren't | are not muted. |
| Suspended Machines | Card Number |
This is a card number widget that lists down | The Suspended Machines widget lists the total number of suspended machines. |
| Top 25 Installed applications | Grid |
A column widget showing | The Top 25 Installed Applications shows the count of installed applications limited to the top 25, not including the CentraStage agent. |
| Open Alerts | Card Number |
This is a | Open Alerts shows the count of open alerts in AEM that |
aren't | are not muted. | Alerts |
| Alerts Over 5 Hours Old |
This is a | Card number | Alerts Over 5 Hours Old shows the count of open, not muted alerts over 5 hours old. |
| Devices With Active Alerts | Card number | The Devices |
with | With Active Alerts widget counts the distinct devices with open, not muted alerts. |
| Average Age Open Alerts | Card number | Average Age Open Alerts show the average hours open for open, not muted alerts. |
| Muted Alerts | Card number | The Muted Alerts widget counts the open, muted alerts in AEM. |
| Alerts Resolved Today |
Open Alerts by Site| Card number | Alerts Resolved Today counts the alerts resolved today in AEM. |
| Count of Alerts by Device Category | Bar |
This is a | Count of Alerts by Device Category shows the count of open, not muted alerts that are categorized by the device. |
| Open Alerts By Site | Bar | Open Alerts By Site shows the counts of open alerts (not muted) split out by |
device category| site. |
| Opened vs Closed Alerts Last 30 Days | Bar |
This | The Opened vs Closed Alerts Last 30 Days widget is a count of alerts opened and a count of alerts resolved by day in the last 30 days. |
How to install the Datto Dashboards Package
...
1. Navigate to the MSPBots Apps page
2. Click + Add From Marketplace
 Image Removed
3. Select "Datto Dashboards Package" on the list. Then, click "Add" button.
- Go to MarketPlace on the MSPbots app's menu.
- Click BI Packages.
 Image Added
 - Select Datto RMM package. This opens the Datto RMM purchase window.
 Image Added
 - Next, click the Purchase button.
 Image Added
- Proceed to customize your purchase plan by selecting Pay Monthy or Pay Annually. Then, click Purchase.
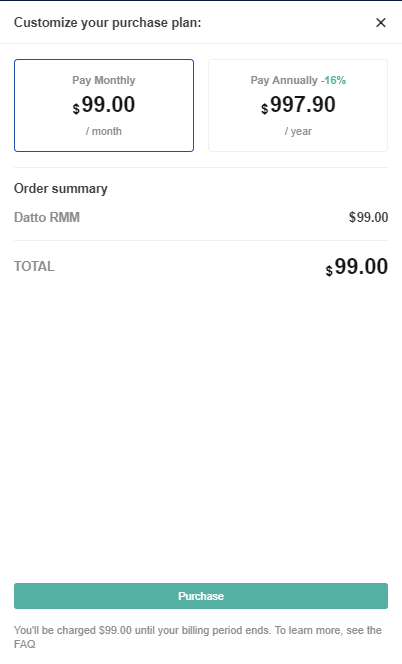 Image Added
How to view the Datto Dashboards
...
...
- Navigate to
...
- Appson the MSPbots app's menu.
- Click
...
- Datto RMM dashboards package.
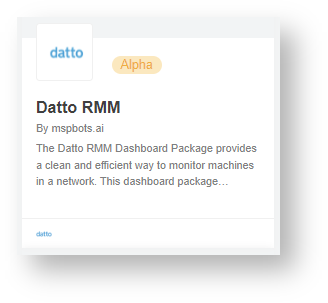 Image Added
 - Hover
...
- over the
...
- Dashboards drop-down menu
...
- then, select either Machine monitoring or Alerts.
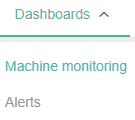 Image Added
Click and select to view the specific Dashboard.
 N O T I C E