The Auvik Dashboards Package gives a quick overview of all the networks, notes, interfaces, firewall information, devices, and audits that you manage. It has indicators that provide information on problematic devices and trigger alerts for immediate action-taking.
Read this article for a walkthrough of the Auvik Dashboard Package and information on the following topics:
...
Auvik Dashboards Sample
...
Views
 Image Removed
 Image Added
  Image Removed
 Image Removed
  Image Removed
 Image Added
 Image Added
  Image Added
 Image Added
 Image Added
 Image Removed
Dashboard Information
| Dashboard Name | Description |
|---|
What problem does it solve? | Target User/s?Why should the target users care about this/ why is it cool to use? | dashboards dashboard contains indicators for the operational status |
for Networkof Networks, Devices, Firewalls |
and Interfaces- Difficulty in identifying the types of devices and their operational status within the network.
- For network security, need to monitor if there are firewalls that are offline.
| Network Engineers, Technicians | It provides a clean and efficient way of tracking machines and servers status, and Interfaces. |
| Auvik - Alerts | This dashboard contains widgets that hold information about the Alerts |
histories | history in the Auvik integration |
No means of identifying a specific devices that has frequent and critical alerts Need to know what are the unresolved alerts in order to work on them.Network Engineers, Technicians | Real time view on the number of Critical Alerts in order to provide quick response. Provides a graph display of the trend alerts per month. | | Devices | This dashboard contains widgets that contain |
detials | details regarding devices information from the Auvik integration |
- Need to know all the device information for quick support response.
| Network Engineers, Technicians | Provides device detailed information, types and totals. | dashboards | dashboard containing the widgets information regarding the interfaces stored in |
Auvik integration - Need to know all the network interfaces details and their operational status.
| Network Engineers, Technicians | Provides the list of all associated interfaces with the parent device information, types and totals. | | the Auvik integration. |
| Auvik - Networks | This dashboard contains an inventory of networks and related info discovered by the Auvik collectors |
- No information on the network name and types.
- As a network technician, I want to capture all the IPs and the type of network connection they are in.
| Network Engineers, Technicians | . |
| Auvik - Entity Audits | A dashboard with a widget that contains data for the Entity Audits dataset. |
| Auvik - Entity Notes | A dashboard containing widgets that display data regarding Entity Notes |
Provides the list of networks, its types and totalsWidgets Information
| Widgets Name | Type | Description |
|---|
Dashboard | What problem does it solve? | Target User/s | Why should the target user care about this/ why is it cool to use?| Link Dashboard |
|---|
| Scan Status by Network Type | Pie chart | This pie chart shows the scan status by network type. | Auvik Summary |
No information on the status for each network type.
Network Engineers, Technicians |
| Total No. of Firewalls Offline | Card number | This shows the count of firewall and router |
device | devices with an offline status |
.No information on servers that are offline. | Network Engineers, Technicians | Quick count on the servers that are offline means easy monitoring And by clicking the widget, you can see the drill through details on the specific firewall affected. |
| Interfaces by Op Status | Pie chart | This widget contains the percentage of each |
Interface | interface by operational status |
No indicator on the associated interfaces on each device and its operational statusNetwork Engineers, Technicians | Indicates the how |
| Offline Devices by Type | Pie chart | This displays the offline devices by device type |
No information on the offline devices by type | Network Engineers, Technicians | | . |
| Offline Device - Details | Grid | A widget showing all the |
list | lists of firewall and router |
device status No information on the offline device details | Network Engineers, Technicians | Alerts Per Devices - Current Week | Grid | | status. |
| # of Alerts - Today | Card number | This card number |
This grid | widget displays the number of |
total and critical alerts week| day. | Auvik-Alerts |
| # Critical Alerts - Today | Card number | This card number widget displays the total number of critical alerts detected today. |
# of Unresolved Alerts |
Need to have report for the number of alerts per devices on the current week | Network Engineers, Technicians | Today | Card number | This card number widget displays the total number of unresolved alerts in the current day. |
# of Alerts - Last 24 hours | Card number | This card number widget displays the number of alerts detected in the last 24 hours. |
| # |
No. | of Critical Alerts - Last 24 Hours | Card number | This |
a No. of unresolved | widget shows the count of devices with critical alerts within 24 hours, including both resolved and unresolved. |
No real time information on the number of critical alerts | Network Engineers, Technicians | Allows | | # of Unresolved Alerts - Current Week | Card number | This |
is a | widget shows the count of unresolved alerts for the week. |
|
| Alerts Per Devices - Current Week | Grid | This grid widget displays |
No information on unresolved alerts of the weekNetwork Engineers, Technicians | | total alerts and critical alerts for each device during the current week. |
# |
No. of Alerts - Current Week | Card number | This is a count of all Alerts |
for the week.No information of the number of alerts count Network Engineers, Technicians Per | per Month | Line chart | This is a line chart |
about | that shows the trends based on the total Alerts per month. |
Need to have a report to identify the trends of alerts per month | Network Engineers, Technicians | Network Engineers, Technicians| Total Devices | Card number | This displays the total count of distinct devices. |
Devices | Need to know the total number of devices | | Auvik - Devices |
| Device Details | Grid | A grid widget displaying the list of devices with their specific |
Model Software Serials and StatusNeed to know the detail information of all devices. | Network Engineers, Technicians | | , and status. |
| Offline Device by |
Offline Device By | Type | Grid | This shows the total number of offline devices |
that are offline .Need to know the detail information of all offline devices | | . |
| Offline Printers | Card number | A card number widget displaying the total number of offline printers. |
| Offline Servers | Card number | A card number widget displaying the total number of offline servers. |
| Offline Workstations | Card number | A card number widget displaying the total number of offline workstations. |
Network Engineers, Technicians Number show of | of all device interfaces and their types |
either and Network Engineers, TechniciansInterfaces | Need to know the total number of all device interfaces. | | Auvik - Interfaces |
| Interfaces | Grid |
A | This is a grid widget for all the device interfaces and |
its Need to know the details of all associated interfaces and their parent device | Network Engineers, Technicians | | . |
| Interfaces by Op Status | Pie | A pie chart that shows the percentage |
by operational status type for | of all the device interfaces |
.Need to know the percentage operational status for all the device interfaces | Network Engineers, Technicians| according to operational status type. |
| Total Networks | Card |
Number card number | widget displays all the total distinct networks in the Auvik network information. | Auvik - Networks |
Need to know the total number of networks | Network Engineers, Technicians | | Networks | Grid | This grid widget displays all the existing network and their details |
.Need to know the detail information of all Network typesNetwork Engineers, Technicians | | Scan Status by Network Type | Pie | This bar chart shows the scan status by network type. |
Need to know the percentage breakdown of all network types. | Network Engineers, Technicians | ...
|
| Networks Updated This Week | Card number | This card number widget displays the total number of networks updated in the current week. |
| Total Entity Audits | Card number | This card number widget displays the total number of entity audits. | Auvik - Entity Audits |
| Entity Audits By Week | Column Graph | This bar graph widget displays data for the entity audits grouped by week. |
| Entity Audits This Week | Grid | This grid widget displays the entity audits that started in the current week. |
| Entity Audits Last Week | Grid | This grid widget displays the entity audits that started in the previous week. |
| Total Entity Notes | Card number | A card number widget that displays all the entity notes. | Auvik - Entity Notes |
| Entity Notes By Editor | Pie chart | A pie chart widget displaying the entity notes grouped by the editors. |
| Entity Notes | Grid | This grid widget displays the entity names, the title, and when and who last modified it. |
Installing the Auvik Dashboards Package
To install the Auvik Dashboards Package
...
1. Navigate to your MSPBots Apps page
2. Click + Add From Marketplace
 Image Removed
3. Select "Auvik Dashboards Package" on the list. Then, click "Add" button.
 Image Removed
How to view the Auvik Dashboards?
1. Navigate to your MSPBots Apps page
2. Click "Auvik Dashboards Package"
 Image Removed
3. Hover into the "Dashboard" drop-down menu. Then, Click and select to view the specific Dashboard.
:
- Log in to the MSPBots apps and go to MarketPlace.
- On the MarketPlace tab, click the BI Packages link.
 Image Added
 - Search for the Auvik package and click it. This opens the Auvik purchase page.
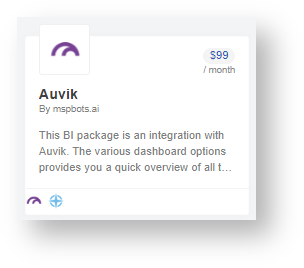 Image Added
 - Read through the dashboards, widgets, and datasets that are bundled with an Auvik Dashboards package. Then click Purchase when ready to buy.
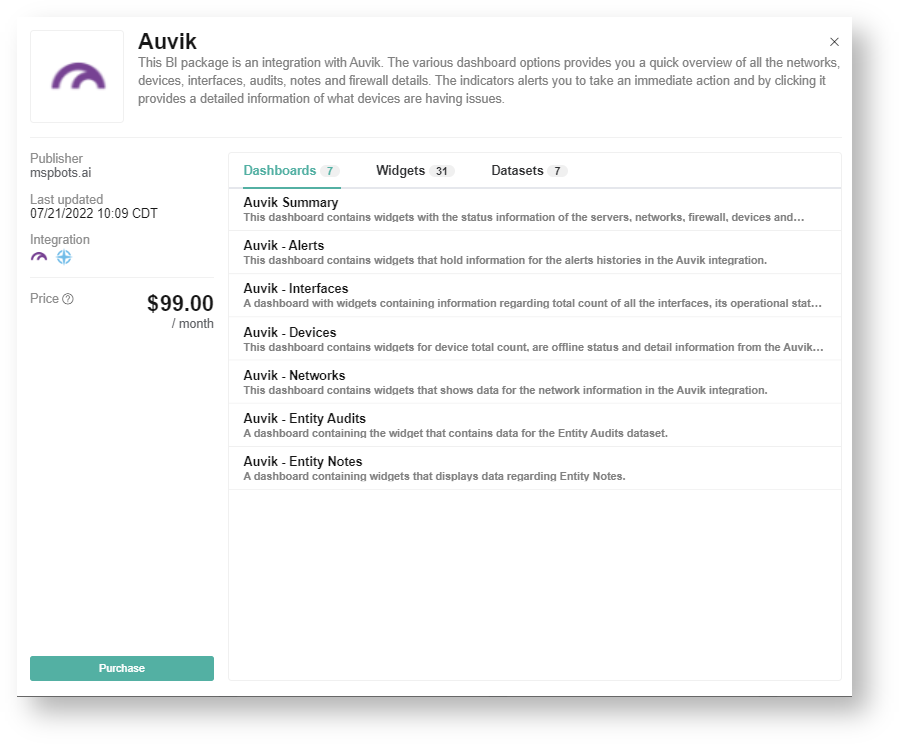 Image Added
 - Next, select your customized plan. Once the selection is done, click Purchase.
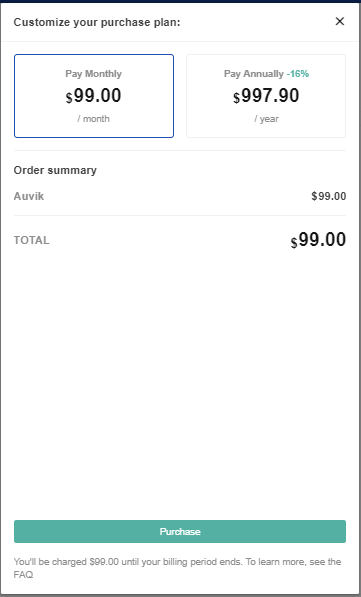 Image Added
Viewing the Auvik Dashboards
- Navigate to Apps on the MSPBots menu.
- Click the Auvik dashboards package.
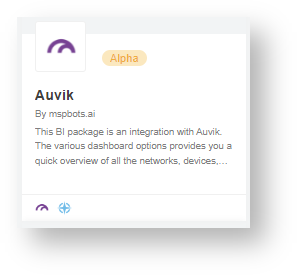 Image Added
 - Hover over Dashboards to show a drop-down list, then select the dashboard that you want to view.
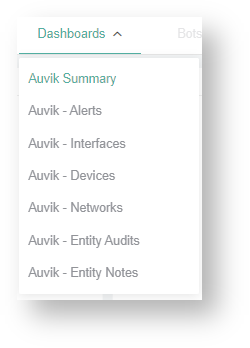 Image Added
...
 N O T I C E