 N O T I C E
MSPbots WIKI is moving to a new home at support.mspbots.ai![]() to give you the best experience in browsing our Knowledge Base resources and addressing your concerns. Click here
to give you the best experience in browsing our Knowledge Base resources and addressing your concerns. Click here![]() for more info!
for more info!
Page History
MSPBots The MSPbots Usage Report was designed to showcase to users the MSPBots shows the performance and usage summary of MSPbots assets such as Botsbots, Widgetswidgets, etc the performance and usage summary.
Listed below are the widgets for the dashboard and corresponding descriptions;
...
and apps like the Attendance Manager.
| Table of Contents | ||
|---|---|---|
|
How to Access the MSPBots Usage Report
...
- Log in MSPbots.
- Navigate to Settings on the MSPbots app menu.
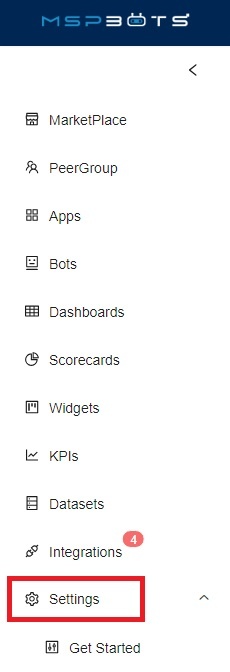
- Click MSPBots Usage Report.The following are the widgets on the MSPbots Usage Report dashboard.
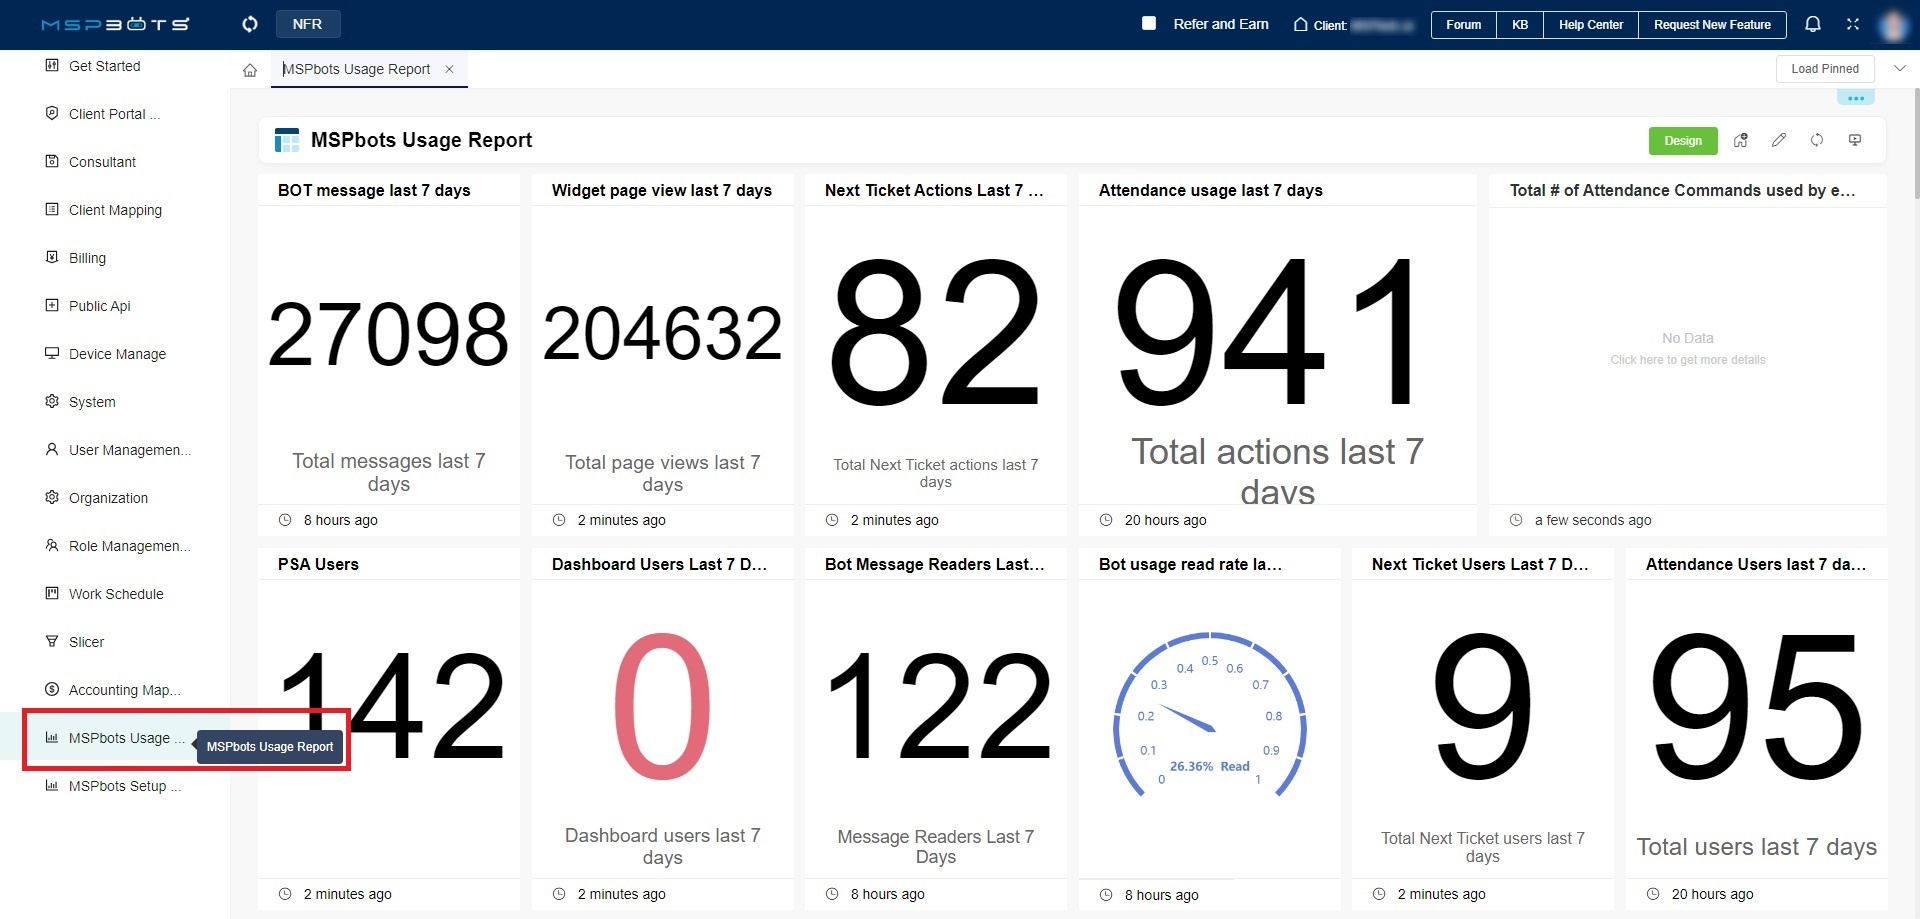
No. Widget Description 1 Bot message last 7 days Shows the total bot messages generated in the last 7 days. 2
Widget page view last 7 days
Shows the total widget page views in the last 7 days. 3
Next Ticket Actions Last 7 Days
Shows the count of Next Ticket actions in the last 7 days. 4
Attendance usage last 7 days
Shows the total attendance time entry count in the last 7 days. 5
Total # of Attendance Commands used by employee
Shows the total count of Attendance Commands used by employees.
6
PSA Users
Shows the count of PSA users, displaying the number of PSA users with the highest user count among ConnectWise, AutoTask, and Halo&Synco&Kaseya.
7
Dashboard Users Last 7 Days
Shows the count of dashboard users in the last 7 days.
8
Bot Message Readers Last 7 Days
Shows the count of users who read bot messages in the last 7 days.
9
Bot usage read rate last 7 days
...
Shows the read rate percentage for
...
bot messages
...
in the last 7 days.
...
10
Next Ticket Users Last 7 Days
Shows the count of NextTicket users in the last 7 days.
11
...
Attendance
...
Users last 7 days
...
Shows the count of Attendance users in the last 7 days.
...
12
Weekly usage users last 16 weeks
Shows the count of weekly usage users in the last 16 weeks, including weekly dashboard users, bot message readers, next ticket users, and attendance users.
13
Weekly usage last 16 weeks
Shows the weekly usage of features in the last 16 weeks, including weekly dashboards page views, bot messages, next ticket actions, attendance actions.
14
MSPbots Usage Last 7 days
Shows the total MSPbots app assets usage for the following:
- Total bot alert messages generated per user: received, read, and replied messages
...
- Total widget unique page
...
- views per user
- Last login date per user
...
15
MSPbots bots usage
...
Last 7 Days
Shows the total alert messages generated, received, and read per bot
...
including the total summary count.
...
16
Bot Usage View Grouped by Month
...
Shows the total alert messages generated, received, and read per bot per month
...
including the read rate percentage.
...
17
Client bot message by Status
...
Shows the total bot alert messages generated, received, and read per week using trend lines.
...
18
MSPbots widget usage
Shows the total page views and unique visitors per widget.
...
19
Client widget usage details
...
Shows the monthly total page views, unique visitors, and page
...
views for widgets per user
...
.
20
Client bot message by month
...
Shows the total bot messages generated per month
...
.
21
Widgets page view history
Shows the weekly total of widgets page view and widgets page view per user using trend lines.
22
Top 20 bots in read last 30 days
...
Shows the top 20 most read bots alert
...
messages for the last 30 days.
...
23
Client attendance usage
Shows the total attendance time entry count per month.
24
Top 20 widgets viewed last 30 days
...
Shows the top 20 most viewed widgets for the last 30 days.
...
25
Client attendance usage history
Shows the total
...
attendance time entry count per week.
...
Overview
Content Tools