 N O T I C E
MSPbots WIKI is moving to a new home at support.mspbots.ai![]() to give you the best experience in browsing our Knowledge Base resources and addressing your concerns. Click here
to give you the best experience in browsing our Knowledge Base resources and addressing your concerns. Click here![]() for more info!
for more info!
 N O T I C E
MSPbots WIKI is moving to a new home at support.mspbots.ai![]() to give you the best experience in browsing our Knowledge Base resources and addressing your concerns. Click here
to give you the best experience in browsing our Knowledge Base resources and addressing your concerns. Click here![]() for more info!
for more info!
The NextTicket Manager for Autotask is a dispatching tool that uses a scoring system based on predefined priority rules to help technicians and dispatchers identify the next priority ticket that needs action. This app has dashboards that display NextTicket usage data, including the count of technicians who used NextTicket and the number of tickets dispatched, updated, and rejected. It also has a rule report that shows the enabled rules. This article lists these dashboards and gives descriptions of their widgets and functionalities.
What's in this article:
How to access the NextTicket Manager for AutoTask Dashboards
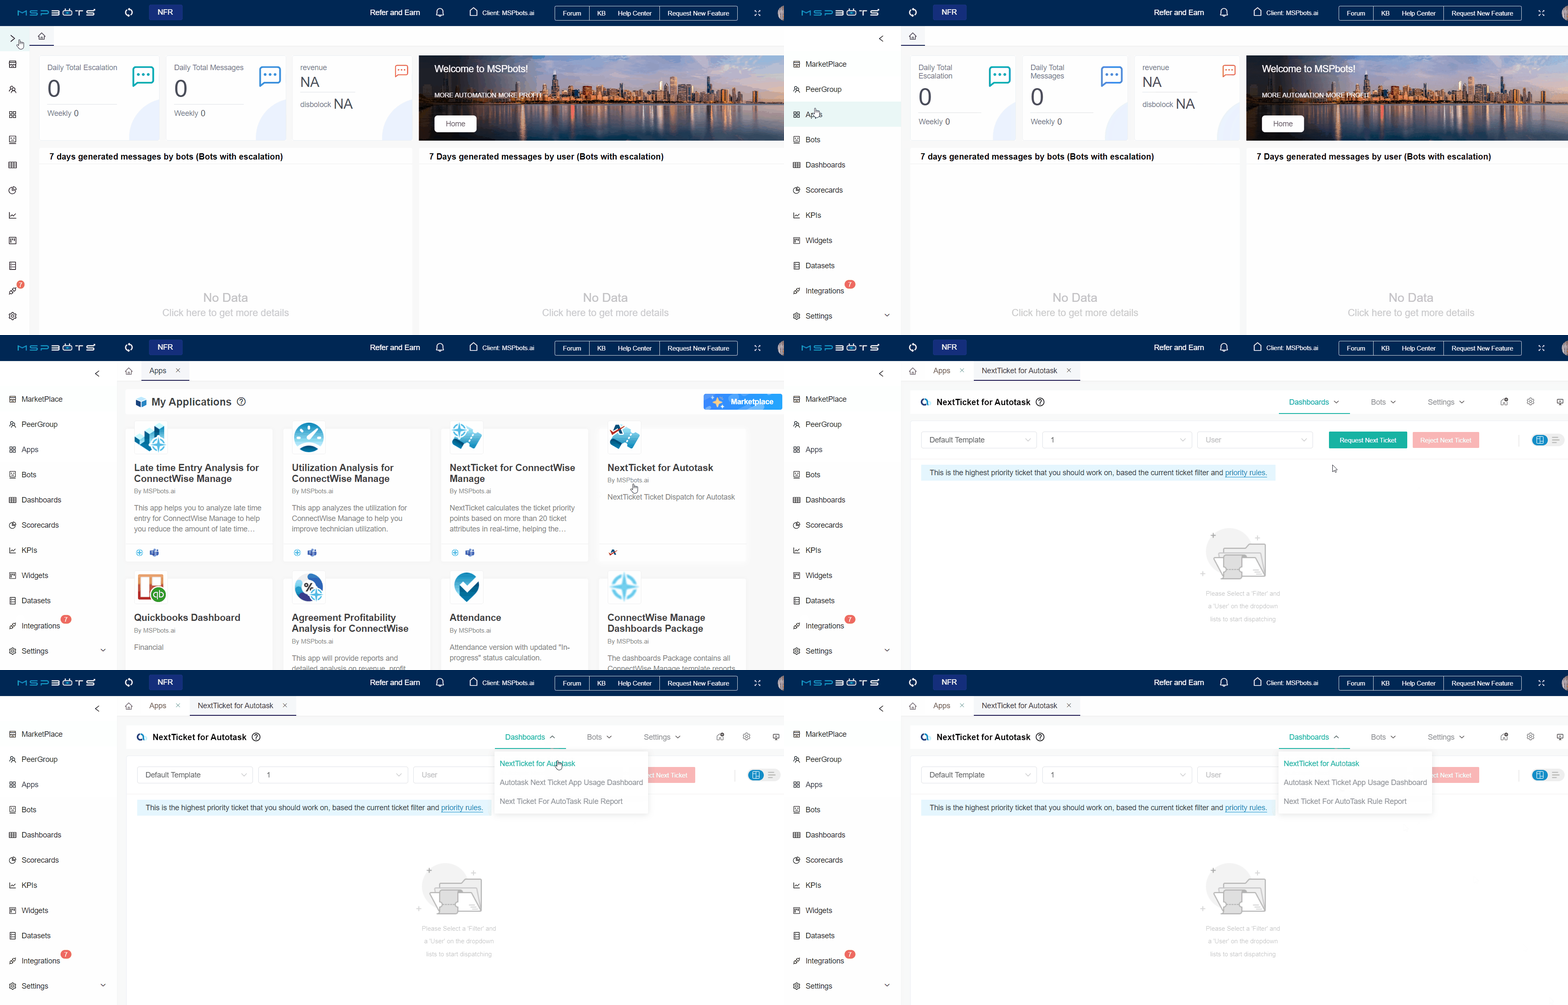
To access the dashboards, go to Apps on the MSPbots app and select NextTicket for AutoTask. Then hover over Dashboards and select the dashboard for viewing.
AutoTask NextTicket App Usage Dashboard
The Autotask Next Ticket App Usage Dashboard contains widgets that show ticket and user counts, rejected tickets summary, and NextTicket utilization over periods. Below are the dashboard widgets.
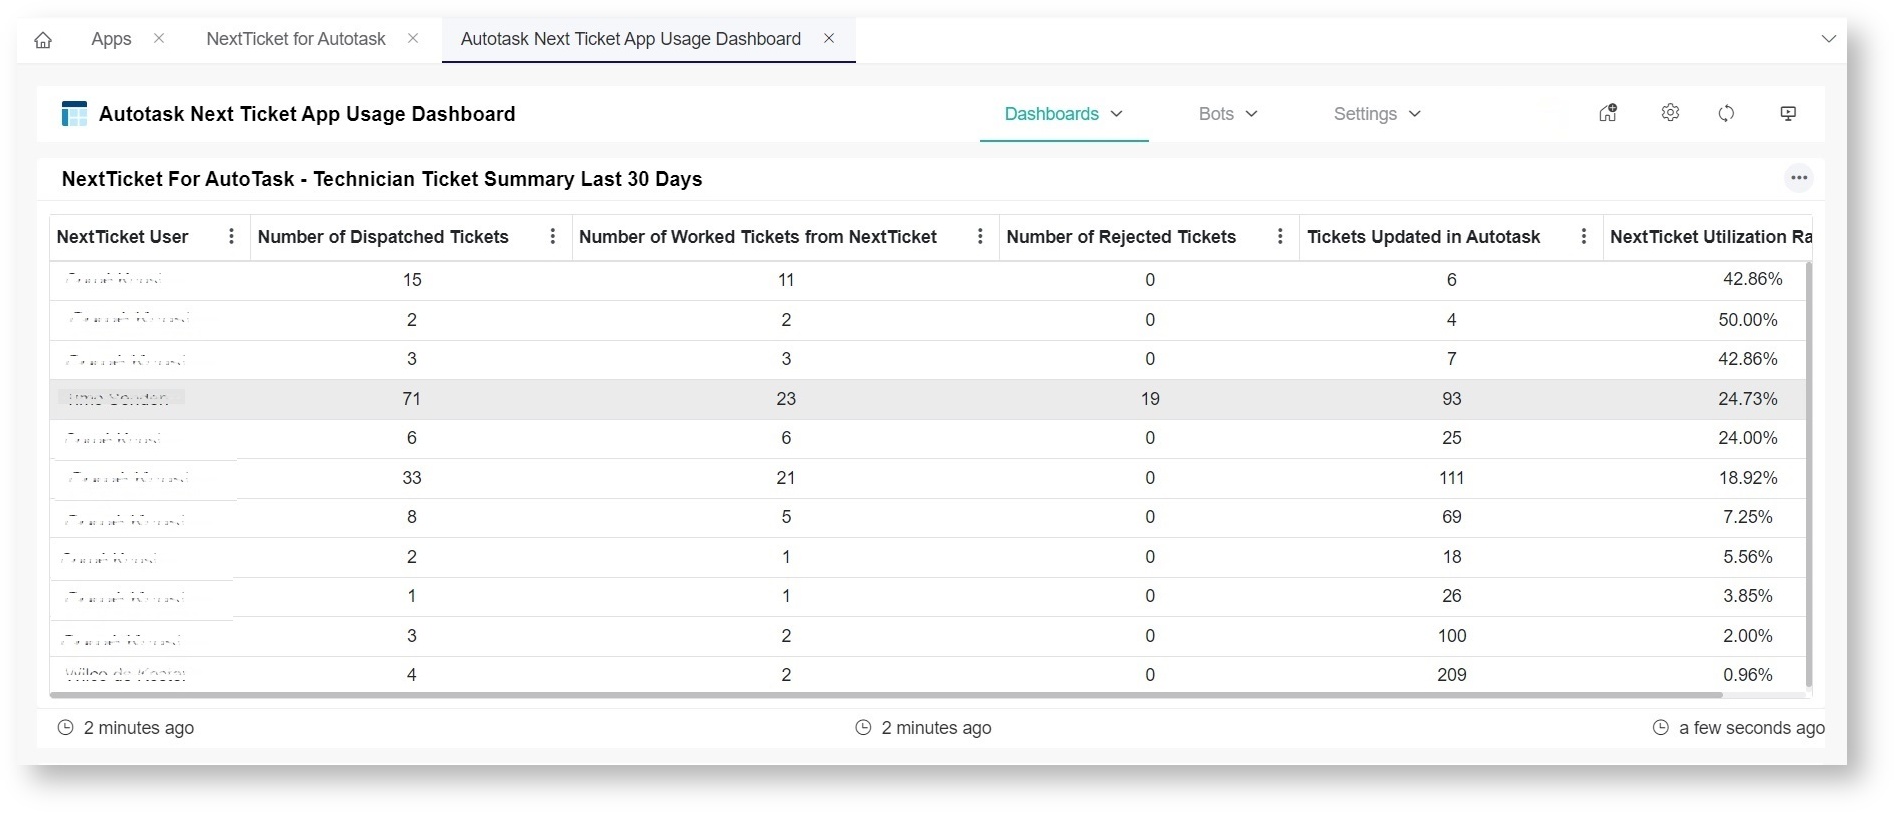
- NextTicket For AutoTask - Technician Ticket Summary Last 30 Days - This widget shows the number of tickets dispatched, worked, and rejected in the last 30 days by technicians.
These are the descriptions for the columns in this widget.Column Name Description NextTicket User This column shows the name of the user who requested the NextTicket Manager. Number of Dispatched Tickets This column shows the total number of unique tickets requested from the NextTicket Manager. Number of Worked Tickets from NextTicket This column shows the number of tickets from the client's PSA that were dispatched using the NextTicket Manager. Number of Rejected Tickets This column shows the total number of tickets rejected using the NextTicket Manager. Tickets Updated in AutoTask This column shows the number of tickets from the client's PSA that were updated in AutoTask. NextTicket Utilization Rate This column shows the utilization rate of each technician using the NextTicket Manager. The rate is calculated by dividing the number of Worked Tickets in NextTicket by the number of Tickets Updated in AutoTask. - AutoTask NextTicket App User Count Last 30 Days - This line graph widget shows the count of NextTicket users in the last 30 days.
- AutoTask NextTicket App Ticket Count Last 16 Weeks - This line graph widget shows the count of tickets distributed by the NextTicket Manager in the last 16 weeks.
- Autotask NextTicket App User Count Last 16 Weeks - This line graph widget shows the count of NextTicket users in the last 16 weeks.
- NextTicket For Autotask - Technician Using NextTicket App For The Last 7 Days - This bar chart widget shows the technicians and the count of their updated tickets dispatched by the NextTicket app for the last seven days including the current day.
- NextTicket For Autotask - NextTicket User Utilization Last 30 Days - This column chart widget shows the NextTicket user's utilization rate in the last 30 days, including the current day. This is calculated by getting the number of updated tickets dispatched using the NextTicket Manager and dividing it by the total number of updated tickets in AutoTask.
- NextTicket for Autotask - Rejected Tickets Summary Last 30 Days - This grid widget shows the rejected ticket number, ticket title, user who rejected the ticket, the reason for rejection, and reject time.
NextTicket for Autotask Rule Report
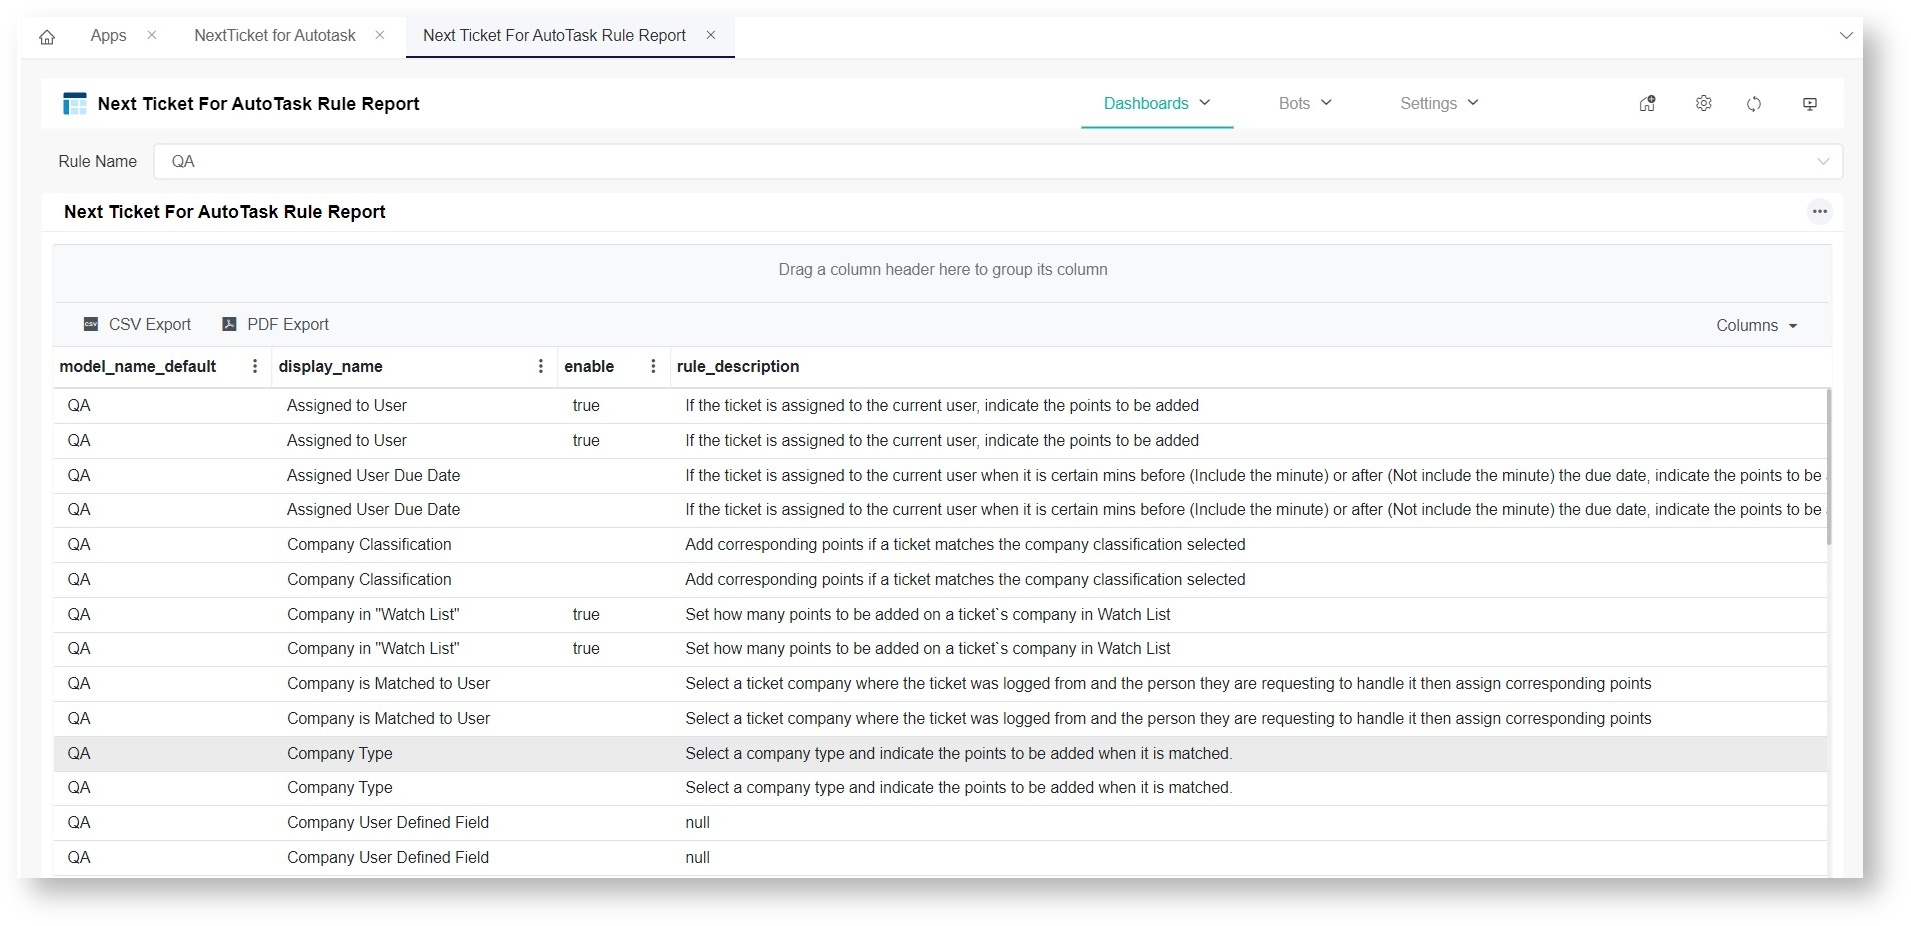
The NextTicket for Autotask Rule Report dashboard shows the priority rules and their descriptions. This dashboard has a Rule Name slicer and can be exported as a CSV or PDF file.


