 N O T I C E
MSPbots WIKI is moving to a new home at support.mspbots.ai![]() to give you the best experience in browsing our Knowledge Base resources and addressing your concerns. Click here
to give you the best experience in browsing our Knowledge Base resources and addressing your concerns. Click here![]() for more info!
for more info!
 N O T I C E
MSPbots WIKI is moving to a new home at support.mspbots.ai![]() to give you the best experience in browsing our Knowledge Base resources and addressing your concerns. Click here
to give you the best experience in browsing our Knowledge Base resources and addressing your concerns. Click here![]() for more info!
for more info!
Group captains can add key performance indicators (KPIs) for their peer groups by selecting a KPI from the KPI Templates and adding it to My KPIs. A group's KPIs and the resulting data are viewed from the Benchmark tab and can be adjusted in the KPI Settings.
What's in this article:
Adding a new KPI template to your peer group KPIs
To add a KPI:
Adding KPI template widgets is restricted to group captains only. Group members have view-only access to the benchmarks.
- Go to PeerGroup on the MSPbots app.
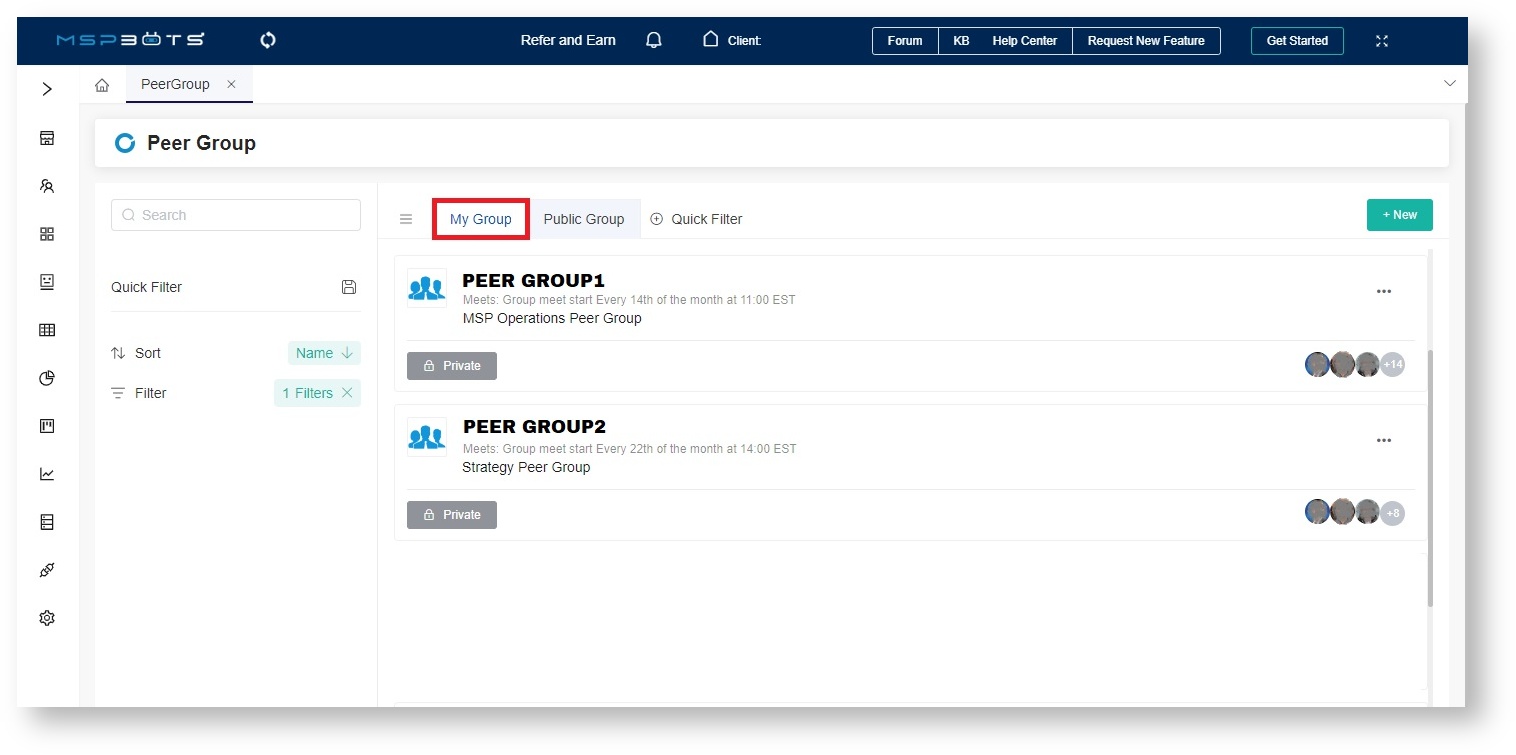
- Click My Group on the Peer Group screen and select your group.
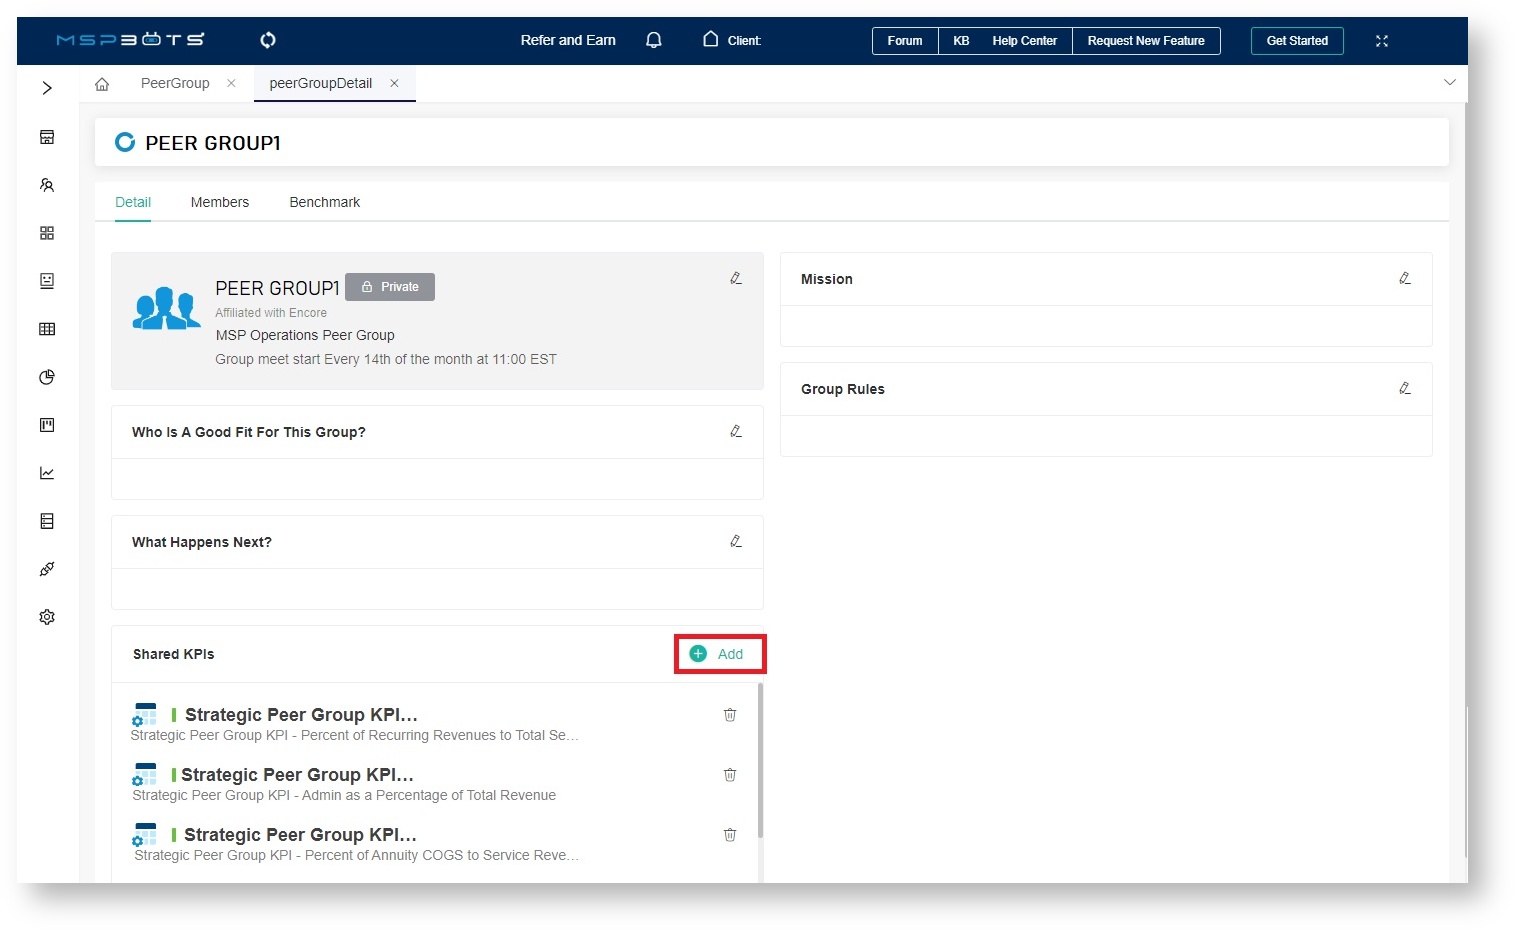
- When your peer group's screen opens, click +Add.
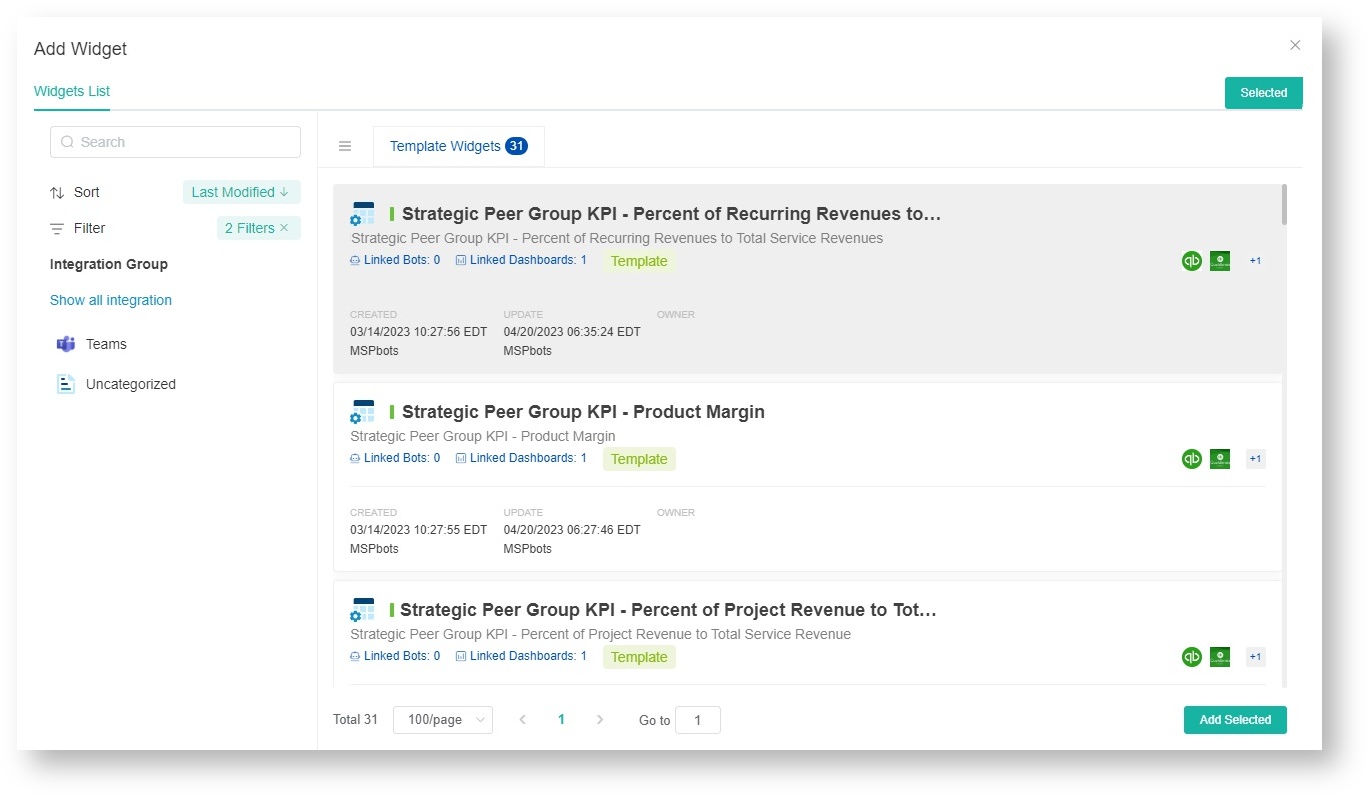
- Go through the list of Template Widgets and select the KPI widget for adding.
- Click Add Selected. The KPI is added to the group's Shared KPI list and the KPI dropdown list on the Benchmark tab.
Remember to select a KPI widget with "Peer Group" in the widget name to ensure you are adding a peer group KPI widget.
Reviewing your KPIs and adjusting KPI settings
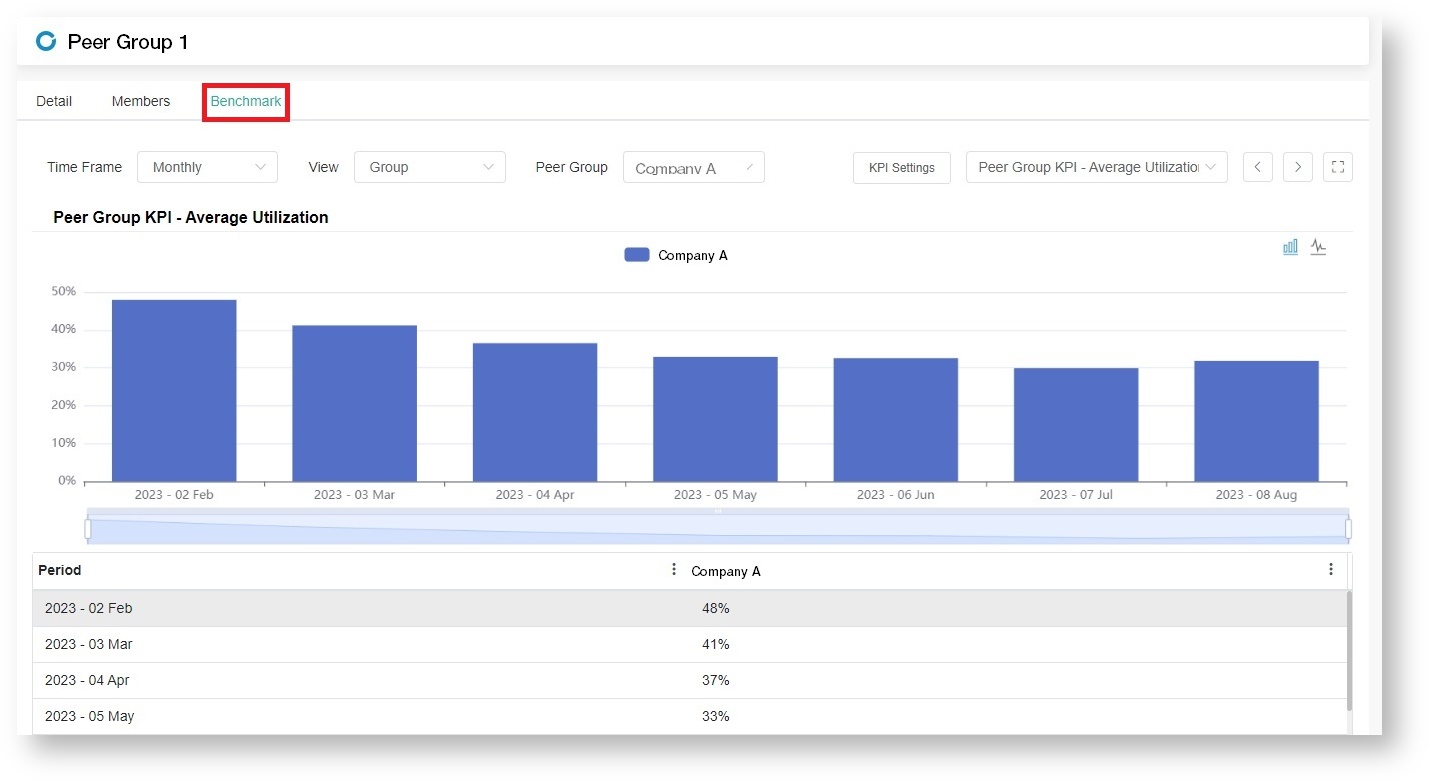
To view the KPIs, open your peer group and go to Benchmark where you compare data among your tenants or peers. Below are the features and functions in the Benchmark tab:
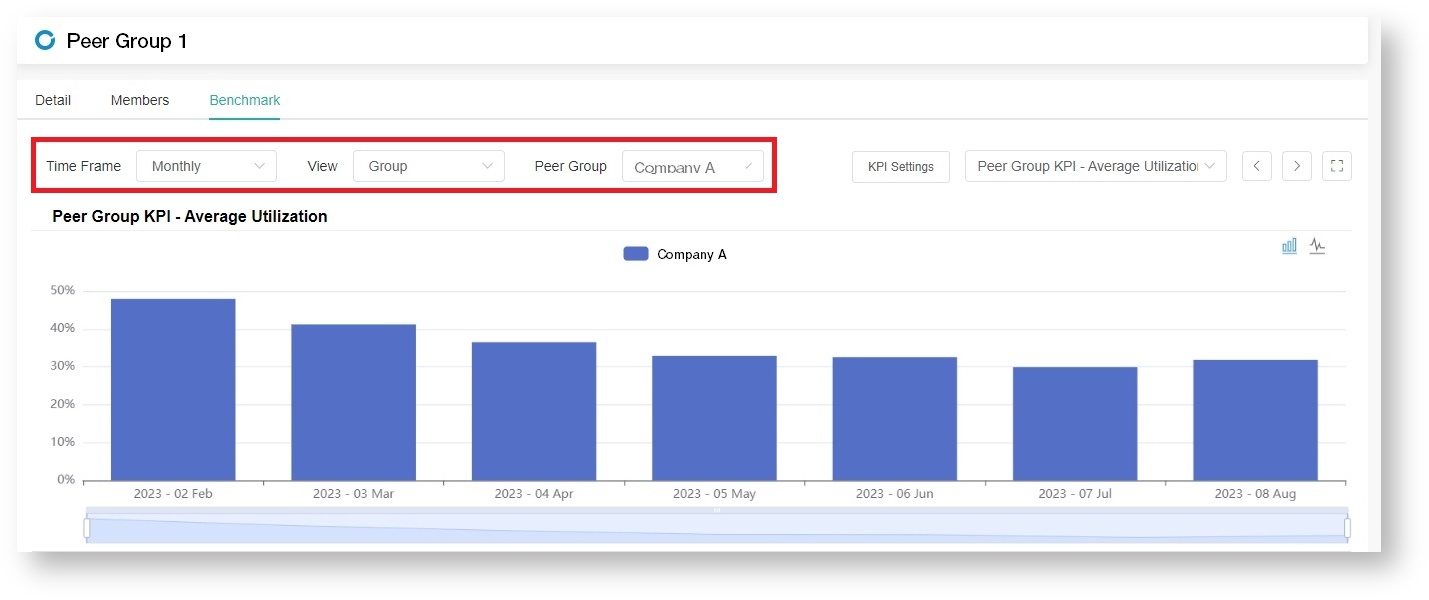
- Dashboard filters - This section displays the filters set in the widget settings. In the image below, the Time Frame filter gives the option to display data Monthy or Weekly, and the Peer Group filter displays data per company.
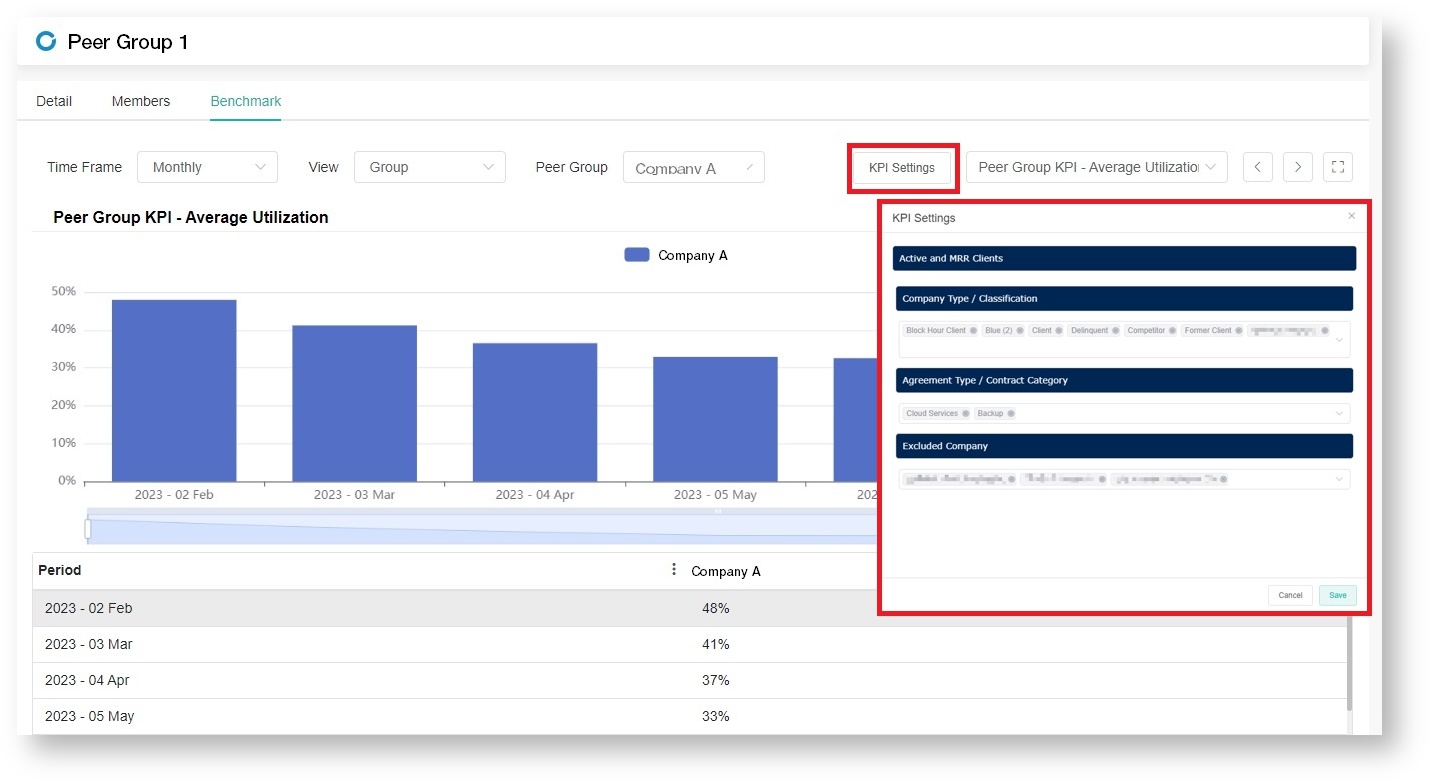
- KPI Settings - When clicked, this button opens the KPI window where you view and adjust the KPIs displayed in the widgets. These settings are applied to all Peer Groups with the same KPI widget settings but will not affect the KPI settings of other tenants.
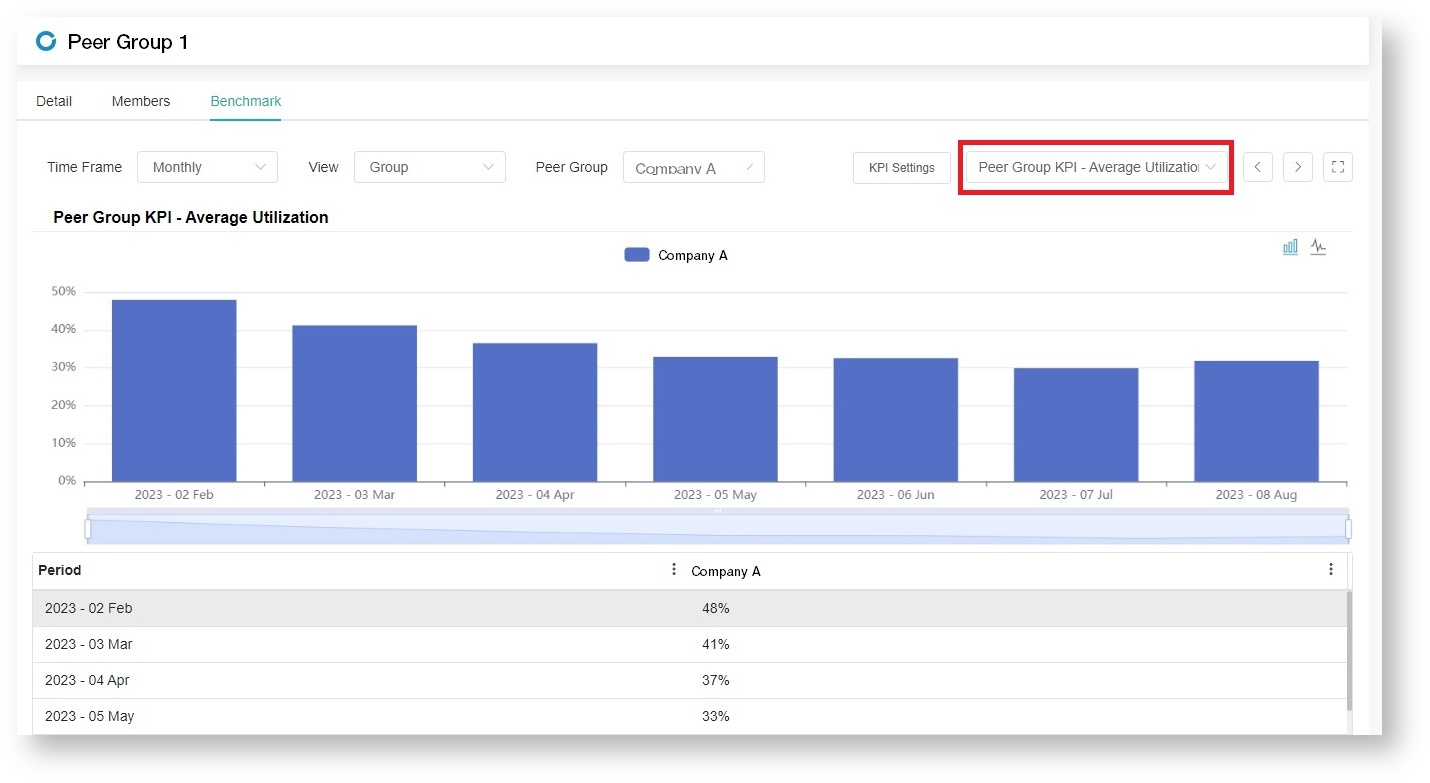
- KPI widget dropdown - Select a KPI widget from the dropdown list to view data for each KPI.
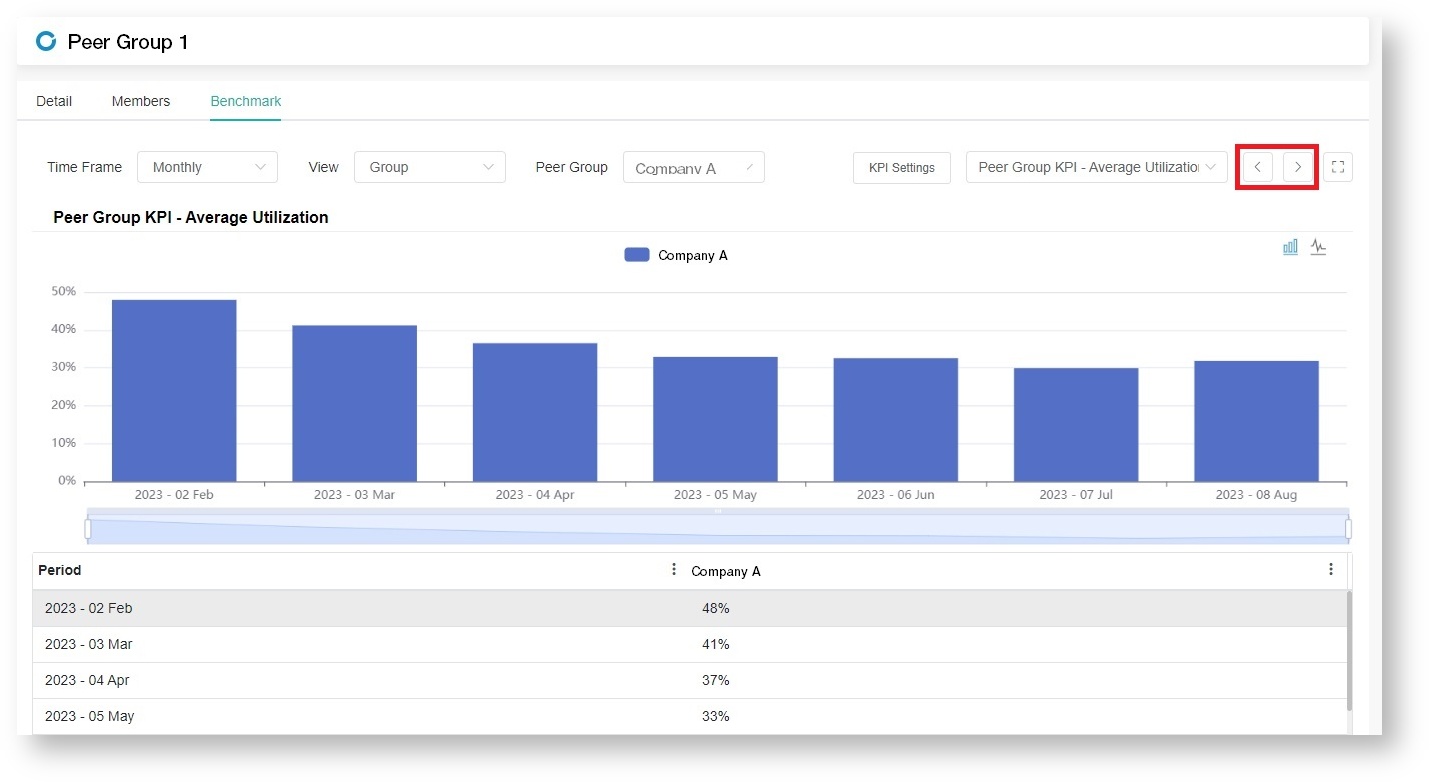
- KPI Widget switcher - Click these buttons to switch your view from left to right, from one KPI to the next.
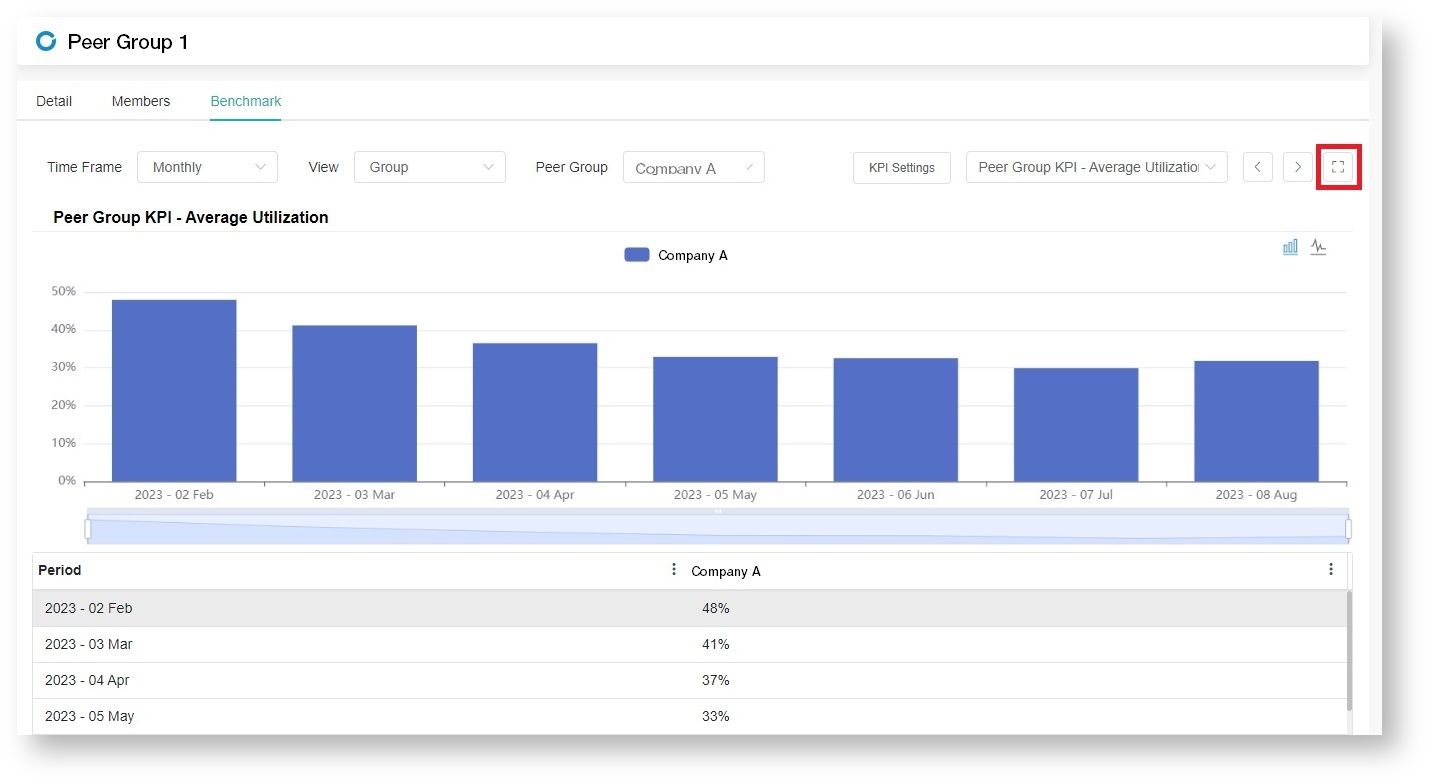
- Full-Screen viewer - Select the full-screen button to view the KPI widgets in full-screen mode.
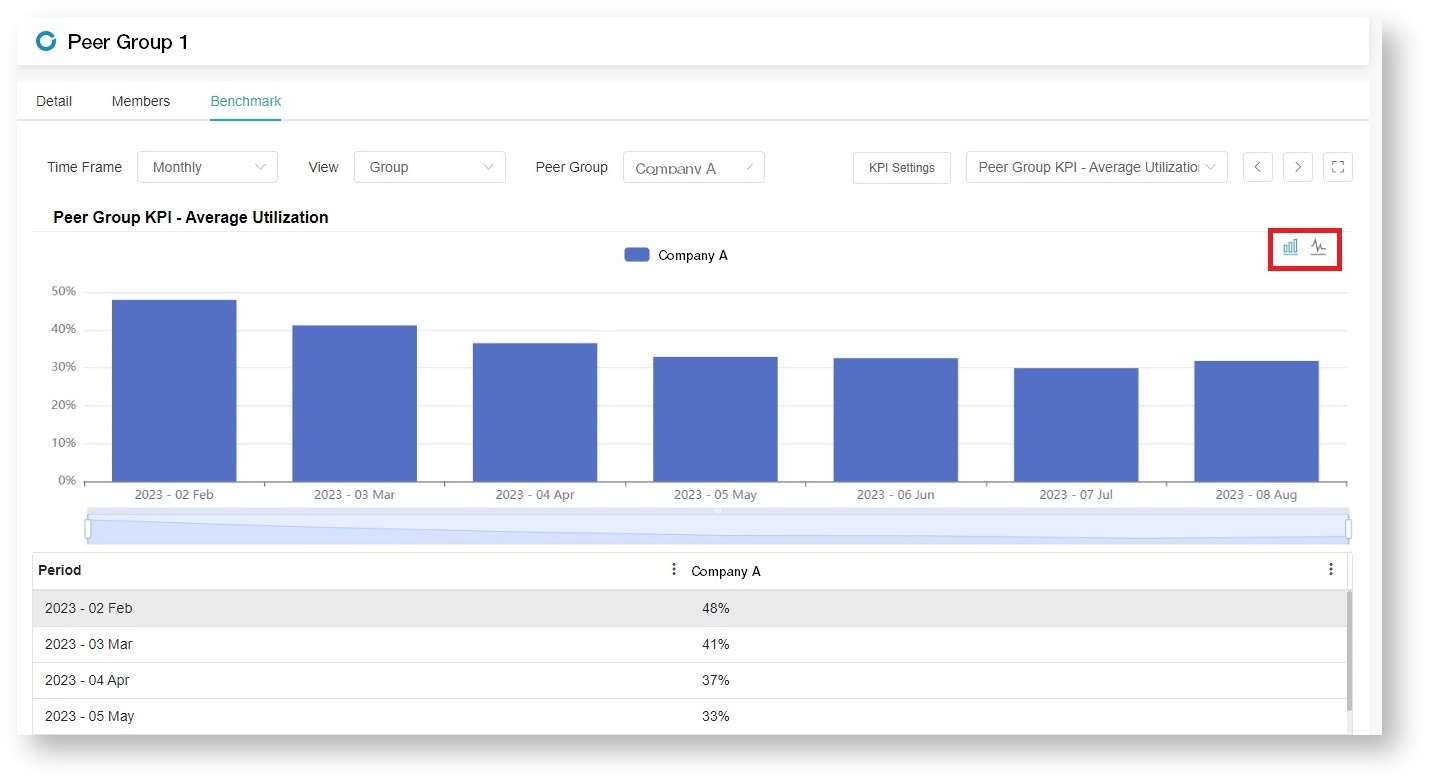
- Chart switch - Click the bar chart icon to view the data using a bar chart or click the line chart icon to view data using a line chart.
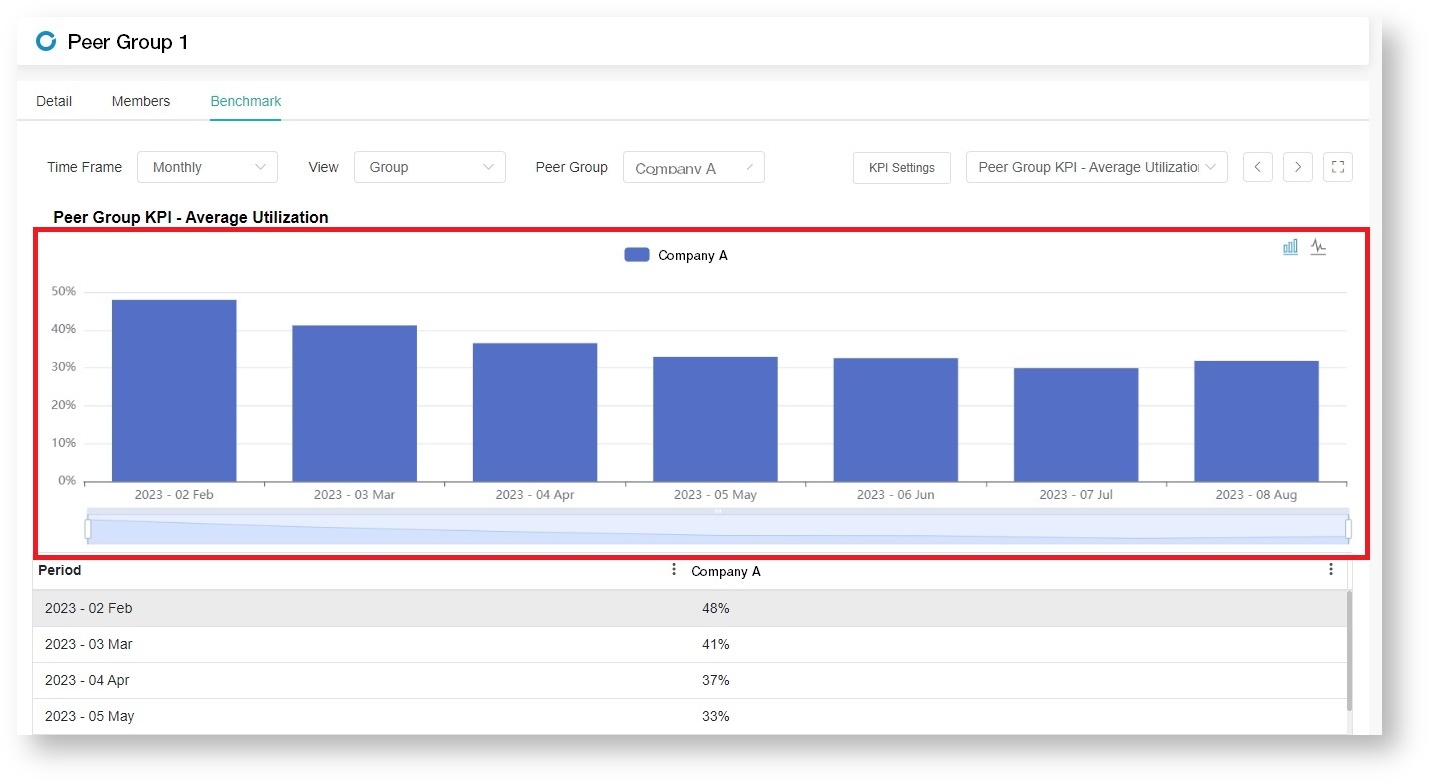
- Customize the x-axis data - Hover over the graph and scroll the mouse wheel to adjust the data displayed on the x-axis. Alternatively, you can drag the ends of the bar below the graph to adjust the data.
