 N O T I C E
MSPbots WIKI is moving to a new home at support.mspbots.ai![]() to give you the best experience in browsing our Knowledge Base resources and addressing your concerns. Click here
to give you the best experience in browsing our Knowledge Base resources and addressing your concerns. Click here![]() for more info!
for more info!
 N O T I C E
MSPbots WIKI is moving to a new home at support.mspbots.ai![]() to give you the best experience in browsing our Knowledge Base resources and addressing your concerns. Click here
to give you the best experience in browsing our Knowledge Base resources and addressing your concerns. Click here![]() for more info!
for more info!
The Accounting Mapping feature allows users to display and map their chart of accounts in MSPbots, and use it to create widgets, bots, and dashboards.
The Accounting Mapping feature requires data from the accounting integrations QuickBooks Online, QuickBooks On-Premise, and Xero. Only users with a financial role can use this feature.
This article is a guide on how to:
Access the Account Mapping feature
To access this feature, go to Settings > Accounting Mapping.
›
This will show the Accounting Dashboard, where you can do the following:
- Use the data from the integrated accounting software, and select a Financial Statement to map between Profit & Loss and Balance Sheet.
- Review all sub-accounts that are displayed on the left side.
Select a Mapping Template. The most commonly used templates are for the following:
Service Leadership SLI
Bering McKinley
Encore
- MSP Finance Team
- N-able Benchmark
- Taylor Business Group TAAP
- Technology Marketing Toolkit
- TruMethods
Users can also create new templates by clicking the Edit Mapping Templates link on the upper right corner of the dashboard.
Contact our Support Team after creating your mapping template so they can help you integrate it with the mapping data.
- Categorize sub-accounts by dragging them to the mapping template.
Use the mapped accounts
To use the mapped accounts in widgets:
- On the MSPbots app, go to Widgets.
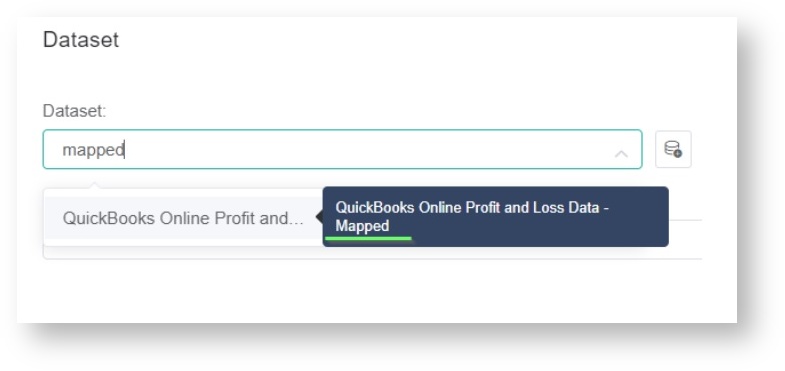
- Select a widget, go to Dataset, and select mapped from the Dataset drop-down list.
- Select the map in the Column Name field.
For now, the selection currently shows the maps available to income accounts only. Balance Sheets will also be available soon.


