 N O T I C E
MSPbots WIKI is moving to a new home at support.mspbots.ai![]() to give you the best experience in browsing our Knowledge Base resources and addressing your concerns. Click here
to give you the best experience in browsing our Knowledge Base resources and addressing your concerns. Click here![]() for more info!
for more info!
 N O T I C E
MSPbots WIKI is moving to a new home at support.mspbots.ai![]() to give you the best experience in browsing our Knowledge Base resources and addressing your concerns. Click here
to give you the best experience in browsing our Knowledge Base resources and addressing your concerns. Click here![]() for more info!
for more info!
App Description
The Utilization Analysis for the ConnectWise Manage app measures the billable time spent by technicians. In this app, you can view Utilization Analysis Report For ConnectWise Manage which contains widgets showing various utilization analysis results. This report helps MSP business owners and service managers to allocate tasks and resources so as not to underload or overload the technicians.
App Link
Utilization Analysis for the ConnectWise Manage
How to Access the App
To access the Utilization Analysis for ConnectWise Manage app, follow these steps:
- Log in to MSPbots.
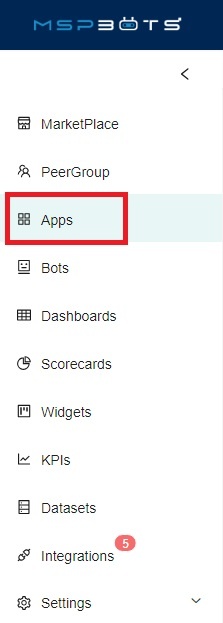
- Go to Apps in the left pane.
- When the My Application screen opens, click Utilization Analysis for ConnectWise Manage.
Why should you care?
- For Stakeholders: This app helps measure how effective your technicians are. This app determines if the business utilizes time to a maximum to receive a better return on investment (ROI).
- For Managers: This app gives managers visibility of the technicians' billable hours and available hours. Proper utilization is important to help allocate enough work to technicians and to prevent overwork that may lead to burnout.
- For Technicians: This app helps technicians achieve their target utilization rate. This app also helps them receive the right amount of workload based on the proper allocation of their respective managers.
Related Integration
ConnectWise Manage. If you need to configure ConnectWise Manage integration, please refer to ConnectWise Manage Integrations Setup.
Requirements
- Active ConnectWise Manage Integration
- (OPTIONAL) The user's manager is configured within Azure Active Directory
Widget Components
Widget Name | Description |
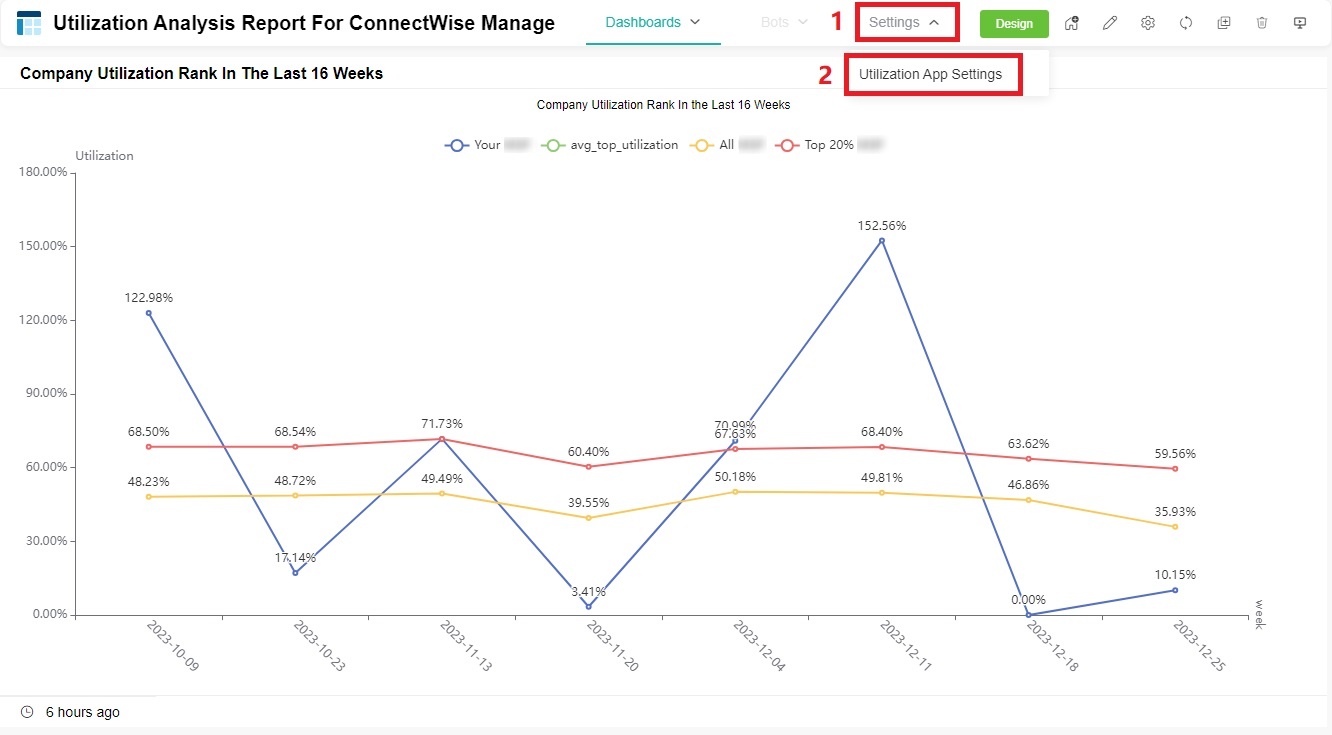
| Company Utilization Rank In The Last 16 Weeks | This widget shows your company's daily utilization rating rank for the last 16 weeks, and then compares your info to other MSPs and the top 20% of MSPs using MSPbots. |
| Company Average Weekly Utilized Time Rank In The Last 16 Weeks | This widget shows your company's weekly Utilized Time trend for the last 16 weeks, and then compares your info to other MSPs and the top 20% of MSPs using MSPbots. |
| Average Daily Utilized Time Past 7 Days | This widget measures if in the past 7 days, the technicians are using their work hours to do the tasks which they are hired to perform. |
| Average Daily Work Hour Past 7 Days | This widget measures the average daily work hours that technicians logged in the last 7 days. |
| Daily Utilization Rate Past 7 Days | This widget measures if technicians are meeting the target daily utilization rate in the last 7 days. |
| Average Daily Utilized Time Past 30 Days | This widget measures if in the past 30 days, technicians are using their work hours to do the tasks which they are hired to perform. |
| Average Daily Work Hour Past 30 Days | This widget measures the average daily work hours logged by technicians in the last 30 days. |
| Daily Utilization Rate Past 30 Days | This widget measures if technicians are meeting the target utilization rate of their work hours in the last 30 days. |
| 7 Days Detailed Utilization Analysis | This widget shows the detailed utilization analysis for the last 7 days, excluding the current day. |
| 30 Days Detailed Utilization Analysis | This widget shows the utilization analysis for the last 30 days, excluding the current day. |
| Daily Average Utilized Work Hours by User Past 7 Days | This widget shows each user's average billable, non-billable, and no-charge hours in the last 7 days. |
| Users Falling Below Target Utilization Rate Past 7 Days | This widget shows the average billable, non-billable, and no-charge hours of the users who are falling below the target utilization rate in the last 7 days. |
| Daily Work Hours & Utilization Ratio Trend in Past 30 Days | This widget shows the company's daily work hours and utilization ratio trend in the past 30 days. |
| Daily Average Utilized Work Hours By User Past 30 Days | This widget shows the average work hours that each user utilized daily in the past 30 days. |
| Company Utilization Rank Last 30 Days | This widget shows a comparative report about how your company's utilization rank compares to other MSPs using MSPbots. |
| ConnectWise Time Entry Analysis For Utiilization | This widget shows the total hours that each employee utilized for the last 30 days. |
Setup Procedures
Perform the setup procedures for Utilization Analysis for ConnectWise Manage to specify the teams or members that you want to exclude from your utilization report.
To perform the setup procedures, follow these steps:
- On the Utilization Analysis Report For ConnectWise Manage screen, point to Settings, and then click Utilization App Settings.
- On the Utilization App Settings screen, do any of the following:
- From the Exclude Team list, select the teams that you want to exclude from the utilization report.
- From the Exclude Member list, select the team members that you want to exclude from the utilization report.
- In Exclude the member has less than number time entries in last 30 days, specify the minimum number of time entries that members should accumulate in the last 30 days for them to not be excluded from the utilization report.
- Turn on the switch to automatically exclude specific members from the utilization report based on your settings in ConnectWise.
Please note that when you toggle the switch, the option Included in Utilization reporting set within the ConnectWise Manage app will override the Exclude Member setting in the Utilization Analysis Report for ConnectWise Manage app of MSPbots.
- Click Submit.
Data Sources
CW Utilization APP


