 N O T I C E
MSPbots WIKI is moving to a new home at support.mspbots.ai![]() to give you the best experience in browsing our Knowledge Base resources and addressing your concerns. Click here
to give you the best experience in browsing our Knowledge Base resources and addressing your concerns. Click here![]() for more info!
for more info!
 N O T I C E
MSPbots WIKI is moving to a new home at support.mspbots.ai![]() to give you the best experience in browsing our Knowledge Base resources and addressing your concerns. Click here
to give you the best experience in browsing our Knowledge Base resources and addressing your concerns. Click here![]() for more info!
for more info!
The MSP Finance Team Financial Metrics and Benchmarks Suite gives insights into a company's financial performance by providing a comprehensive understanding of overall profitability and efficiency based on Expenses, Revenue, Labor Hours, and Labor Costs data.
Why you should use the MSP Finance Team Financial Metrics and Benchmarks Suite
With this app, you as a business owner or a service manager can:
- Have valuable insights into the performance of your business and make informed decisions about how to allocate resources, set goals, and plan for the future.
- Compare your company's metrics against industry standards over a given period using the suite's benchmarking widgets. A dashboard for each metric shows your company's performance side by side with the MSP industry's Bottom 1/4 Average, Median, and Best in Class (BIC) Average.
- Filter values in the dashboards by Date Range and drill through most widgets for breakdowns and to show more details.
How to start using the app
Here are the steps for setting up the MSP Finance Team Financial Metrics and Benchmarks Suite:
- Link your accounting software to MSPbots. Please refer to the following articles for instructions on connecting your software:
- Next, map your accounts using our Service Leadership SLI Accounting Mapping Template. Read the article How to Access and Use the Accounting Mapping Feature for the instructions.
- After mapping your accounts, update your MSP Finance Team Dashboards Settings. To do this on the MSPbots app:
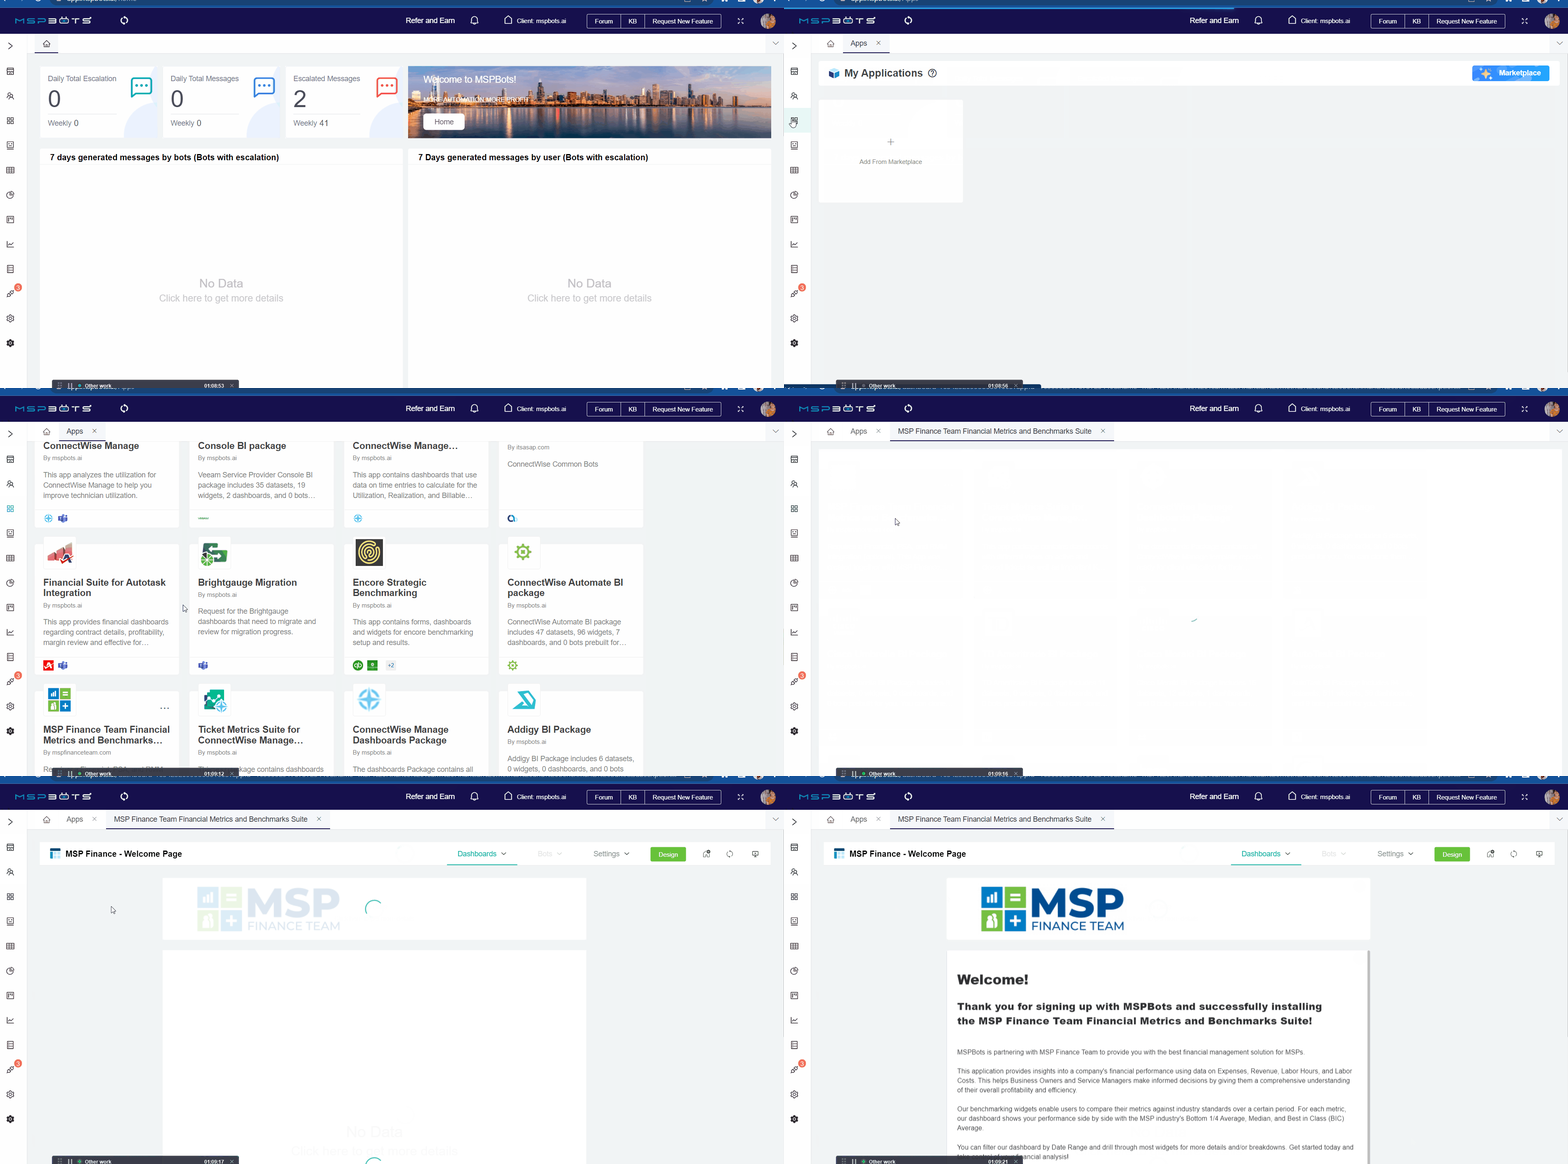
- Navigate to Apps, find Finance Team Financial Metrics and Benchmarks Suite, and click it.
- Hover over Settings and select MSP Finance Team Dashboard Settings.
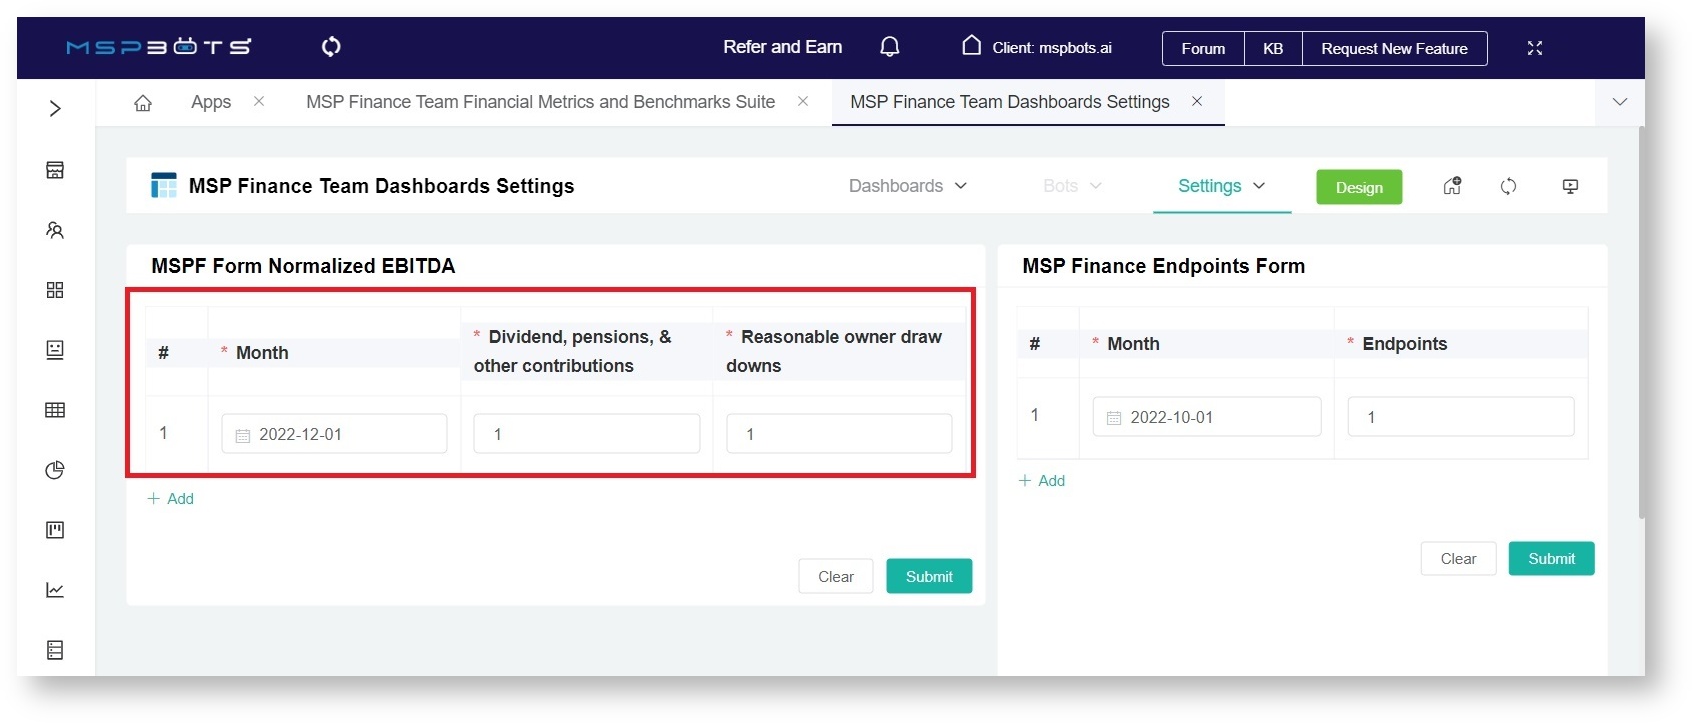
- When the MSP Finance Team Dashboards Settings opens, go to the MSPF Form Normalized EBITDA section and input your company's Normalized EBITDA calculation.
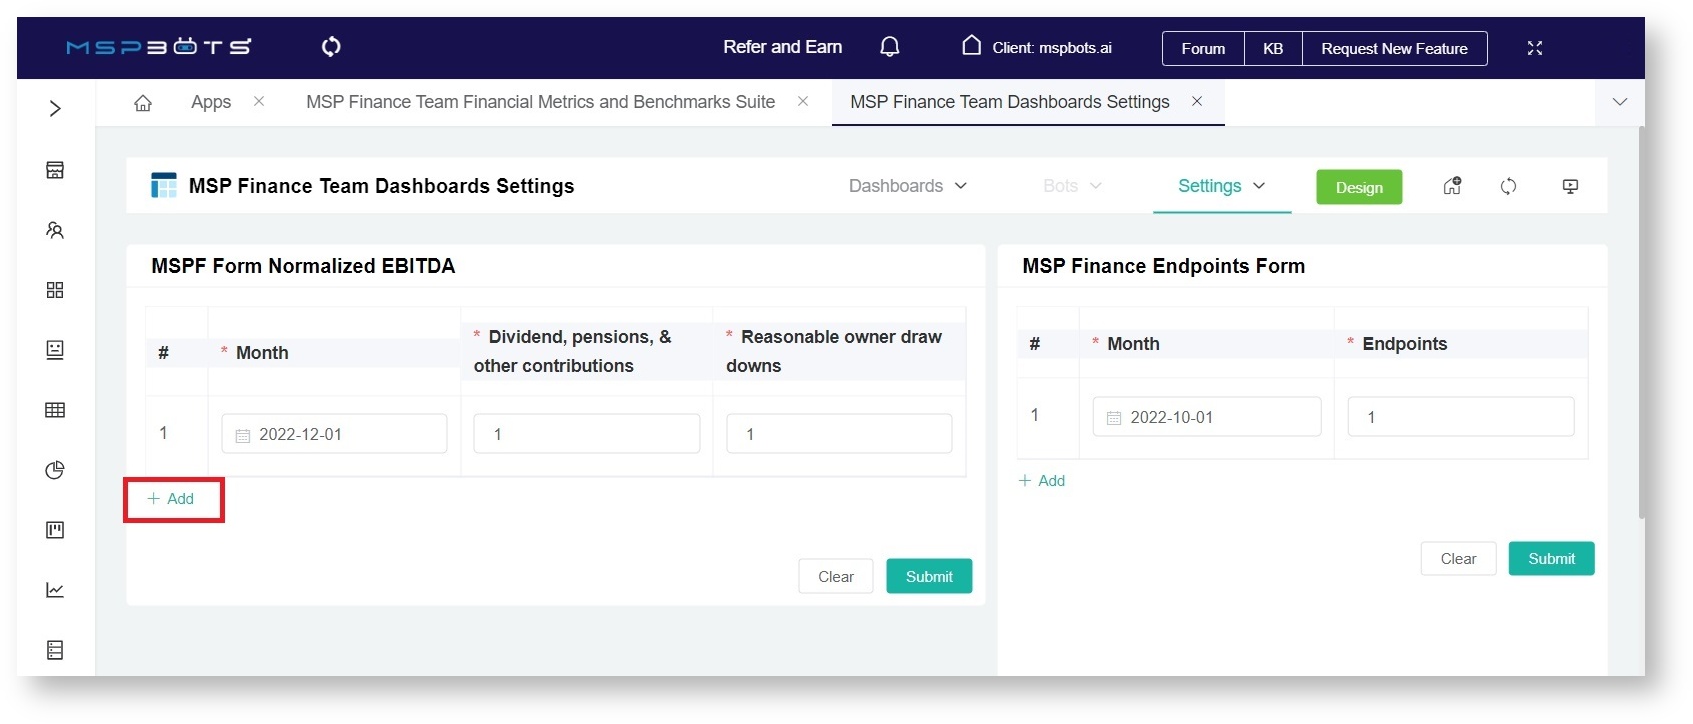
Click the +Add button to add data for more months. - Click Submit.
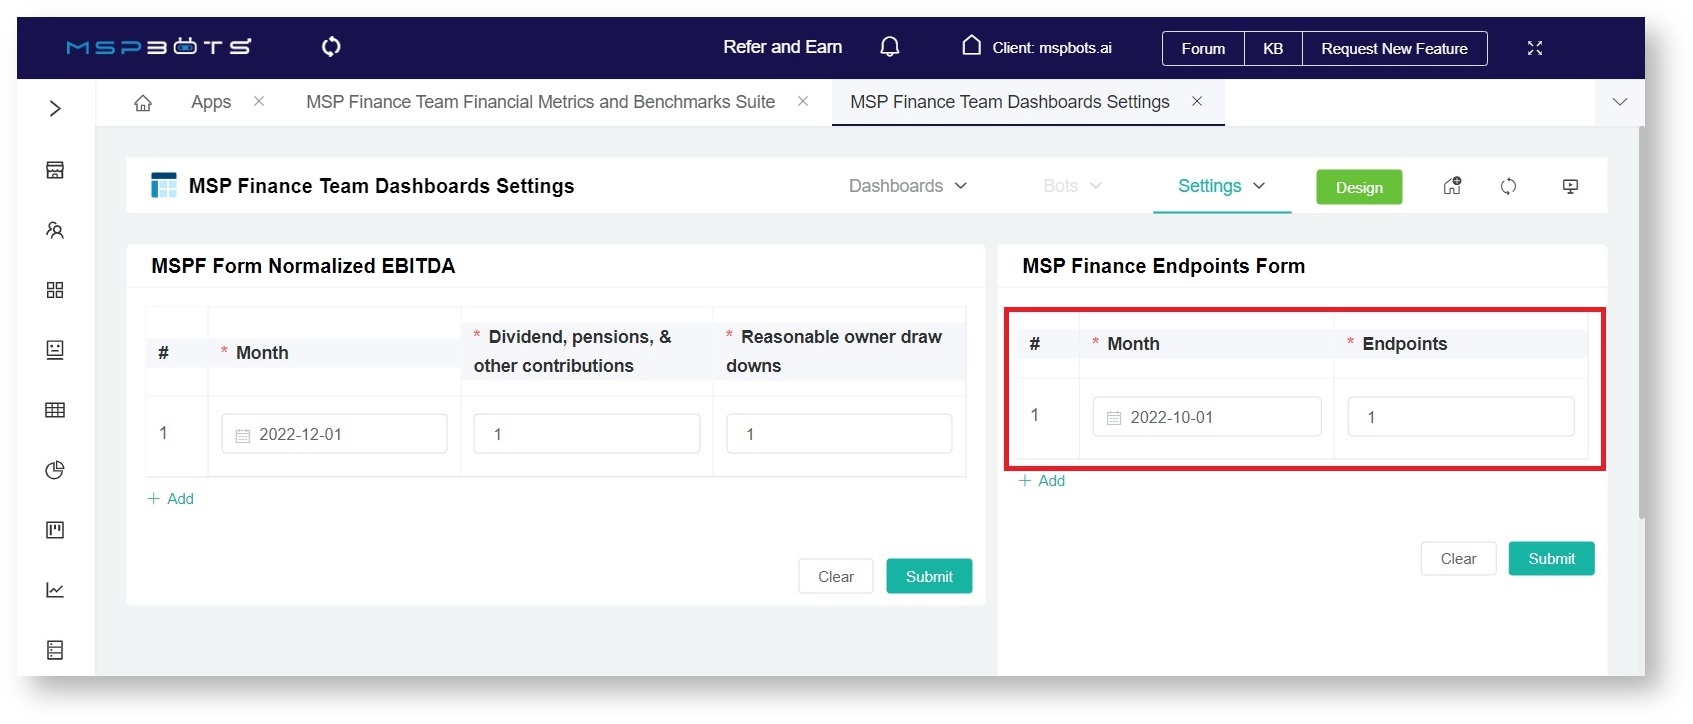
- Then enter your Total Sales or Endpoints for the month as well.
Click the +Add button to add data for more months. - Click Submit.
- Navigate to Apps, find Finance Team Financial Metrics and Benchmarks Suite, and click it.
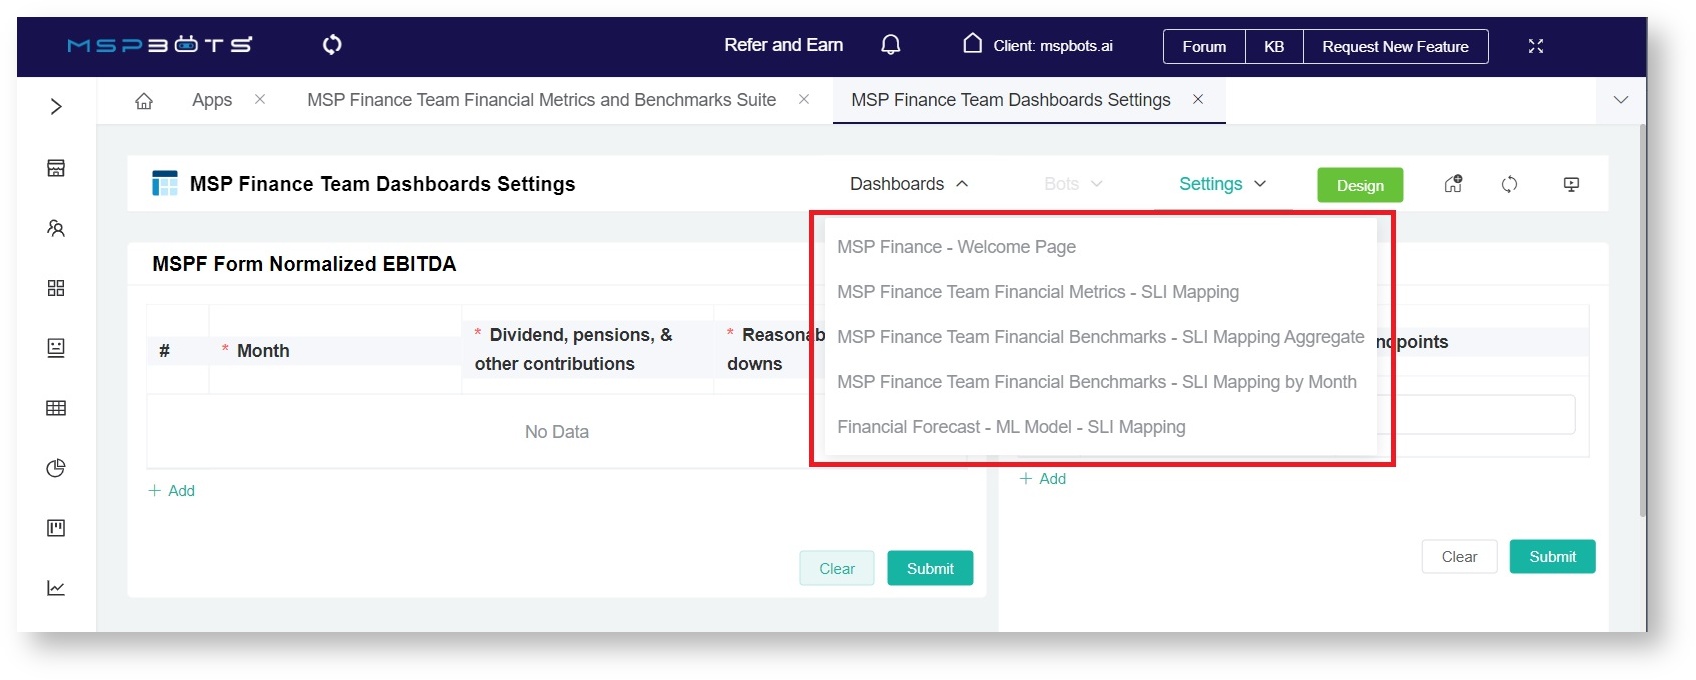
- When done with settings, you are ready to view the data in your dashboards. Hover over the Dashboards and click any of the following to view the results:
- MSP Finance Team Financial Metrics - SLI Mapping
- MSP Finance Team Financial Benchmarks - SLI Mapping Aggregate
- MSP Finance Team Financial Benchmarks - SLI Mapping by Month
- Financial Forecast - ML Model - SLI Mapping
For more information on these dashboards, read MSP Finance Team Financial Metrics and Benchmarks Suite Dashboards.
Overview
Content Tools
