 N O T I C E
MSPbots WIKI is moving to a new home at support.mspbots.ai![]() to give you the best experience in browsing our Knowledge Base resources and addressing your concerns. Click here
to give you the best experience in browsing our Knowledge Base resources and addressing your concerns. Click here![]() for more info!
for more info!
N O T I C E
MSPbots WIKI is moving to a new home at support.mspbots.ai![]() to give you the best experience in browsing our Knowledge Base resources and addressing your concerns. Click here
to give you the best experience in browsing our Knowledge Base resources and addressing your concerns. Click here![]() for more info!
for more info!
The MSPbots Profit Insights App offers a comprehensive view of your company's financial performance by providing detailed analytics and data-driven insights. It examines financial data such as total billed, gross revenue, effective rate, and contribution rate to give you a clear understanding of your company's profitability, efficiency, and fiscal health. With real-time data presented through dashboards and widgets, business owners, service managers, and key stakeholders can make informed decisions, evaluate performance comprehensively, and take timely action.
What's on this page:
What are the benefits of using the MSPbots Profit Insights App?
The MSPbots Profit Insights App is a valuable tool for analyzing the different aspects of your business like the following:
- Client profitability and service performance - Identify profitable services or clients and costs that impact margins negatively by tracking revenue, expenses, and profitability trends over time.
- Cost analysis - Determine areas where costs can be optimized or reduced.
- Forecasting and planning - Utilize historical data to plan strategically and create forecasts and projections for future revenues, expenses, and overall profitability.
- Identifying growth opportunities - Scale profitable areas and services and explore new avenues for growth from data that helps you understand what's working well financially.
- Risk management - Analyze data to identify and proactively mitigate potential risks before they become significant issues.
Who can use the MSPbots Profit Insights App?
The MSPbots Profits Insights App dashboards are available to ConnecWise Manage users. Only users with the admin role can modify the settings.
What are the dashboards available in the MSPbots Profit Insights App?
Each of the MSPbots Profits Insights App dashboards offers unique insights into your financial landscape. These dashboards are discussed below.
Profitability Analysis Dashboard
The Profitability Analysis dashboard provides a comprehensive overview of the profitability of all agreements within a specified period and helps businesses assess their revenue, expenses, and profitability across different types of agreements. Use the data in the widgets to make data-driven decisions for optimizing costs and enhancing revenue.
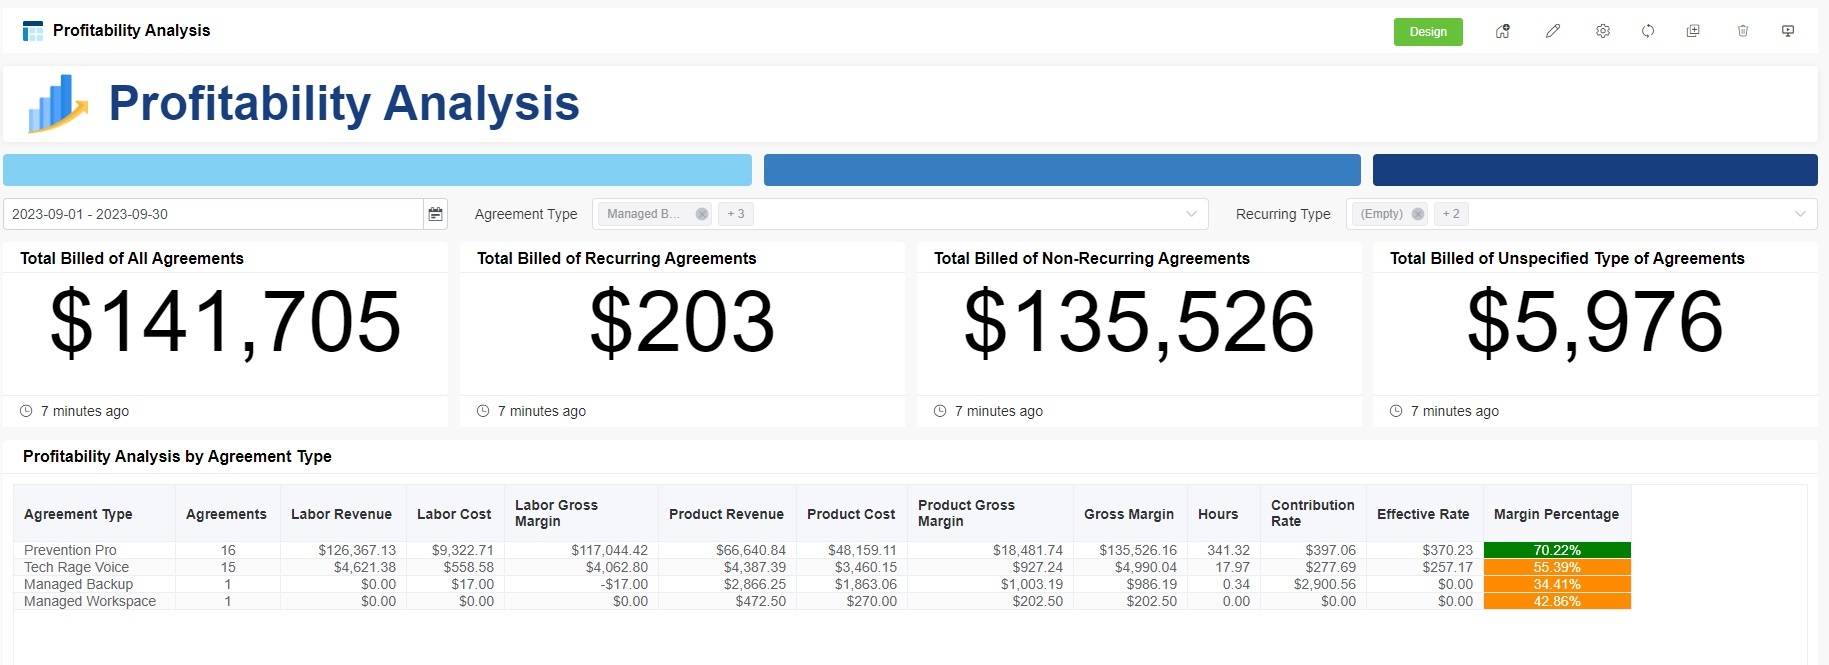
These are the widgets in the Profitability Analysis Dashboard.
| Widgets | Description | When to Use |
|---|---|---|
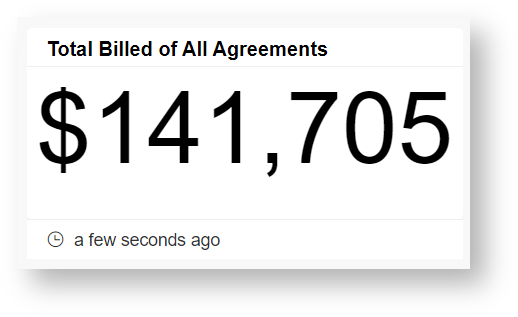
Total Billed of All Agreements | This widget displays the total amount billed across all agreements within the selected time frame. It offers a holistic view of revenue generated from all types of agreements.
|
Use the Total Billed of All Agreements widget to quickly assess the total revenue generated by all agreements, providing an overview of your financial performance. |
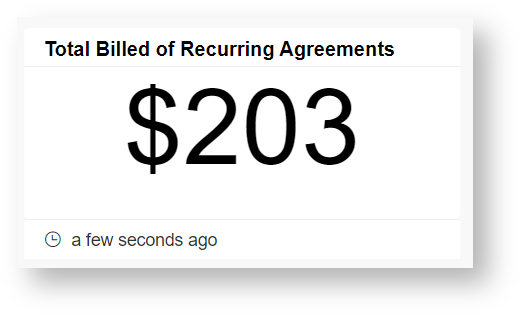
Total Billed of Recurring Agreements | This widget displays the total billed amount for recurring agreements. Recurring agreements typically involve regular payments, such as subscriptions or service contracts.
|
The Total Billed of Recurring Agreements widget helps distinguish between ongoing revenue streams and one-time transactions.
|
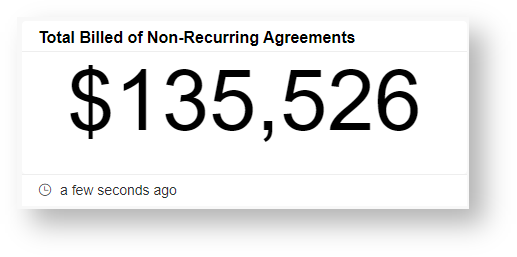
Total Billed of Non-Recurring Agreements | This widget presents the total billed amount for non-recurring agreements. Non-recurring agreements typically involve one-time transactions, such as product sales or project-based services.
|
The Total Billed of Non-Recurring Agreements widget also helps distinguish between ongoing revenue streams and one-time transactions. |
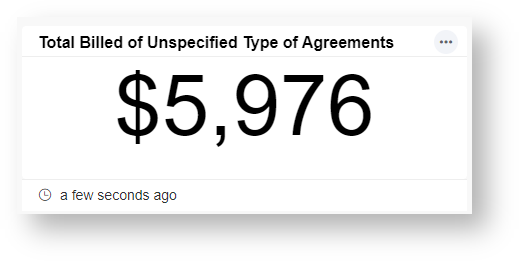
Total Billed of Unspecified Type of Agreements | This widget tracks the total billed amount for agreements with unspecified or undefined types and may include agreements that lack clear classification or labeling.
|
The Total Billed of Unspecified Type of Agreements widget can highlight agreements that require further classification or attention.
|
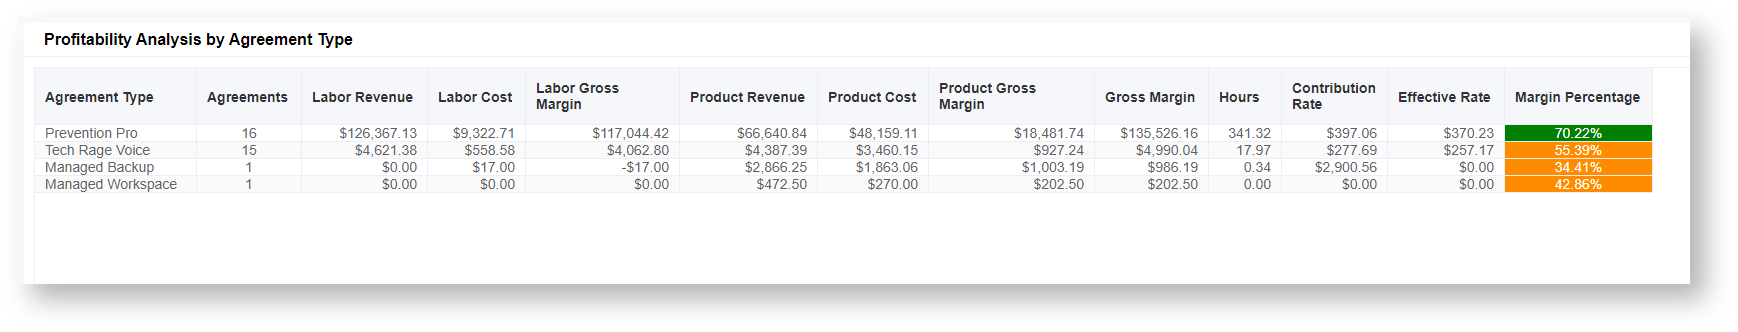
Profitability Analysis by Agreement Type | This widget provides a breakdown of profitability based on different agreement types. It allows users to assess which types of agreements contribute the most to overall profitability.
|
The Profitability Analysis by Agreement Type widget identifies the most profitable agreement categories and those that contribute significantly to revenue.
|
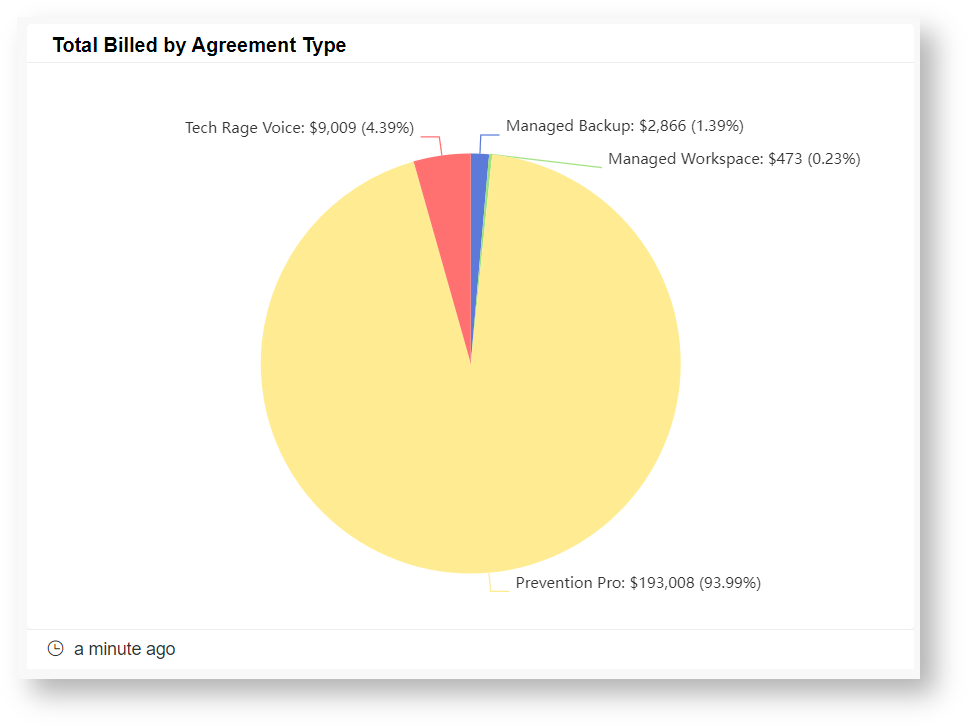
Total Billed by Agreement Type | This widget displays the total billed amount categorized by agreement types. It helps users understand the revenue distribution across various agreement categories.
|
The Total Billed by Agreement Type widget also identifies which agreement categories are most profitable and contribute significantly to revenue. |
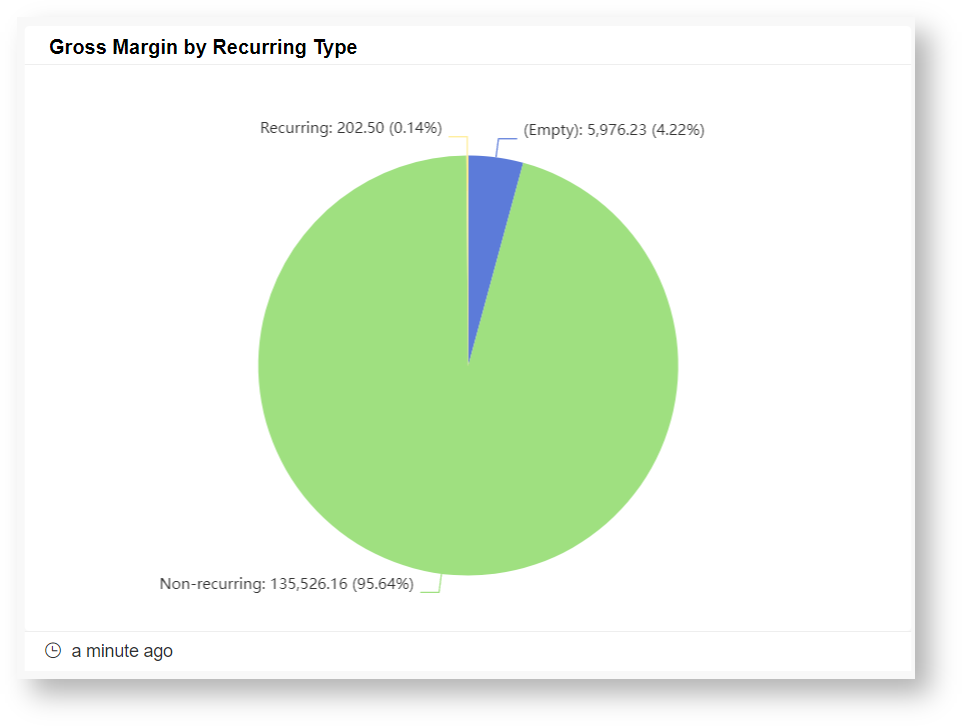
Gross Margin by Recurring Type | This widget focuses on the gross margin of recurring agreements. Gross margin is a critical indicator of profitability, representing the difference between revenue and the cost of goods or services sold.
|
Use the Gross Margin by Recurring Type widget to assess the profitability of recurring agreements. |
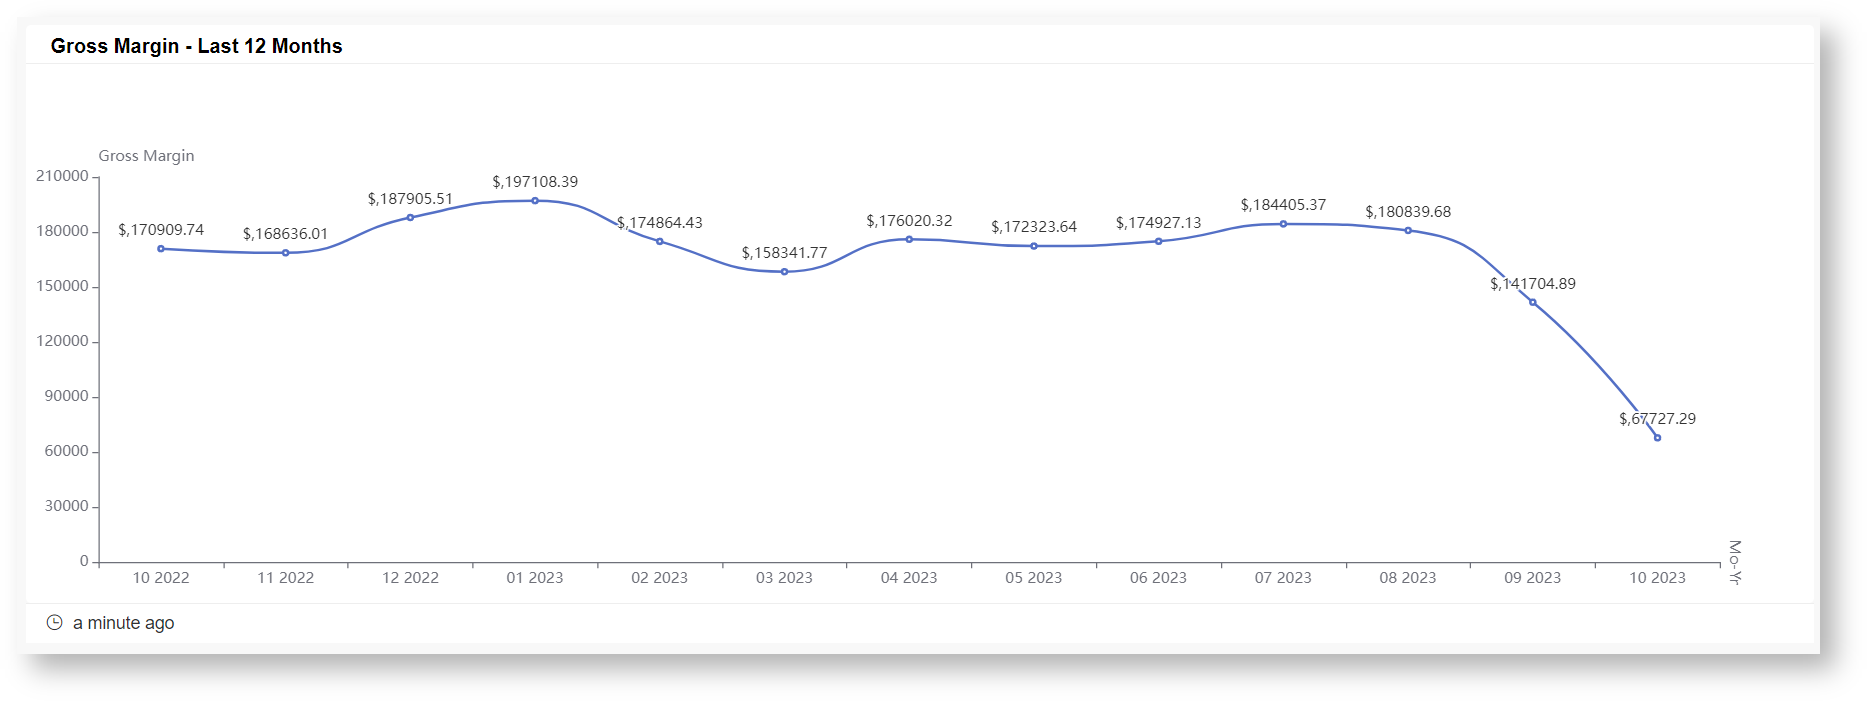
Gross Margin - Last 12 Months | This widget provides an overview of the gross margin for the past 12 months. Monitoring gross margin trends over time can help identify areas for improvement or growth.
|
Use the Gross Margin - Last 12 Months widget to track trends over time. |
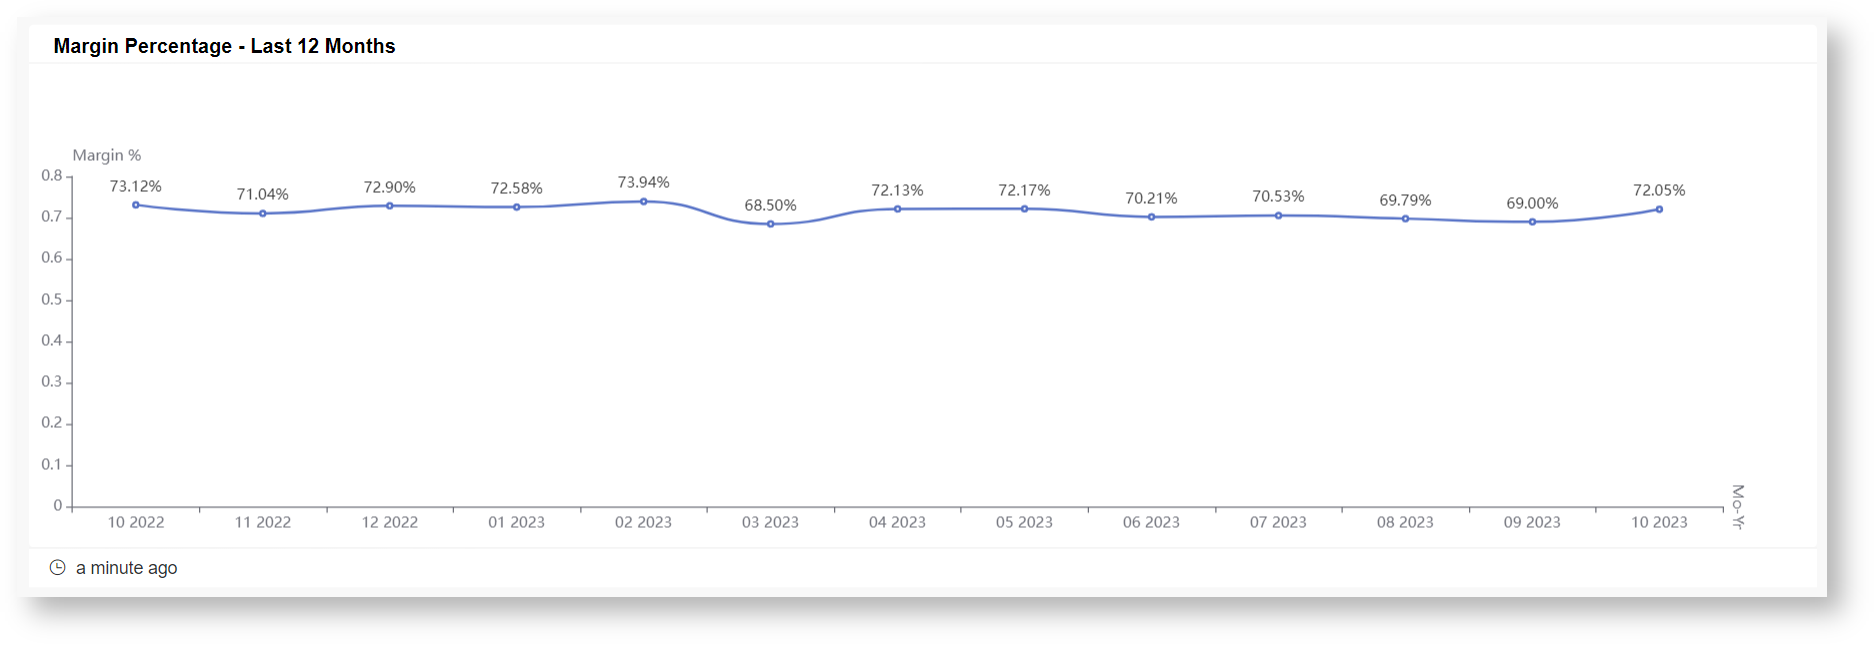
Margin Percentage - Last 12 Months | This widget calculates and displays the margin percentage for the last 12 months. Margin percentage is a key performance metric that reflects the profitability of agreements relative to their costs.
|
Use the Margin Percentage - Last 12 Months widget to get insight into the percentage of revenue retained as profit. |
Agreement Profitability by Company
The Agreement Profitability by Company dashboard offers a detailed analysis of the profitability of all agreements organized by company during a specified time. Other than providing insights into financial performance, it also highlights crucial trends related to Margin Percentage, Contribution Rate, Total Billed by Recurring Type, and Total Actual Hours by Recurring Type. By examining these key profitability metrics, businesses can gain a comprehensive understanding of their financial health, enabling them to make informed decisions, optimize costs, and formulate strategies for revenue growth and enhanced profitability.

These are the widgets in the Profitability Analysis Dashboard.
| Widget | Description | When to use |
|---|---|---|
| Profitability Analysis by Company | This widget offers a comprehensive view of profitability by breaking down the data by individual companies. It allows users to evaluate the financial performance of different business entities within the organization.
|
Utilize the "Profitability Analysis by Company" widget to evaluate the financial performance of individual companies within your organization. This insight can inform resource allocation, investment decisions, and business strategy. |
| Margin Percentage - Last 12 Months | Monitoring margin percentage over the last 12 months is crucial for assessing the profitability of agreements. This widget helps in tracking the profitability trend and identifying areas that may require attention or improvement.
|
Keep a close eye on the "Margin Percentage - Last 12 Months" widget to identify long-term profitability trends. Understanding these trends can aid in strategic planning and cost optimization efforts. |
| Contribution Rate - Last 12 Months | The Contribution Rate is a vital metric that measures the proportion of revenue that contributes to profit after covering direct costs. Examining this widget over the past year helps businesses understand their ability to generate profit from their revenue.
| The "Contribution Rate - Last 12 Months" widget provides insights into how efficiently revenue is converted into profit. Evaluate this metric to identify areas where cost control or revenue enhancement is needed. |
| Total Billed by Recurring Type - Last 12 Months | This widget breaks down the total billed amount by different recurring agreement types. It provides insights into revenue distribution across various recurring agreement categories. | Recurring Agreement Analysis: Use "Total Billed by Recurring Type - Last 12 Months" to assess the revenue distribution among different recurring agreement types. This can guide decisions regarding pricing, marketing, and resource allocation. |
| Total Actual Hours by Recurring Type - Last 12 Months | This widget tracks the total actual hours spent on different recurring agreement types over the last 12 months. It is essential for understanding resource utilization and optimizing operations. | Resource Utilization: The "Total Actual Hours by Recurring Type - Last 12 Months" widget helps in understanding how resources are allocated across different recurring agreement types. This data can inform staffing decisions and service level improvements. |


Agreement Profitability
The Agreement Profitability by Company dashboard offers a comprehensive view of your business' financial performance, with a focus on key metrics such as monthly trends in total billed, gross revenue, and margin. In addition to tracking these critical indicators, the dashboard also provides leader boards highlighting the top 10 companies with the highest and lowest gross revenue. This valuable information empowers businesses to monitor their financial health, make informed decisions, and identify areas for improvement.

The Agreement Profitability Dashboard serves as a powerful tool for monitoring financial performance, identifying trends, and fostering data-driven decision-making. Regularly reviewing these widgets empowers businesses to optimize their profitability and ensure sustainable growth. Below are the widgets in the Agreement Profitability Dashboard.
| Widget | Description | When to use |
|---|---|---|
| Agreement Revenue Trend | This widget displays the monthly trend of total billed amounts, providing insights into the revenue generated by your agreements over time. Analyzing this trend helps you understand the growth or fluctuations in revenue. | Revenue and Margin Trends: Utilize the "Agreement Revenue Trend" and "Agreement Gross Margin Trend" widgets to track the monthly performance of your agreements. Identify patterns, spikes, or dips in revenue and margin to guide strategic decisions. |
| Agreement Gross Margin Trend | The Agreement Gross Margin Trend widget illustrates the monthly trend in gross revenue, which represents the total revenue minus the cost of goods or services sold. Monitoring this trend is essential for assessing your profitability over time.
| Revenue and Margin Trends: Utilize the "Agreement Revenue Trend" and "Agreement Gross Margin Trend" widgets to track the monthly performance of your agreements. Identify patterns, spikes, or dips in revenue and margin to guide strategic decisions. |
| Contribution Rate - Last 12 Months | Contribution rate widget shows the monthly trend of contribution rates over the last 12 months. Contribution Rate is computed as: Contribution Rate = (Total Billed - (Labor Cost + Product Cost)) / Total Actual Hours It provides insights into your ability to generate profit from your revenue while accounting for labor and product costs.
| Regularly review the "Margin Percentage - Last 12 Months" and "Contribution Rate - Last 12 Months" widgets to assess your overall profitability. These metrics can guide cost control and revenue enhancement efforts while considering labor and product costs. |
| Margin Percentage - Last 12 Months | This widget calculates and displays the margin percentage for the last 12 months. Margin percentage is a key indicator of profitability, showing the percentage of revenue retained as profit after covering costs. Computation:
| Regularly review the "Margin Percentage - Last 12 Months" and "Contribution Rate - Last 12 Months" widgets to assess your overall profitability. These metrics can guide cost control and revenue enhancement efforts while considering labor and product costs. |
| Leader Board - Top 10 Highest Gross Revenue | This grid widget presents a leaderboard showcasing the top 10 companies with the highest gross revenue. It allows you to quickly identify your top-performing clients or partners.
| Identifying Top Performers: The "Leader Board - Top 10 Highest Gross Revenue" widget enables you to identify and recognize your top-performing clients or partners. This information can inform relationship management and growth strategies |
| Leader Board - Top 10 Lowest Gross Revenue | Similar to the previous leaderboard, this grid widget highlights the top 10 companies with the lowest gross revenue. It can help pinpoint areas where revenue generation may need improvement or where further analysis is required.
| Addressing Underperformers: The "Leader Board - Top 10 Lowest Gross Revenue" widget helps identify areas where revenue generation may be falling short. Use this data to investigate and address issues that may be affecting certain agreements. |


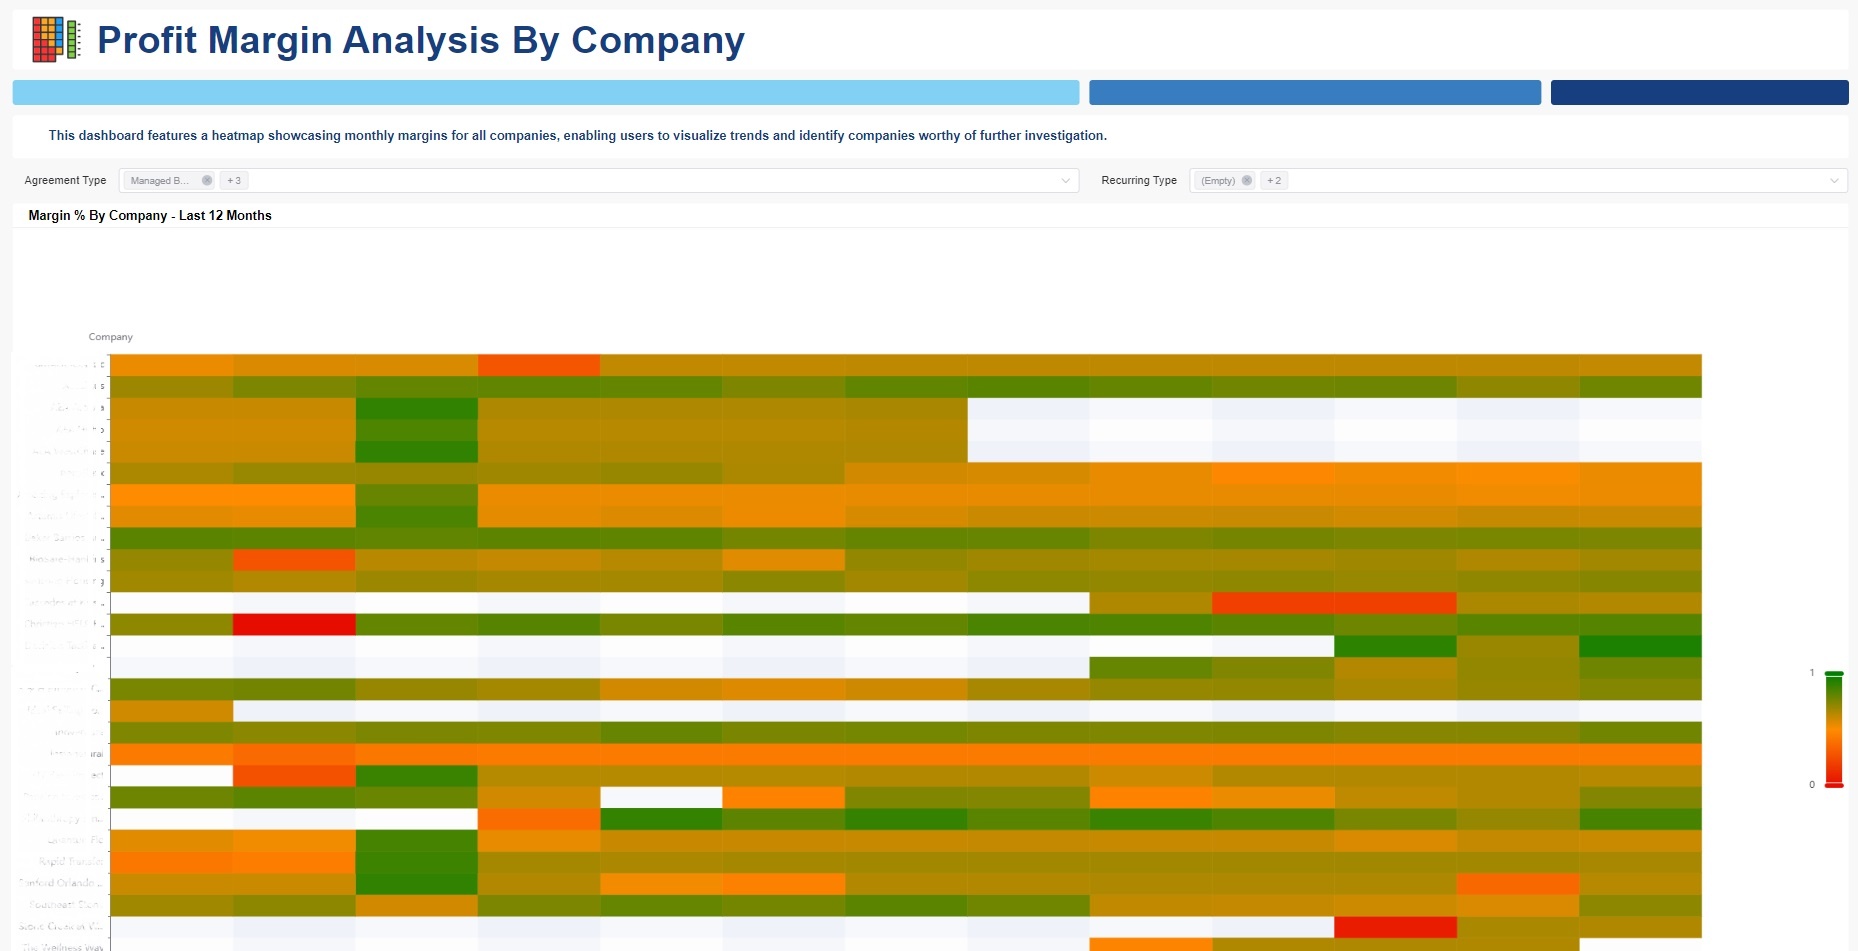
Profit Margin Analysis By Company
This dashboard features a heatmap showcasing monthly margins for all companies, enabling users to visualize trends and identify companies worthy of further investigation. It simplifies the assessment of profitability trends within your organization. By leveraging the heatmap visualization, users can efficiently identify areas of strength and areas that require attention, ultimately leading to more informed decision-making and improved overall profitability.
Below is the widget in the Profit Margin Analysis by Company Dashboard.
| Widget | Description | When to use |
|---|---|---|
| Margin % By Company - Last 12 Months | This heatmap widget presents a graphical representation of monthly margin percentages for all companies over the last 12 months. Each cell in the heatmap corresponds to a specific company and month, with colors indicating the margin percentage. Users can easily discern patterns and variations in profitability across different companies and periods.
| Use this widget to get a visual snapshot of how each company's profitability has evolved over the past year and spot trends, such as improving or declining profitability, across your organization. |
What are the key financial terms, metrics, and calculations featured in the MSPbots Profit Insights App?
The MSPbots Profit Insights App has a comprehensive set of financial metrics that provide valuable insights into your business's financial performance. These metrics, along with their calculations, include:
Term / Metric | Calculation |
|---|---|
| Product Gross Margin | Product Revenue - Product Cost |
| Labor Gross Margin | Labor Revenue - Labor Cost |
| Gross Margin | Total Revenue - (Labor Cost + Product Cost) |
| Margin % or Margin Percentage | (Gross Margin ÷ Total Revenue) * 100 |
| Effective Rate | Labor Revenue ÷ Total Actual Hours |
| Contribution Rate | [Total Billed - (Labor Cost + Product Cost) ] ÷ Total Actual Hours |
| Margin | Profit ÷ Billed |
| Actual Hours | Total recorded hours for an agreement |
How to modify the dashboard settings
Here are the steps for setting up the MSPbots Profit Insights App:
Adjusting the Addition Calculation Settings
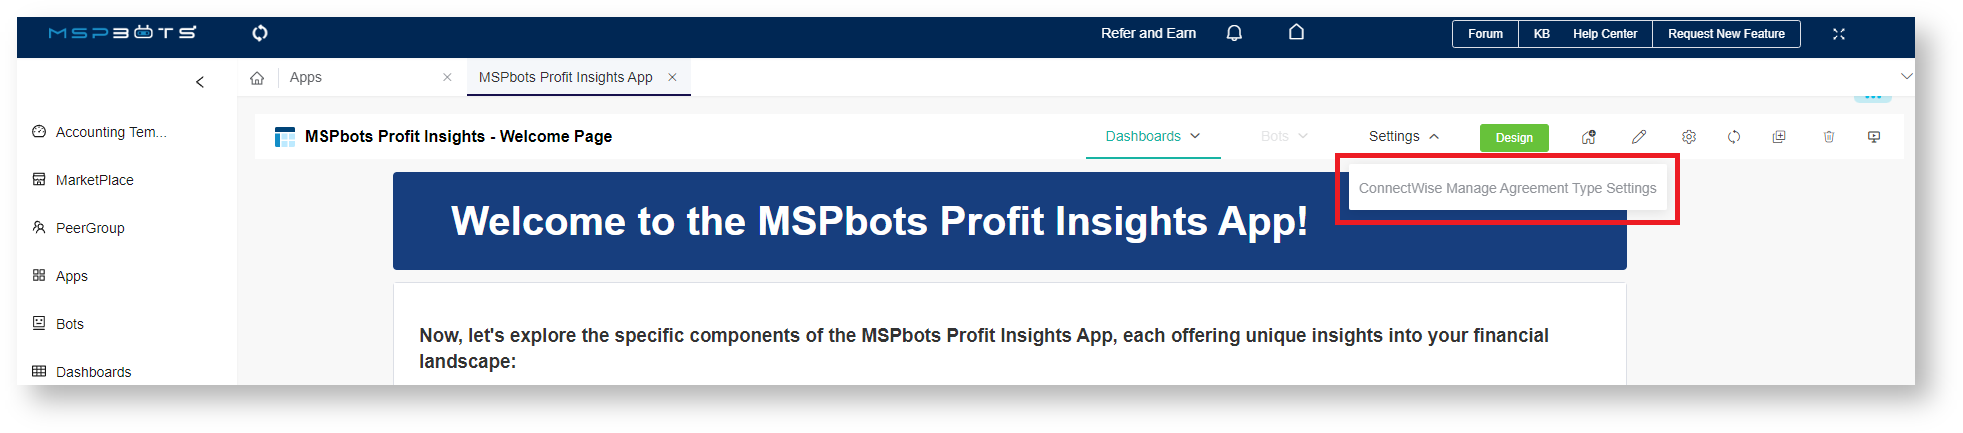
- Navigate to Apps, find the MSPbots Profit Insights App, and click it.
- Hover over Settings and select ConnectWise Manage Agreement Type Settings.
3. When the ConnectWise Manage Agreement Type Settings tab opens, go to the Addition Calculation Setting section and input your company's Agreement Addition Settings and Agreement Settings.
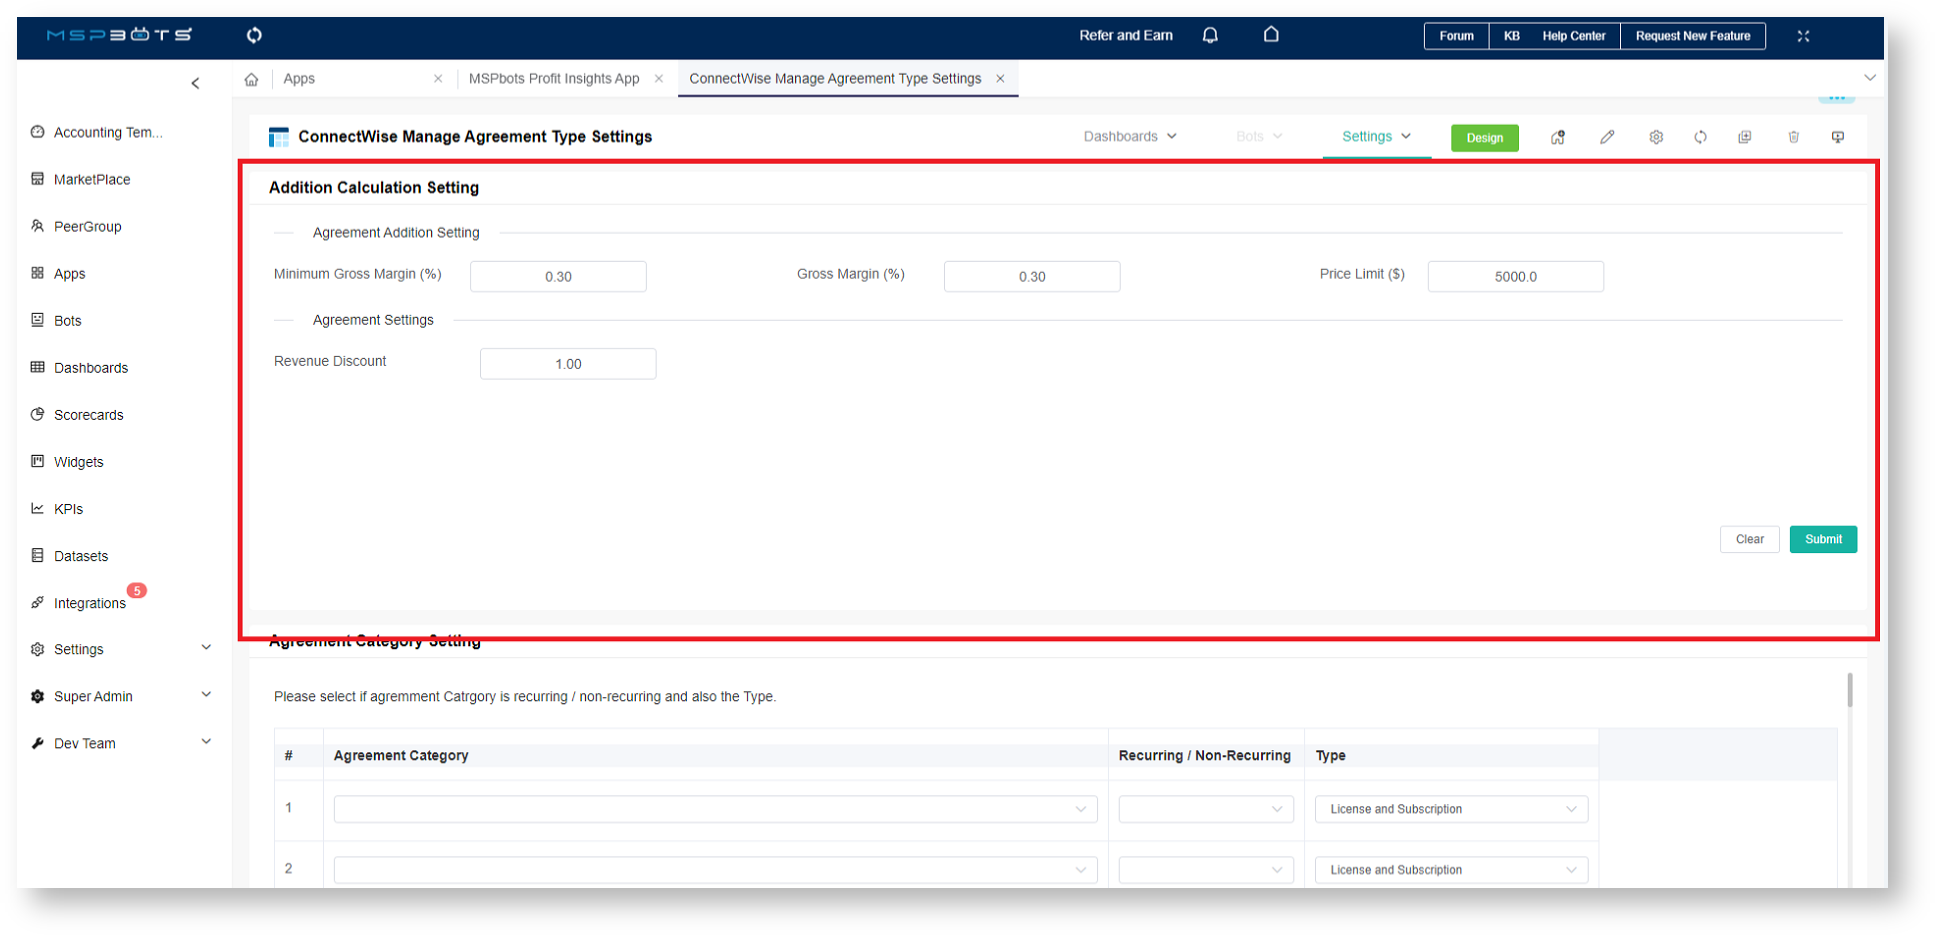
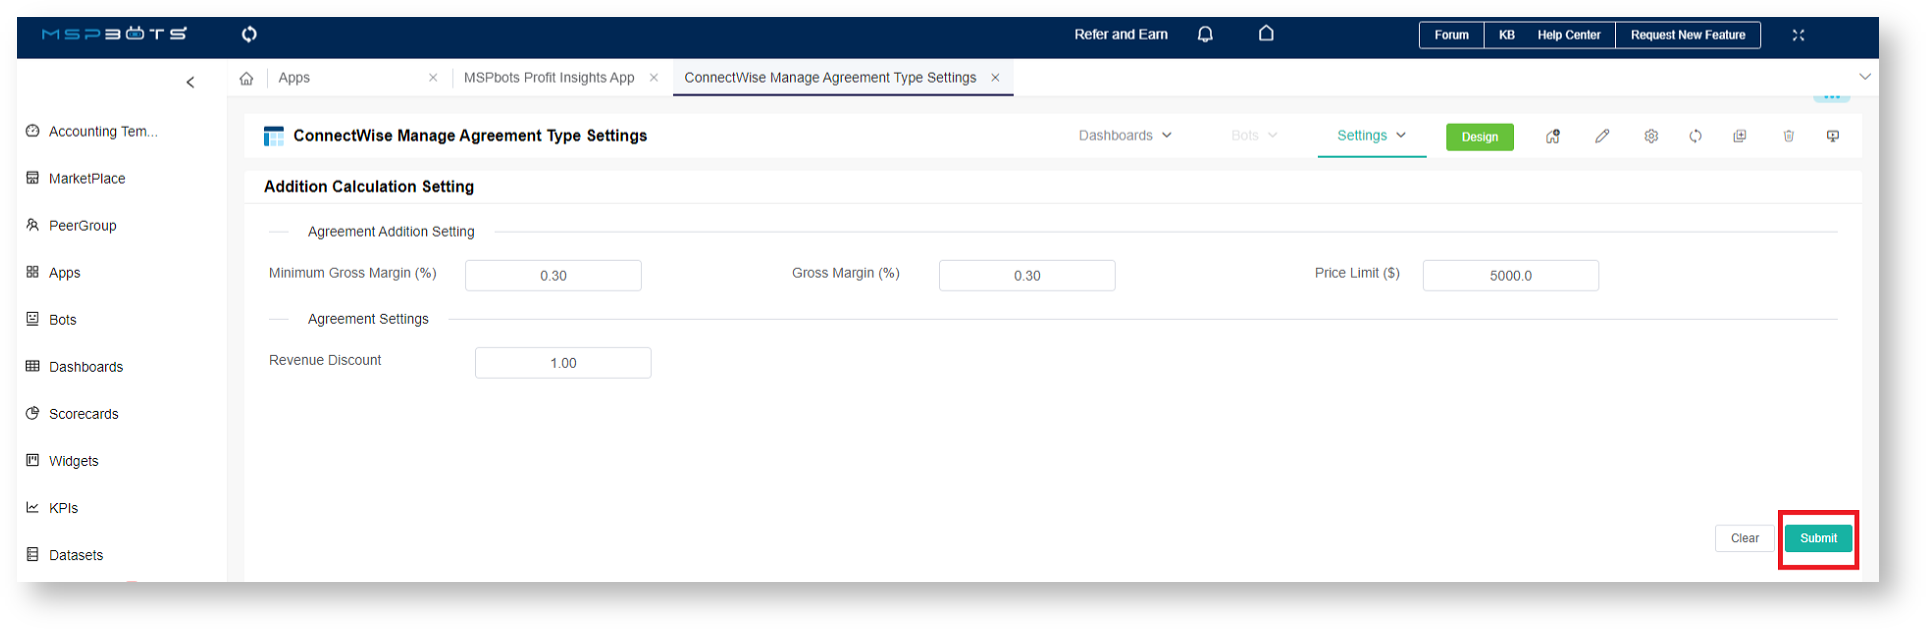
4. Click Submit to save.
Adjusting the Agreement Category Settings
- In the ConnectWise Manage Agreement Type Settings window, go to the Agreement Category Settings section.
- Enter your preferred settings.
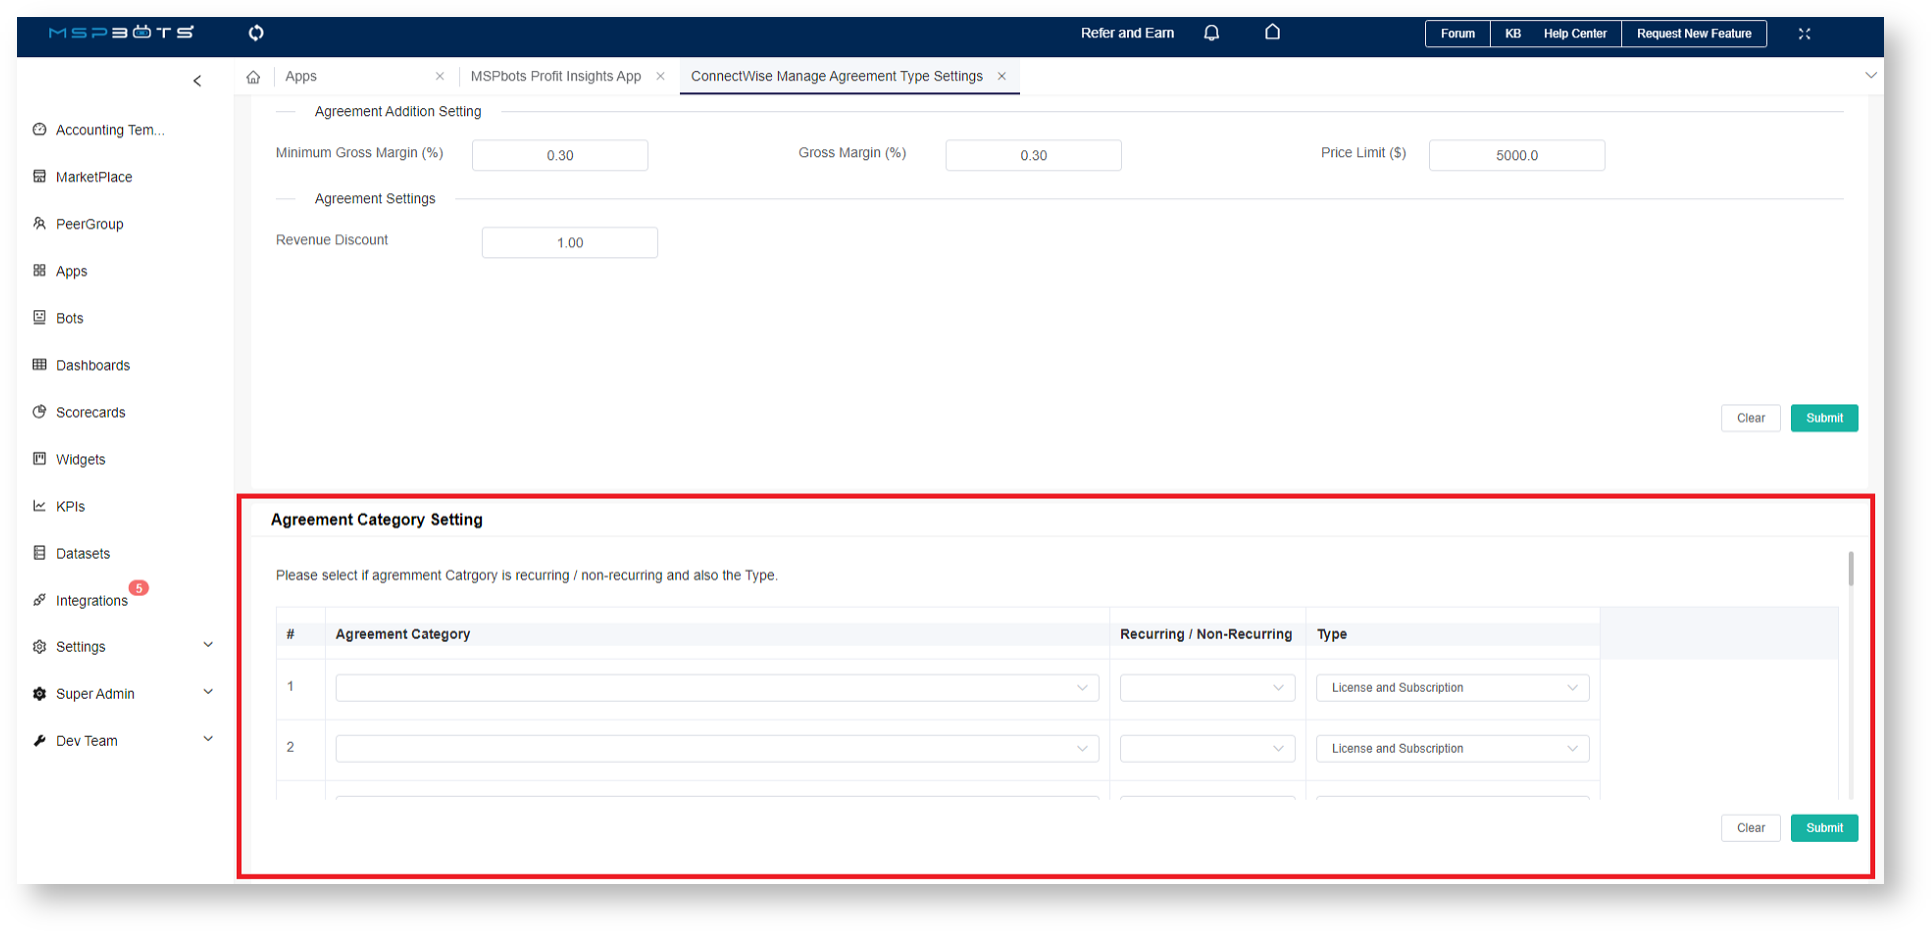
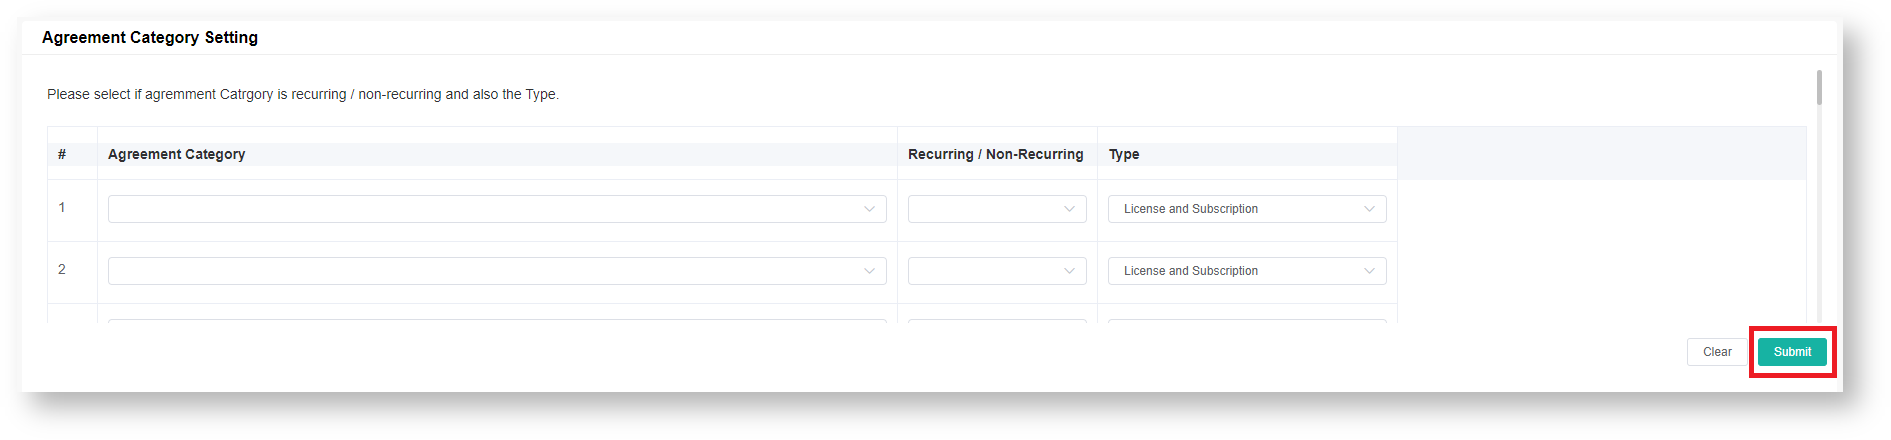
- Click Submit to save.
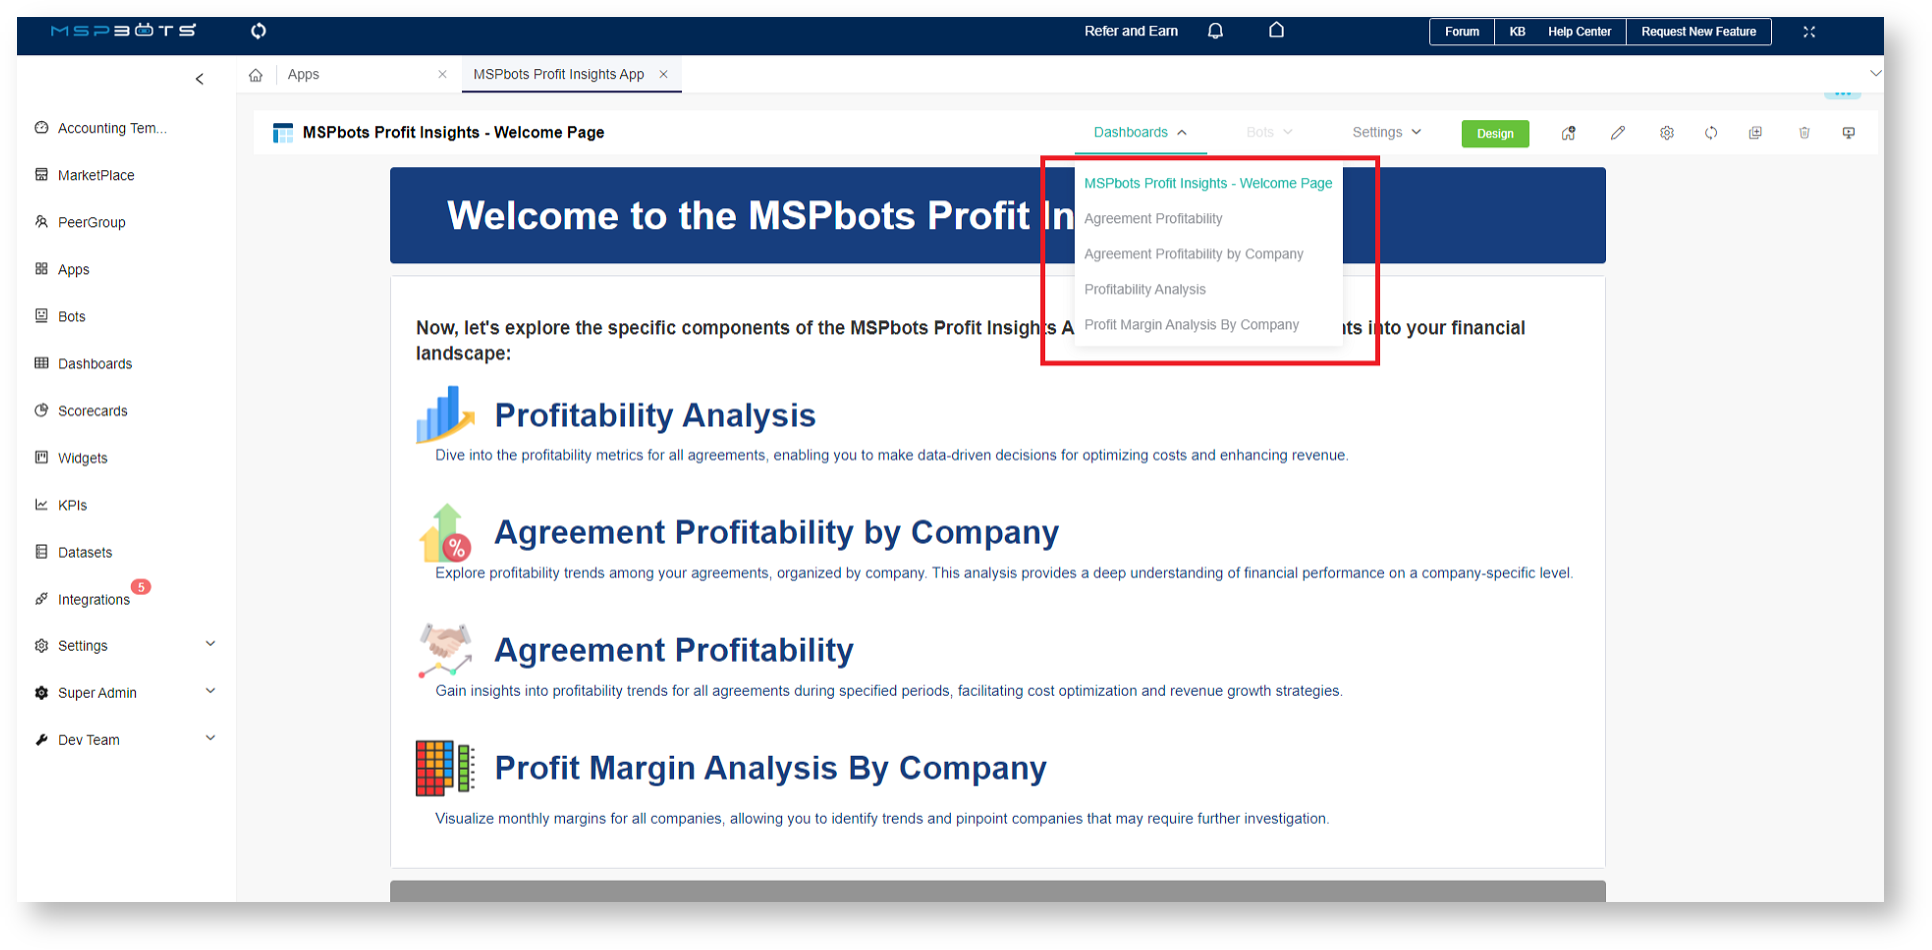
- When done with settings, verify if the values in the dashboards meet your expected results. Click the Dashboards dropdown menu and select a dashboard.
Overview
Content Tools
N O T I C E
MSPbots WIKI is moving to a new home at support.mspbots.ai![]() to give you the best experience in browsing our Knowledge Base resources and addressing your concerns. Click here
to give you the best experience in browsing our Knowledge Base resources and addressing your concerns. Click here![]() for more info!
for more info!