 N O T I C E
MSPbots WIKI is moving to a new home at support.mspbots.ai![]() to give you the best experience in browsing our Knowledge Base resources and addressing your concerns. Click here
to give you the best experience in browsing our Knowledge Base resources and addressing your concerns. Click here![]() for more info!
for more info!
 N O T I C E
MSPbots WIKI is moving to a new home at support.mspbots.ai![]() to give you the best experience in browsing our Knowledge Base resources and addressing your concerns. Click here
to give you the best experience in browsing our Knowledge Base resources and addressing your concerns. Click here![]() for more info!
for more info!
Data integrity, privacy, and security are of utmost importance in every company and organization. If these are compromised, your company can experience extensive and severe effects on various aspects like business disruption, operational inefficiencies, loss of intellectual property, damage to reputation, and massive financial losses, among others. With the Huntress Monitoring Dashboard, your company is response-ready and able to mitigate these effects and protect your organization.
This dashboard is available to users of Huntress, a managed security platform that specializes in endpoint threat detection and response.
What's in this article:
What is the Huntress Monitoring Dashboard?
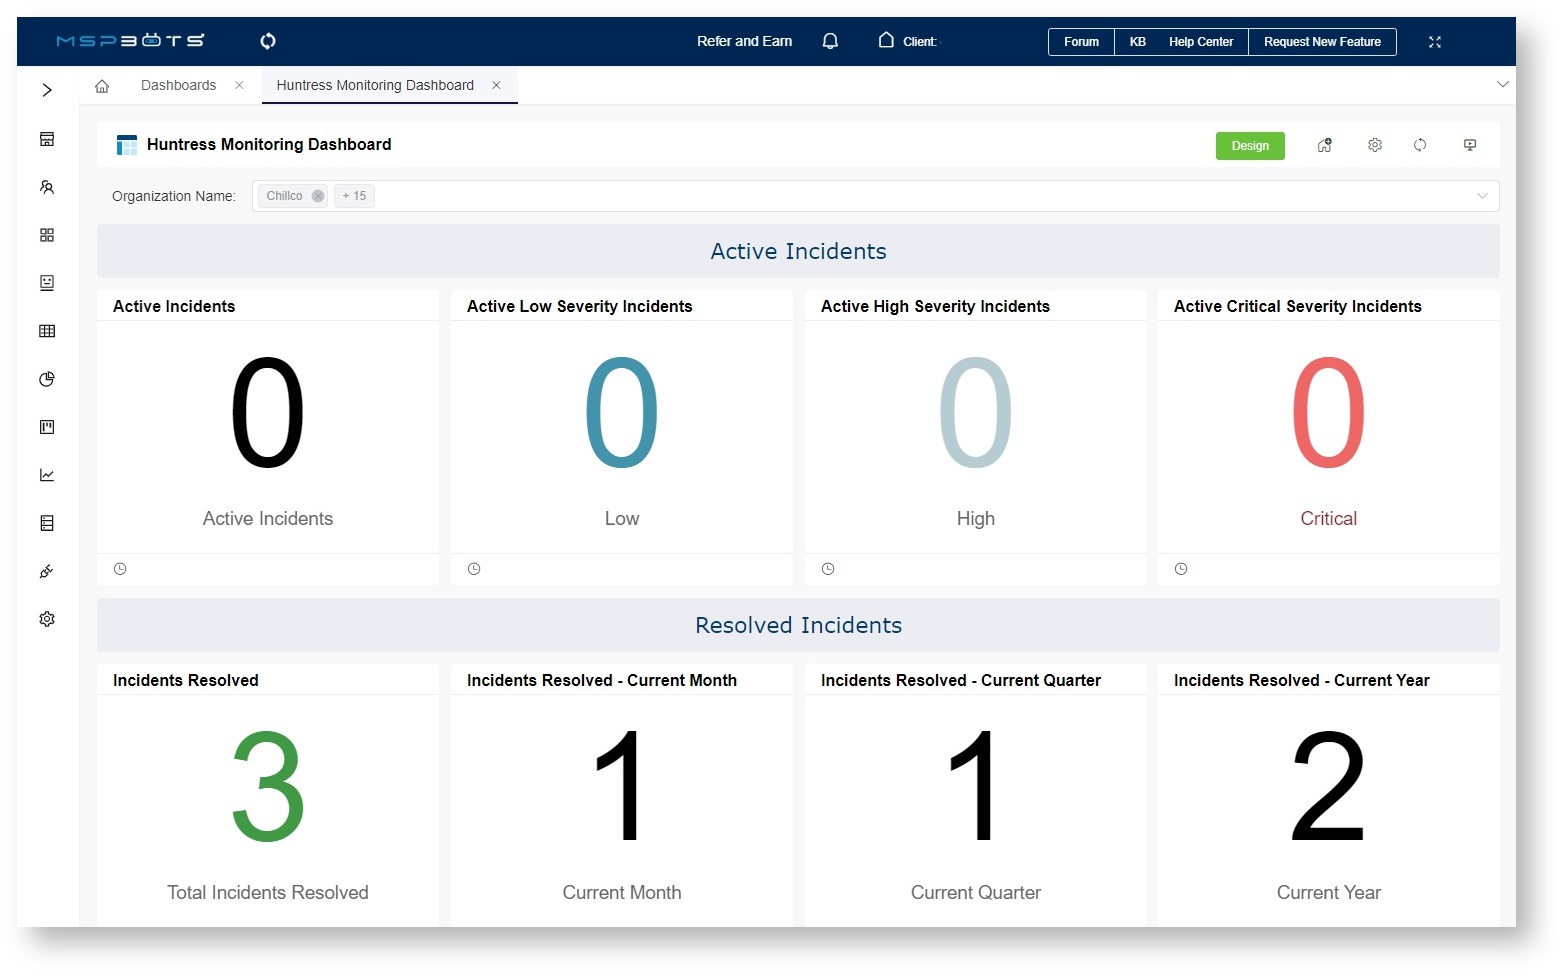
The Huntress Monitoring Dashboard highlights security incidents as they are detected among your teams or clients. It shows the status of agents, counts the active and resolved incidents, and flags critical incidents for quick response and action-taking. You can filter the dashboard data with the Organization Name slicer.
What are the widgets in the dashboard?
A security incident is any event or situation wherein there is an attempted or actual unauthorized access, use, disclosure, modification, or destruction of information. The widgets in the Huntress Monorotring Dashboard groups detected incidents in the following sections:
- Active Incidents - These incidents are currently in progress or have recently been detected and are actively being addressed by the organization's security team. Active incidents require immediate attention and response.
- Active Incidents - This widget shows the total number of active incidents encountered.
- Active Low Severity Incidents - This widget shows the number of incidents with minimal impact on the organization's operations or security. Examples are low-risk spam emails, minor website defacement, and isolated incidents of unauthorized access with no sensitive data exposure.
- Active High Severity Incidents - This widget shows high-severity incidents that have serious, substantial impacts on business operations and may lead to moderate financial losses. While they are significant, they may not immediately threaten the overall stability or survival of the organization. They require prompt action and response to prevent further escalation and minimize damage.
- Active Critical Incidents - This widget shows the number of incidents that have a catastrophic impact on the organization's operations and security. These require immediate action because they pose a substantial threat to data, systems, or services. Examples are major data breaches, advanced persistent cyberattacks, full network outages, unauthorized access to sensitive data, severe and malware infection with widespread impact.
- Resolved Incidents - These incidents were detected at a given time but have already been resolved by the security team.
- Incidents Resolved - This is the total number of resolved incidents encountered.
- Incidents Resolved - Current Month
- Incidents Resolved - Current Quarter
- Incidents Resolved - Current Year
- Agent Status - This section of the dashboard shows the number of agents being monitored and their status.
- Total Agents - This widget shows the total number of agents being monitored in the dashboard.
- Outdated Agents - This widget shows the number of agents with outdated machines or software who are thus vulnerable to incidents.
- Reported Footholds and Other Indicators - This widget shows the number of virtual spots that the attacker has secured in an environment or machine. These footholds allow the attacker to maintain access through system disruptions.
