 N O T I C E
MSPbots WIKI is moving to a new home at support.mspbots.ai![]() to give you the best experience in browsing our Knowledge Base resources and addressing your concerns. Click here
to give you the best experience in browsing our Knowledge Base resources and addressing your concerns. Click here![]() for more info!
for more info!
N O T I C E
MSPbots WIKI is moving to a new home at support.mspbots.ai![]() to give you the best experience in browsing our Knowledge Base resources and addressing your concerns. Click here
to give you the best experience in browsing our Knowledge Base resources and addressing your concerns. Click here![]() for more info!
for more info!
Encore Strategic Financial Benchmark
The 17 Encore Strategic Financial Benchmark metric calculations provide insight into a company's Financial KPIs. These metrics calculations provide the quarterly and monthly overall profitability, and the employees' contribution over revenue and net operating income by using data derived from Expenses, Revenue, and Employee count.
Product Margin %
A column chart showing Product Margin percentages by quarter and monthly layout of the selected range.
Product Margin is product revenue minus product cost of goods sold(COGS) expressed as a percentage of product revenue.
Calculation: (Product Sales - Product COGS)/ Product Sales
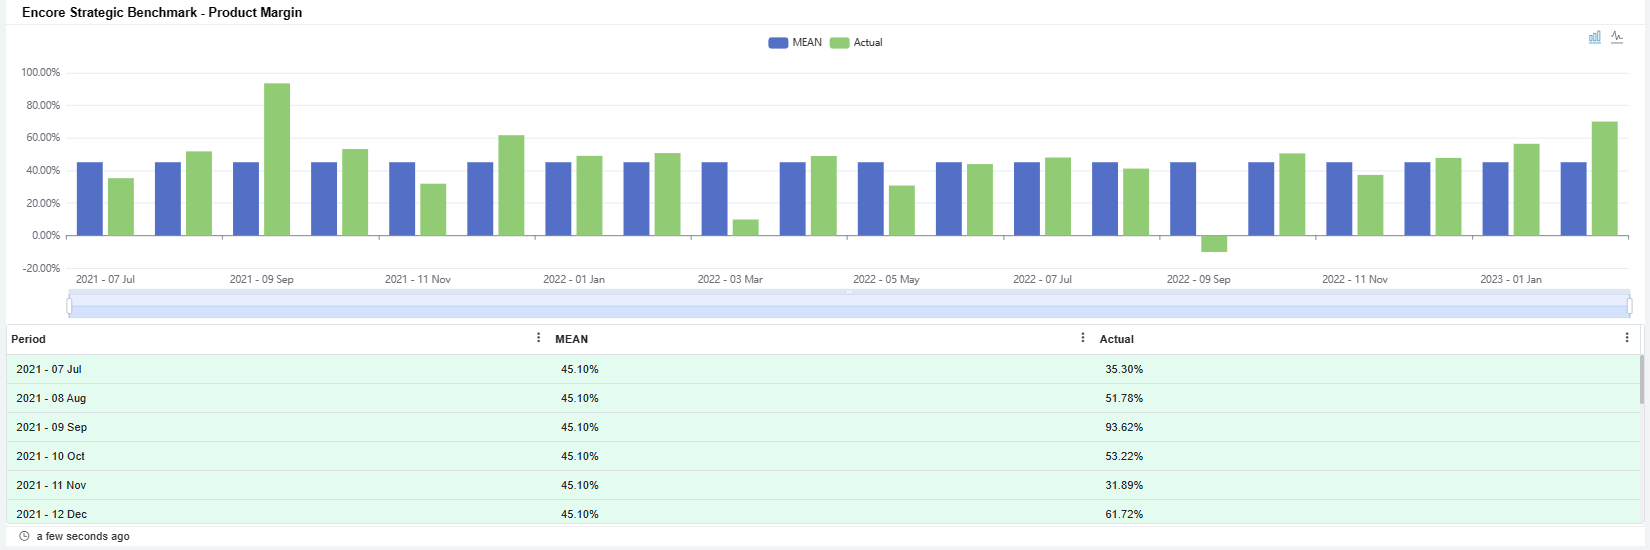
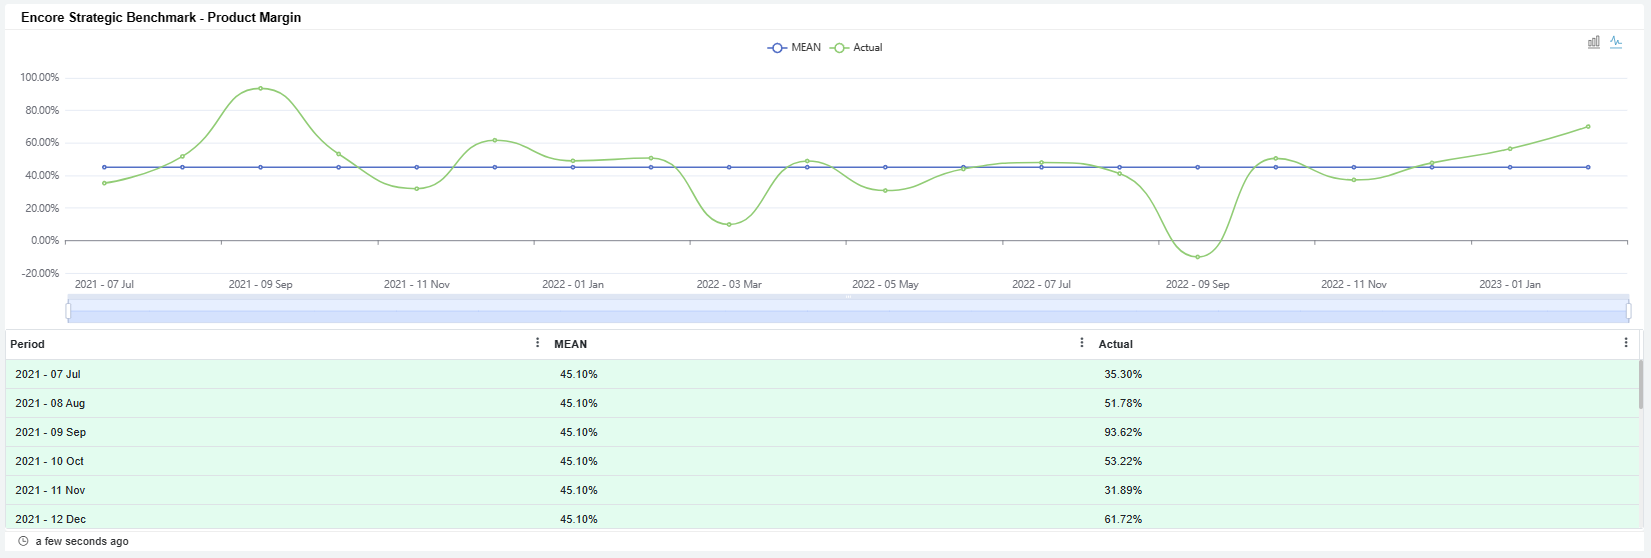
Data Source: Encore mapping
Percent of Services to Total Revenue
A column chart showing the Percent of Services to Total Revenue frequency by quarter and monthly layout of the selected range.
Percent of Services to Total Revenue is Total Service Revenue expressed as percentage of Total Revenue.
Calculation: Service Revenue / Total Revenue
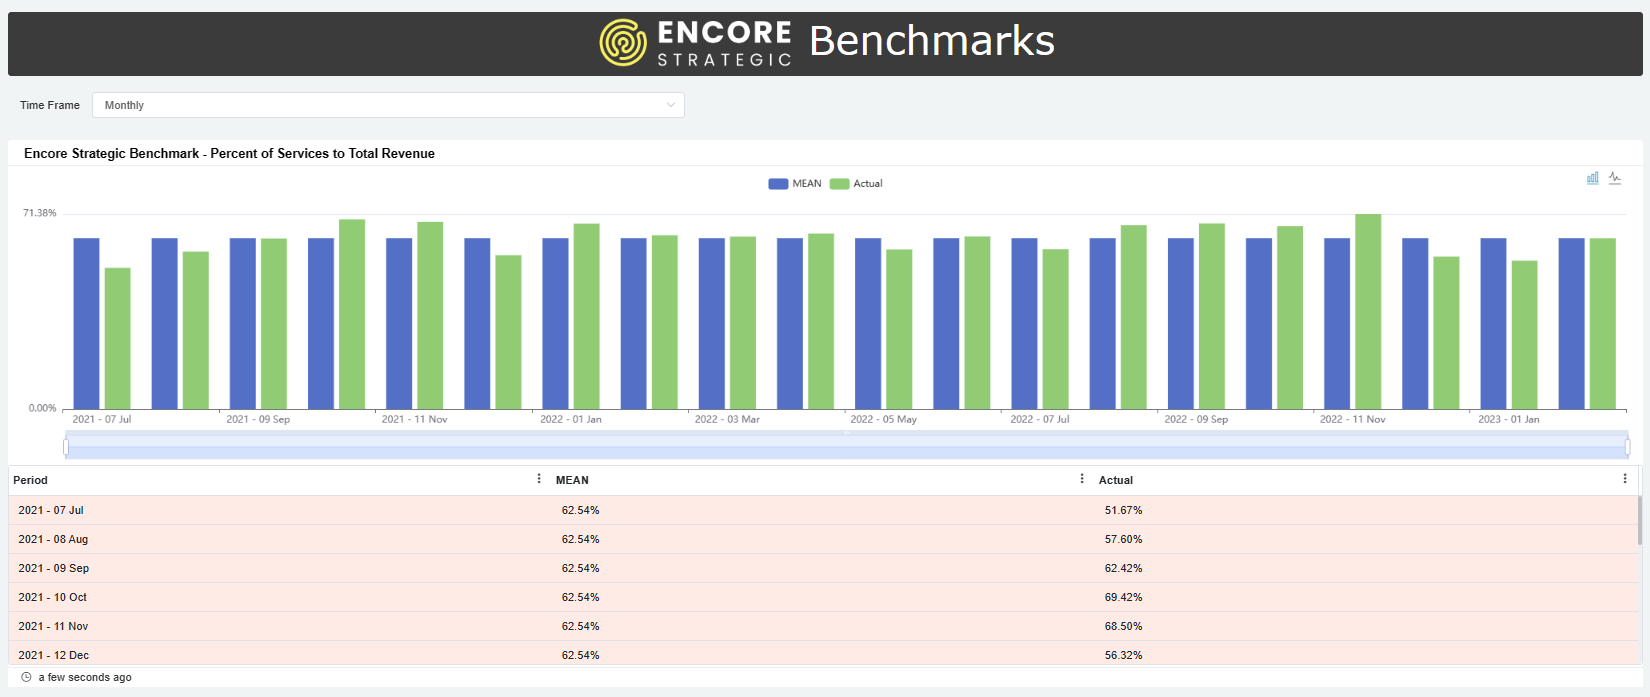
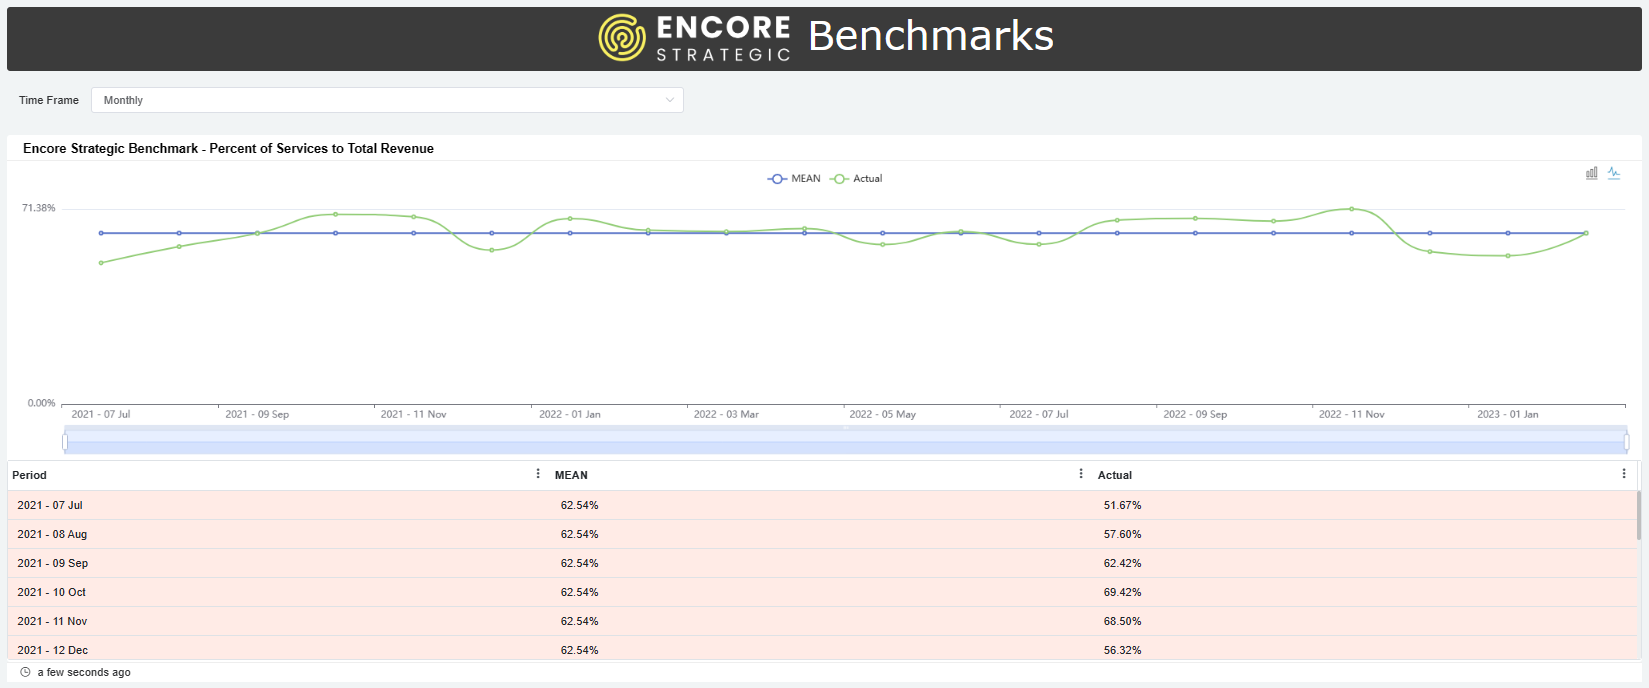
Data Source: Encore mapping
Service Gross Profit Margin
A column chart showing Service Gross Profit Margin percentages by quarter and monthly layout of the selected range.
Service Gross Profit Margin is service revenue minus service cost of goods sold(COGS) expressed as a percentage of service revenue.
Calculation: (Service Revenue - Service COGS) / Service Revenue
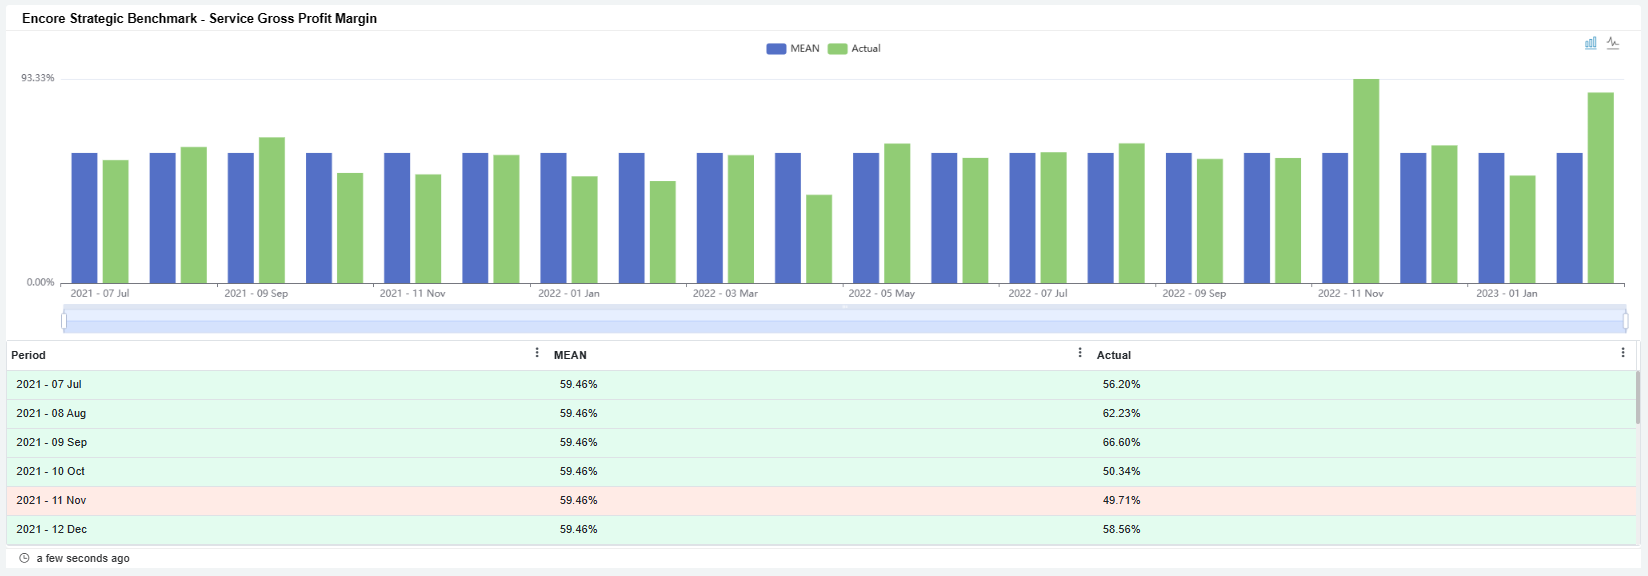
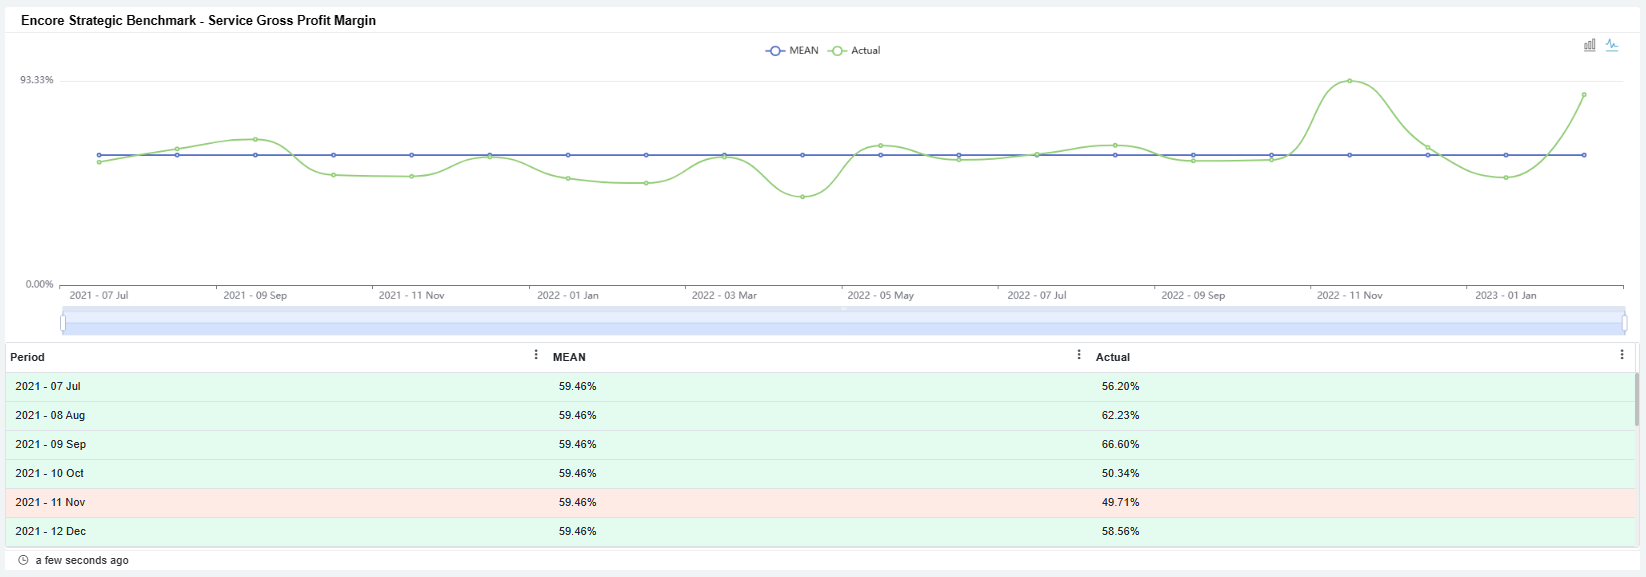
Data Source: Encore mapping
Percent of Recurring Revenues to Total Service Revenue
A column chart showing the Percent of Recurring Revenues to Total Service Revenue frequency by quarter and monthly layout of the selected range.
Percent of Recurring Revenues to Total Service Revenue is Recurring Service Revenue expressed as a percentage of Total Service Revenue.
Calculation: Recurring Service Revenue/ Total Service Revenue
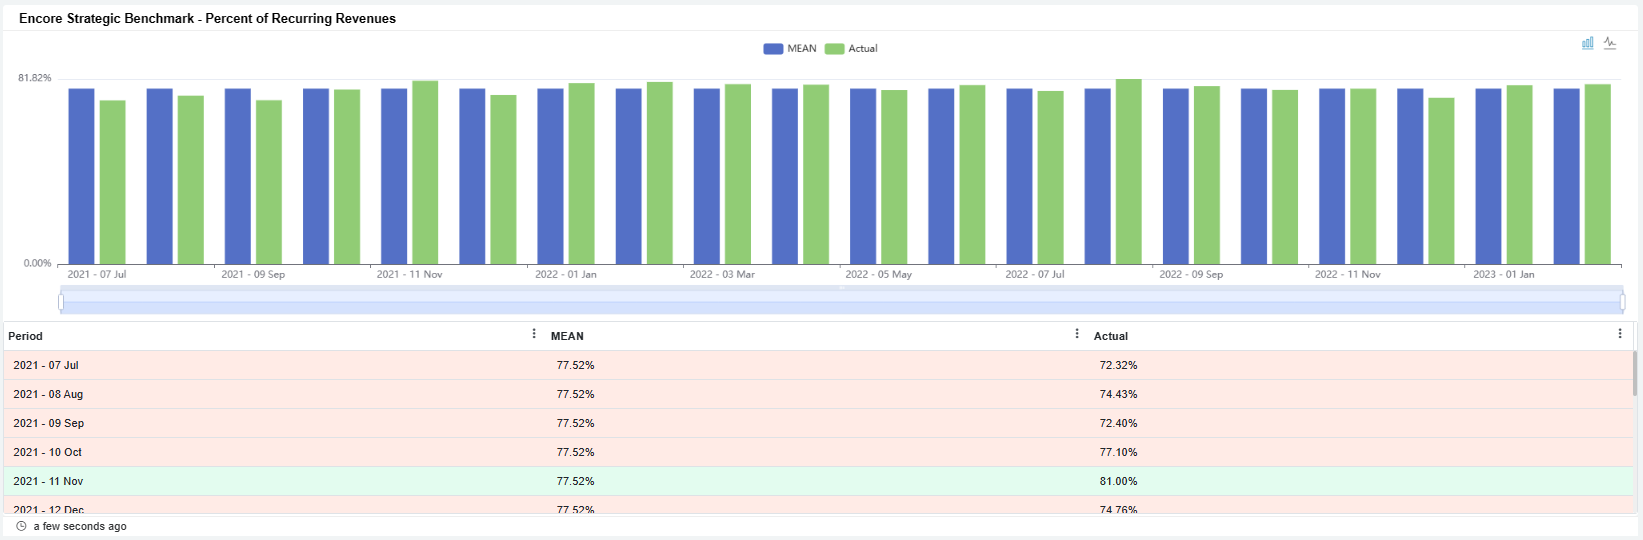
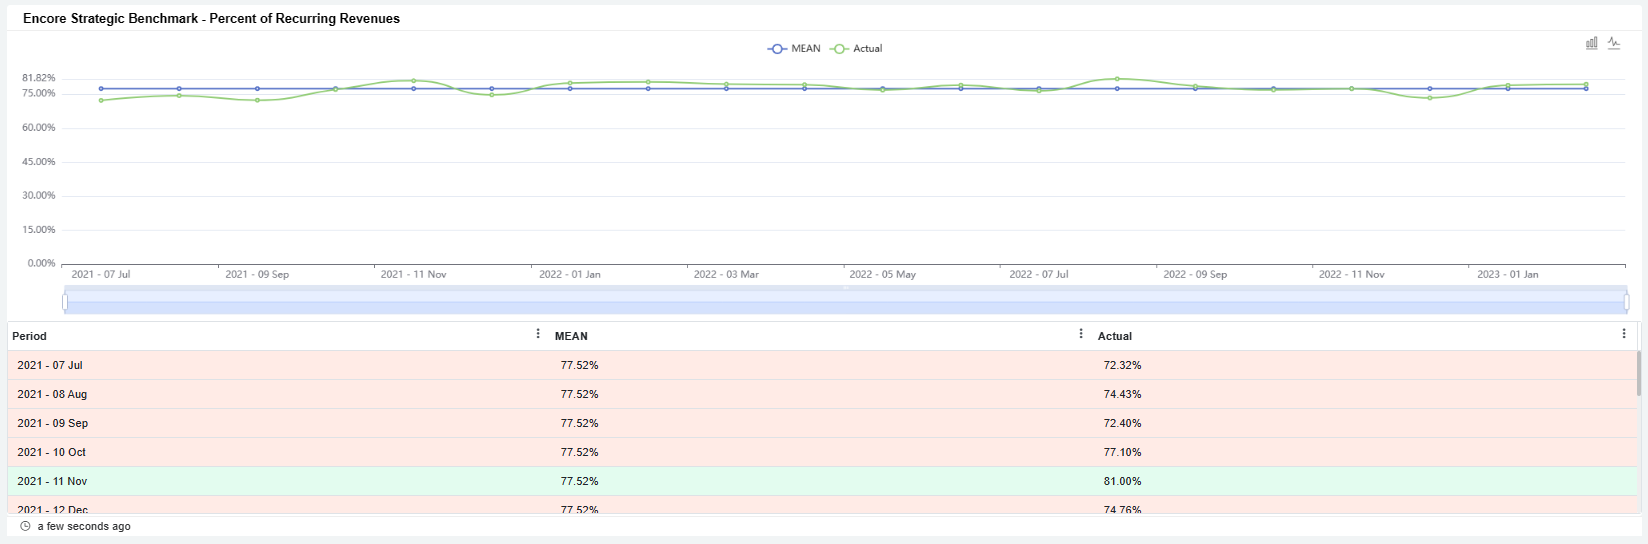
Data Source: Encore mapping
Percent of Project and Installation Revenue to Total Service revenue
A column chart showing Percent of Project and Installation Revenue to Total Service revenue frequency by quarter and monthly layout of the selected range.
Percent of Project and Installation Revenue to Total Service revenue is Project and Installation Revenue expressed as a percentage of Total Service Revenue.
Calculation: Project Revenue / Total Service Revenue
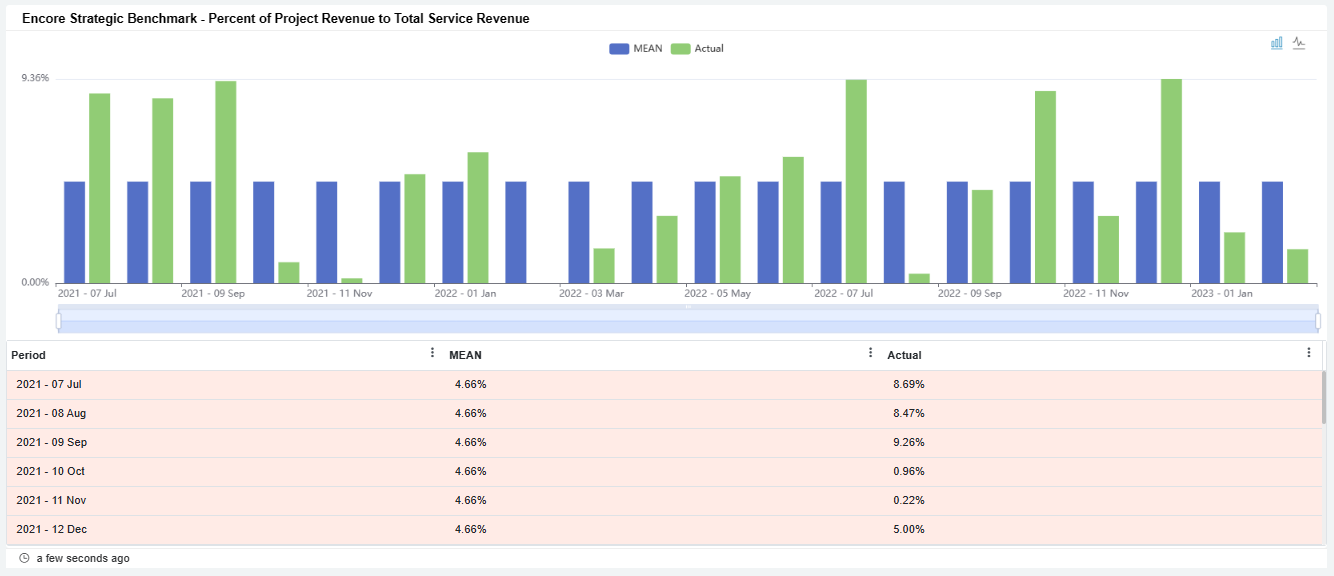
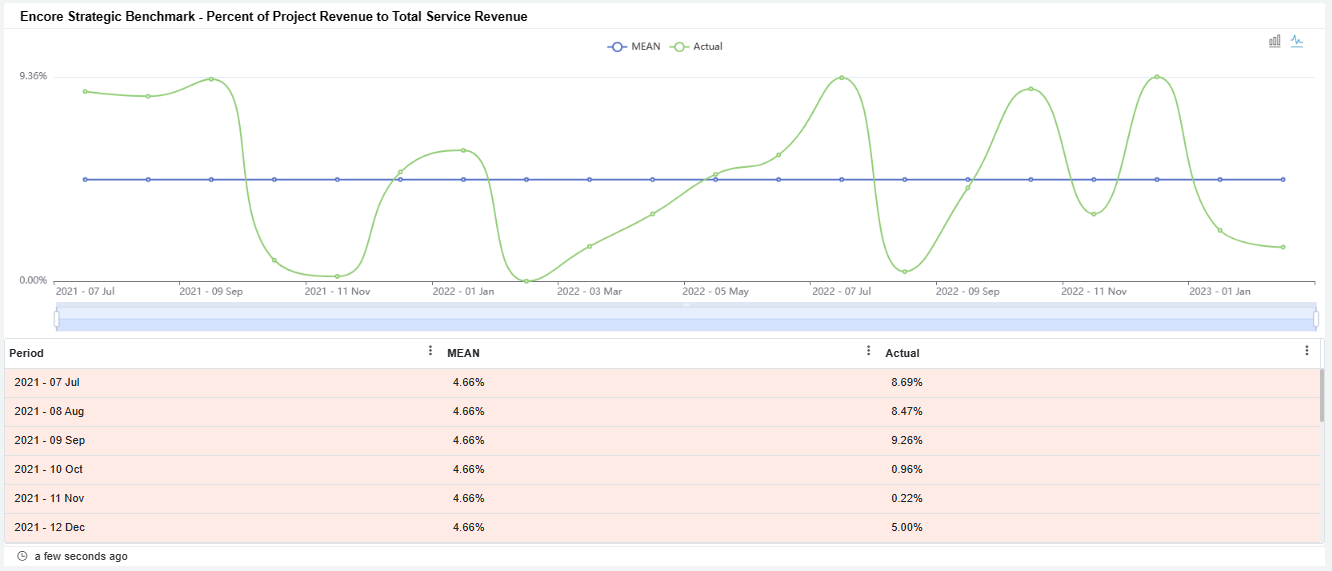
Data Source: Encore mapping
Percentage of Other Non-Recurring Revenue to Total Service revenue
A column chart showing Percentage of Other Non-Recurring Revenue to Total Service revenue frequency by quarter and monthly layout of the selected range.
Percentage of Other Non-Recurring Revenue to Total Service revenue is Other Non-Recurring Revenue expressed as a percentage of Total Service Revenue.
Calculation: Other Non-Recurring Revenue/ Total Service Revenue
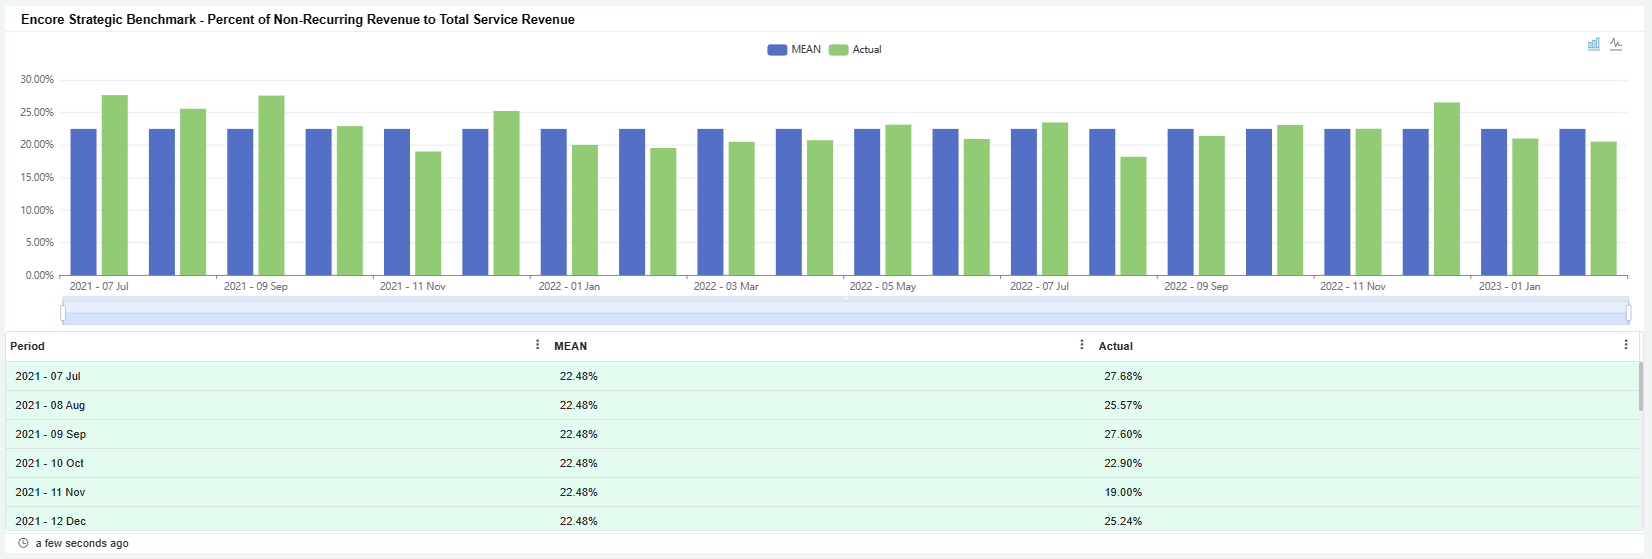
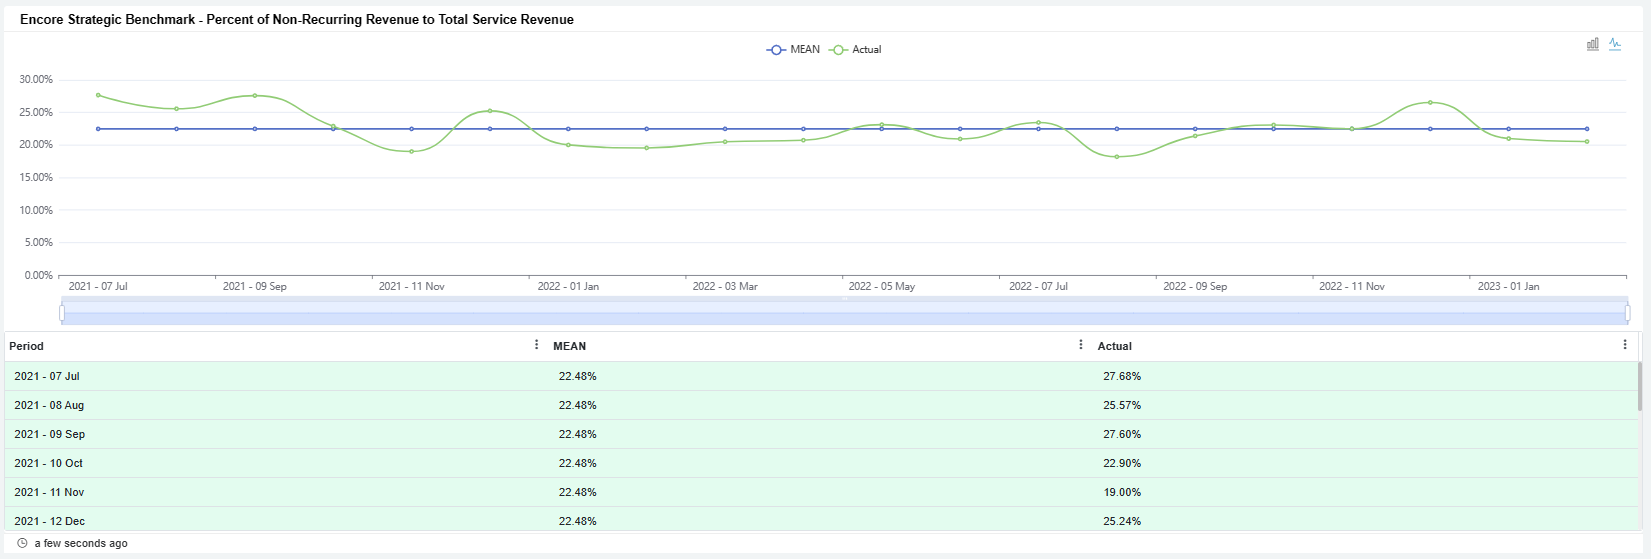
Data Source: Encore mapping
Percent of Service Salaries to Service Revenue
A column chart showing Percent of Service Salaries to Service Revenue frequency by quarter and monthly layout of the selected range.
Percent of Service Salaries to Service Revenue is Service Salaries expressed as a percentage of Total Service Revenue.
Calculation: Technician Salaries/ Service Revenue
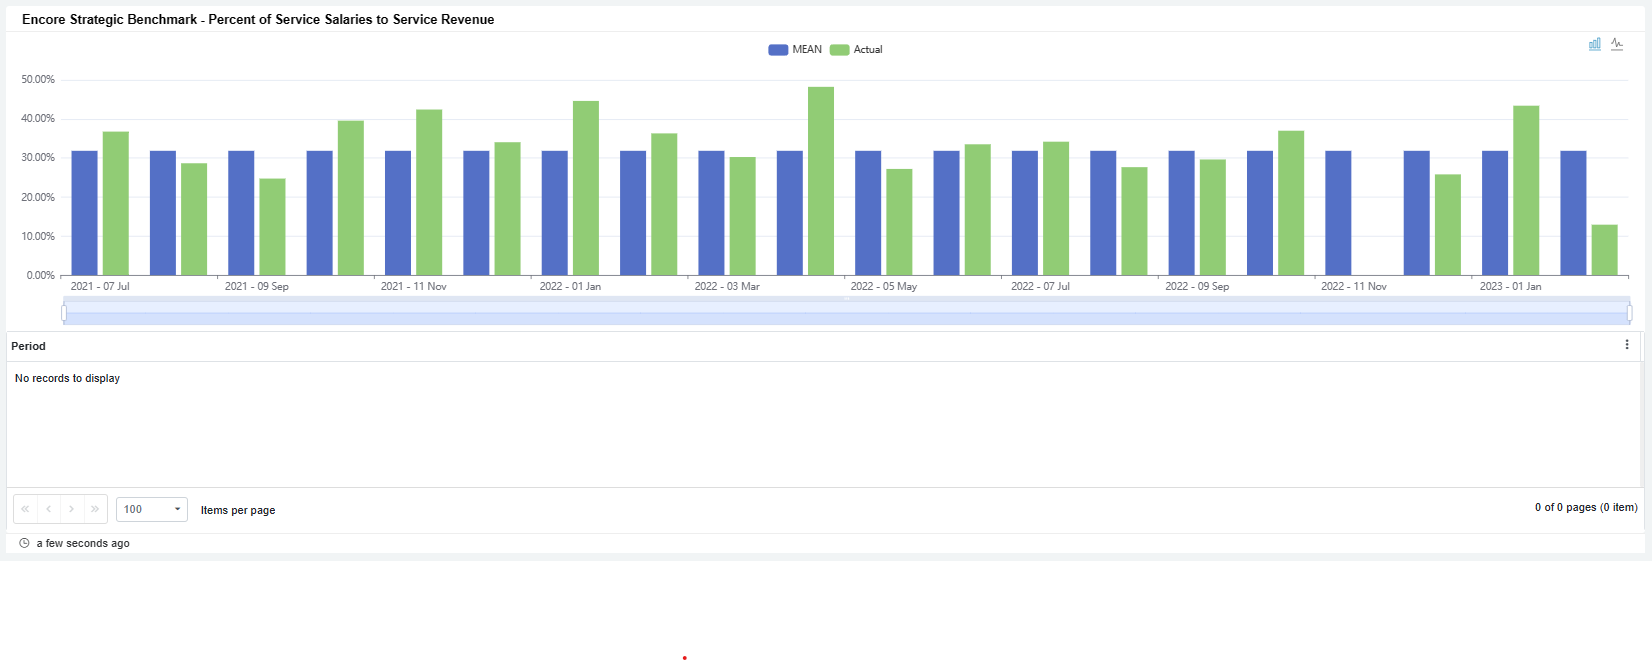
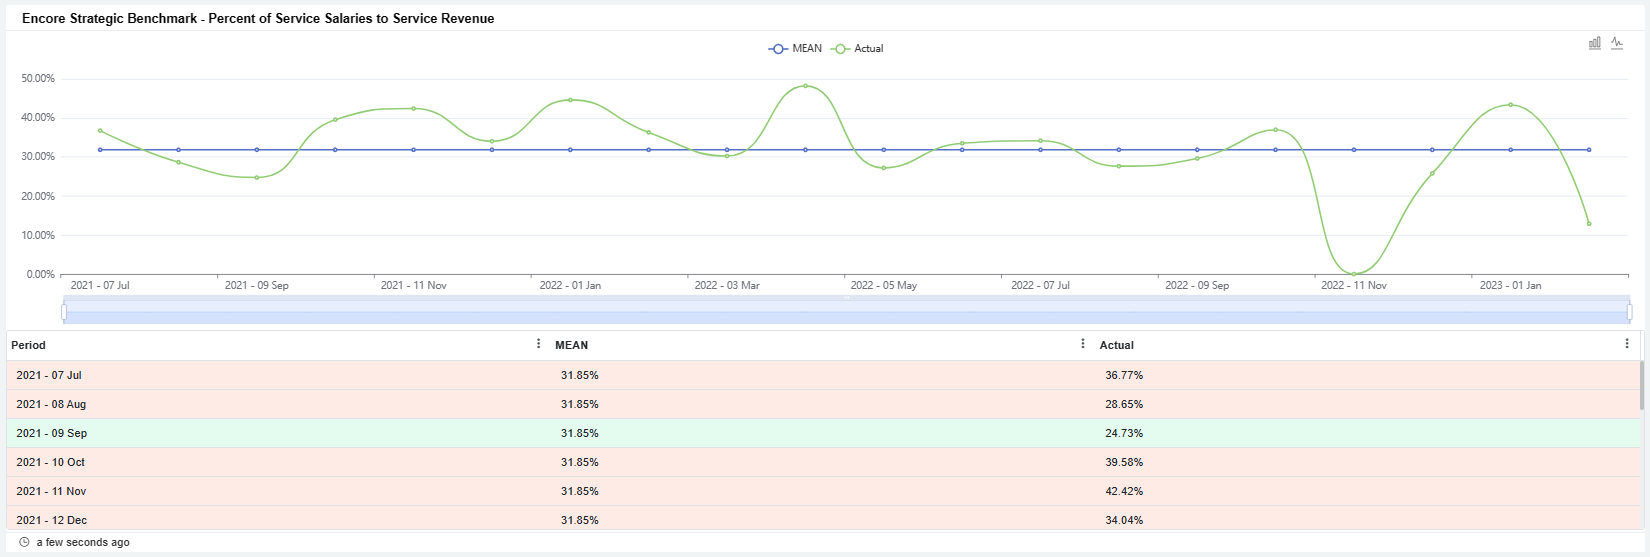
Data Source: Encore mapping
Sales Salaries and Commissions as a Percentage of Revenue
A column chart showing Sales Salaries and Commissions as a Percentage of Revenue frequency by quarter and monthly layout of the selected range.
Sales Salaries and Commissions as a Percentage of Revenue are Sales salaries plus commission expressed as a percentage of Total Revenue.
Calculation: (Salaries + Commissions)/ Total Revenue
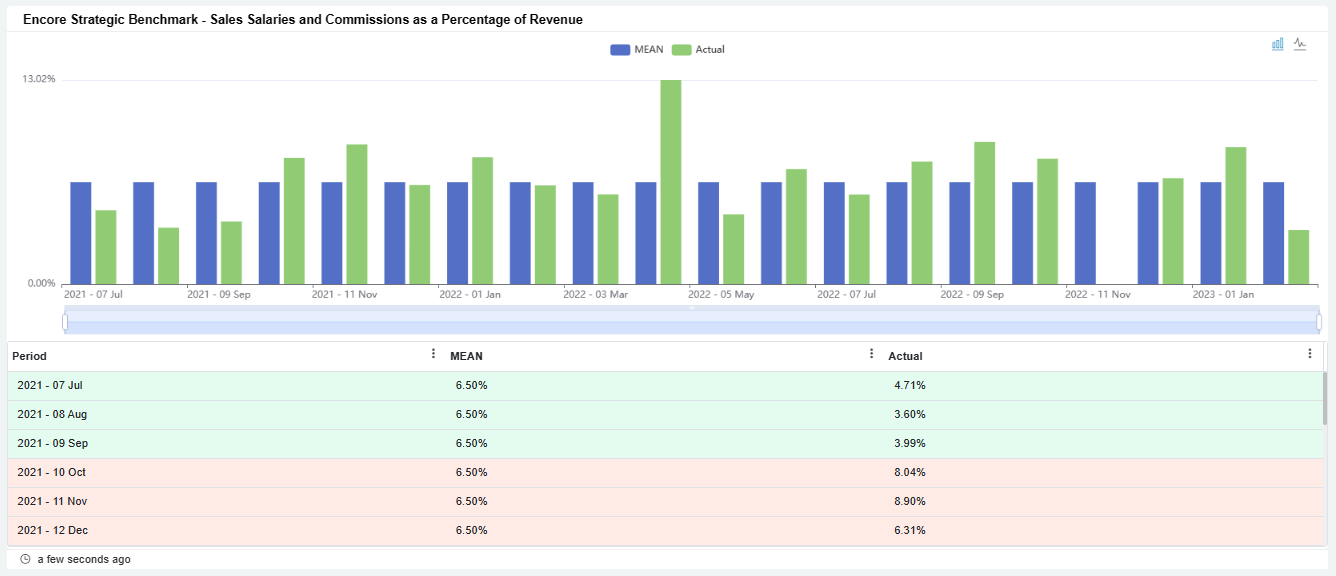
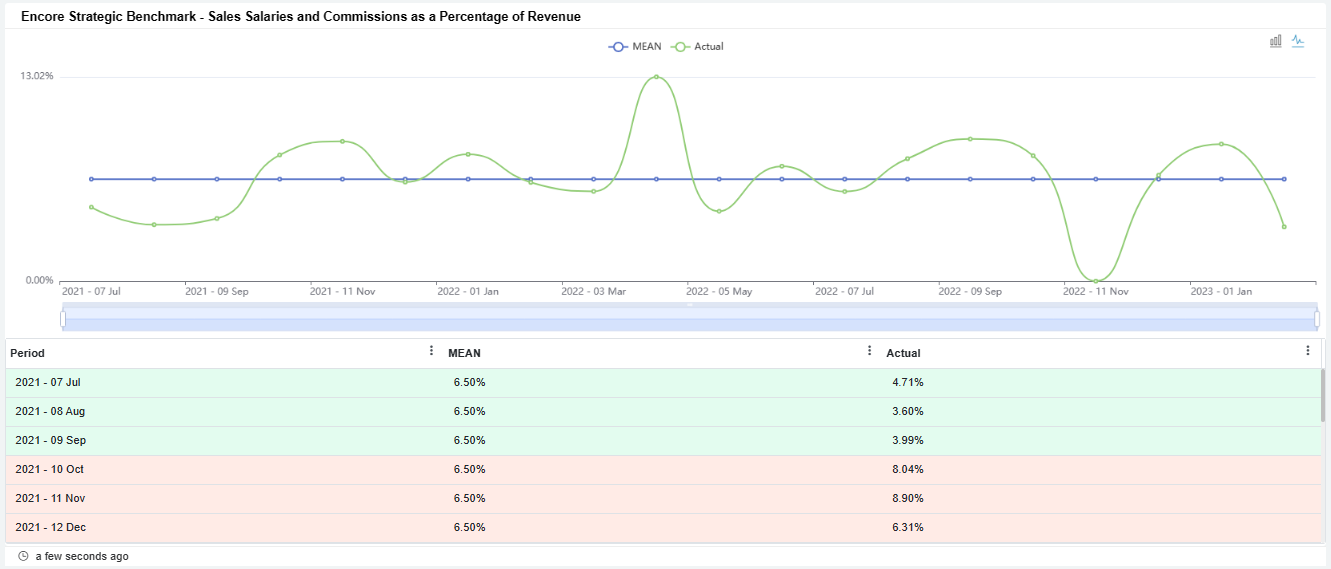
Data Source: Encore mapping
Advertising and Marketing as a Percentage of Revenue
A column chart showing Advertising and Marketing as a Percentage of Revenue frequency by quarter and a monthly layout of the selected range.
Advertising and Marketing as a Percentage of Revenue is advertising expense plus marketing expense expressed as a percentage of Total Revenue
Calculation: (Advertising + Marketing) / Total Revenue
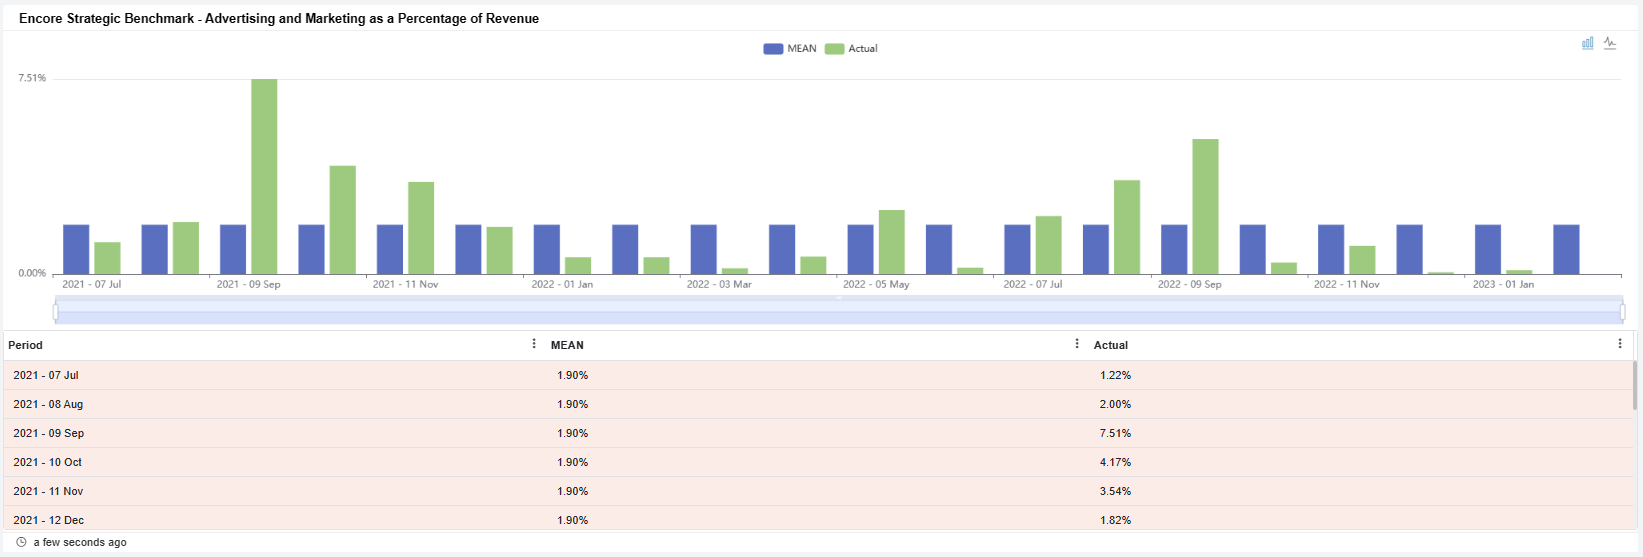
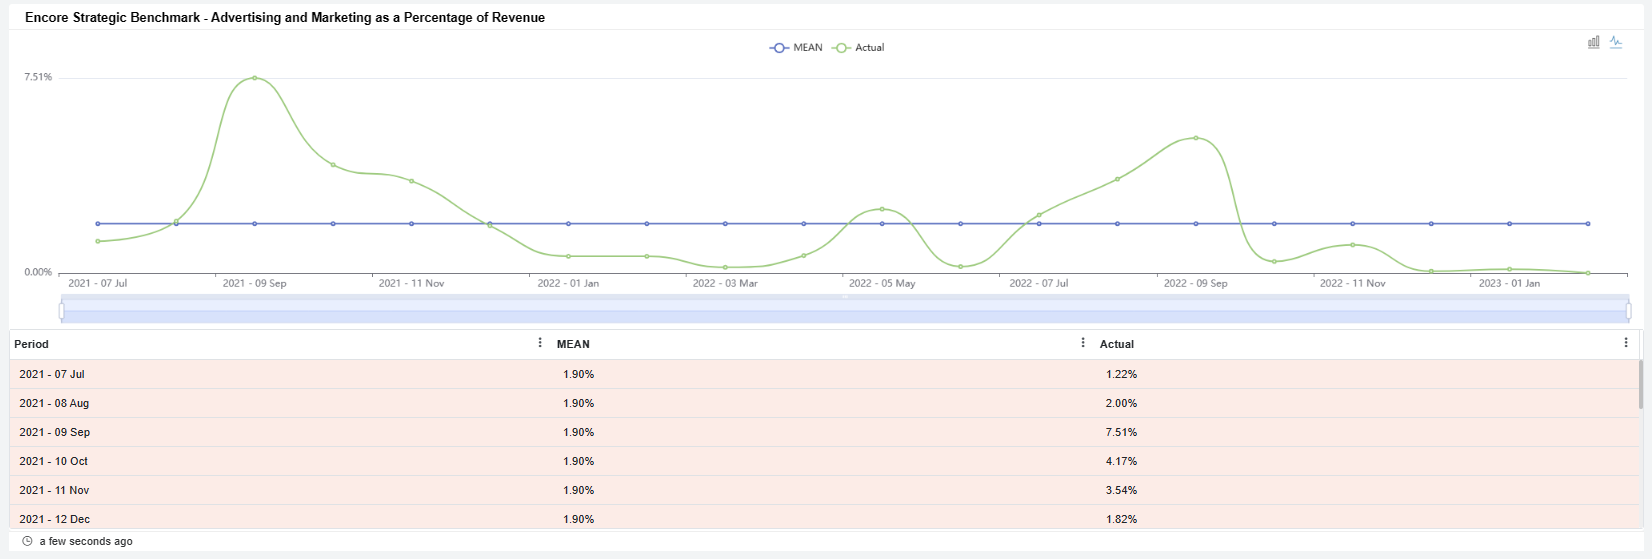
Data Source: Encore mapping
Admin as a Percentage of Revenue
A column chart showing Admin as a Percentage of Revenue frequency by quarter and monthly layout of the selected range.
Admin as a Percentage of Revenue is Admin Expenses expressed as a percentage of Total Revenue
Calculation: Total Admin Expenses / Total Revenue
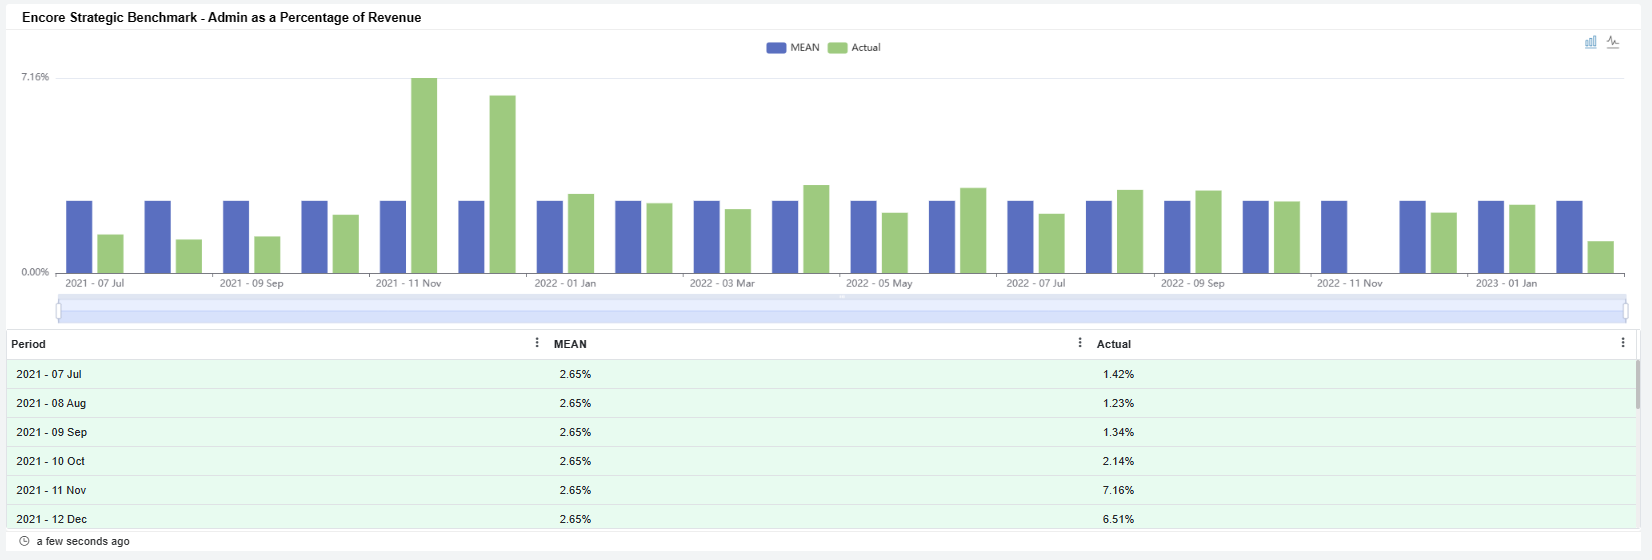
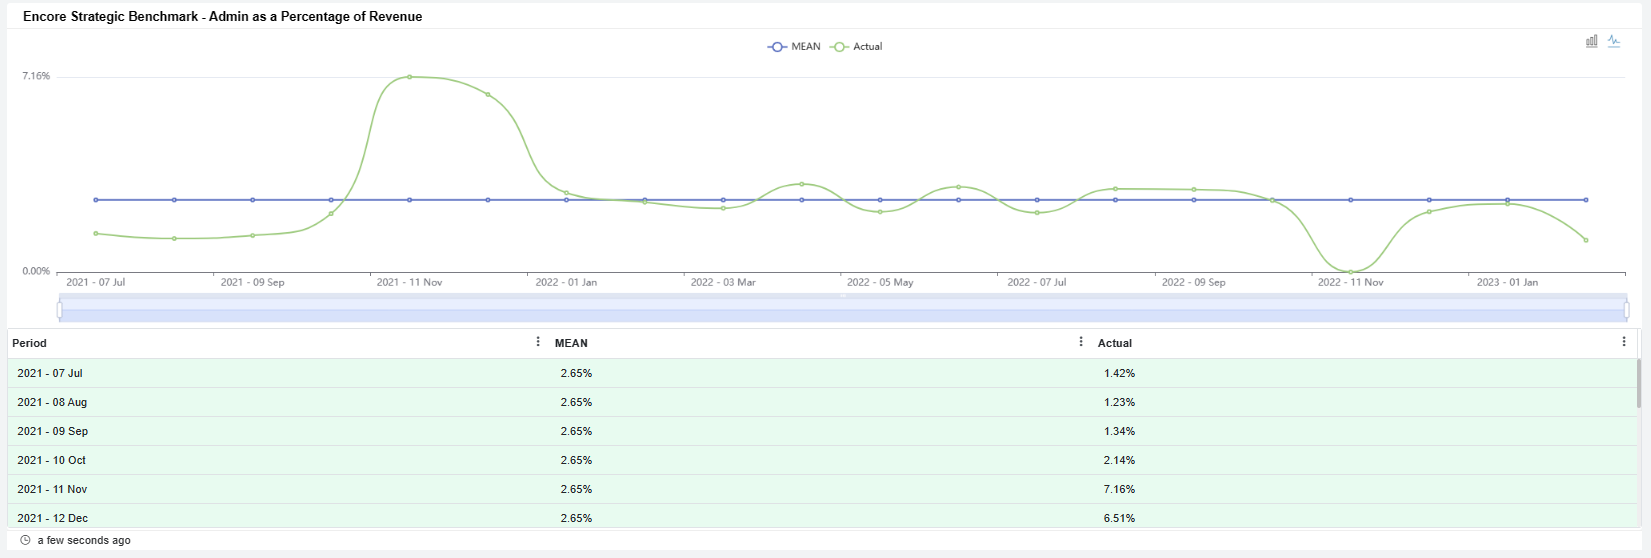
Data Source: Encore mapping
Gross Profit after sales expense
A column chart showing Gross Profit after sales expense frequency by quarter and monthly layout of the selected range.
Gross Profit after sales expense is Total Revenue less Total Cost of goods sold minus sales expenses.
Calculation: (Total Revenue - COGS) - Sales Expenses
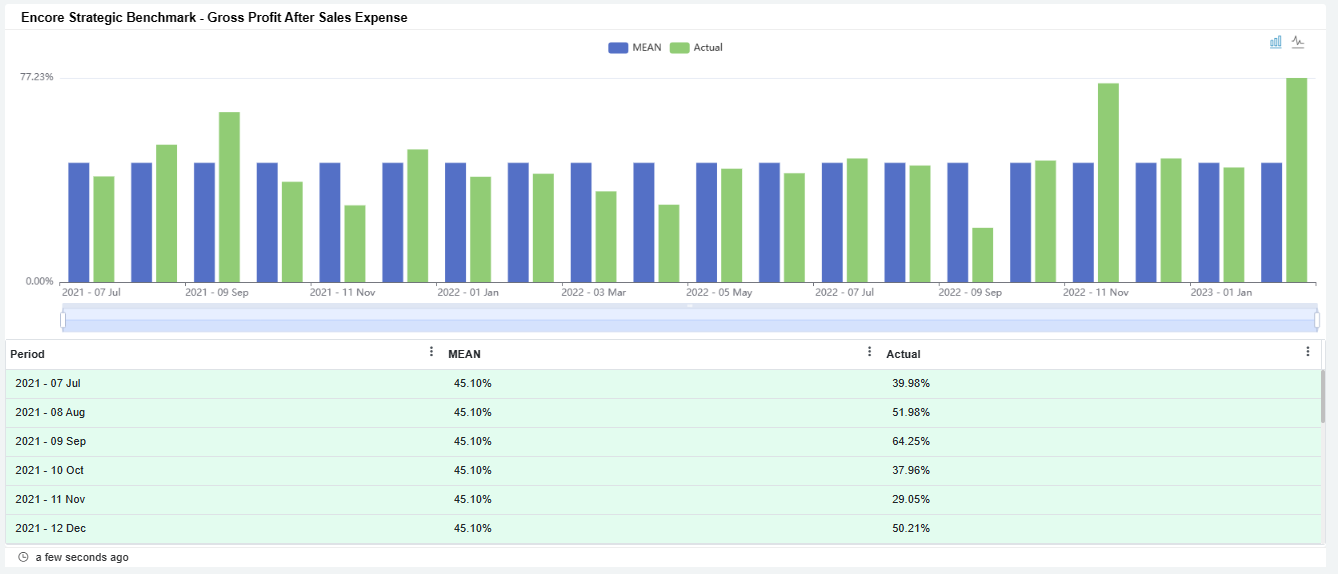
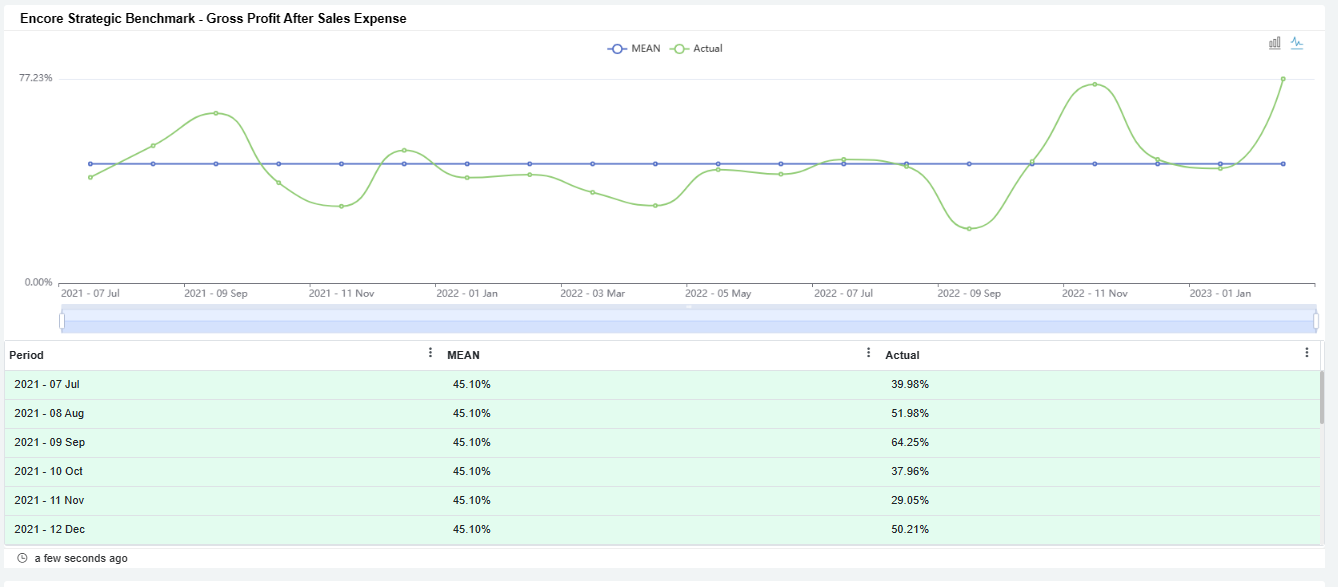
Data Source: Encore mapping
Service Revenue per Service Person
A column chart showing Service Revenue per Service Person frequency by quarter and monthly layout of the selected range.
Service Revenue per Service Person is a ratio that roughly measures service revenue generated by each service person.
Calculation: Service Revenue / Service Person Count
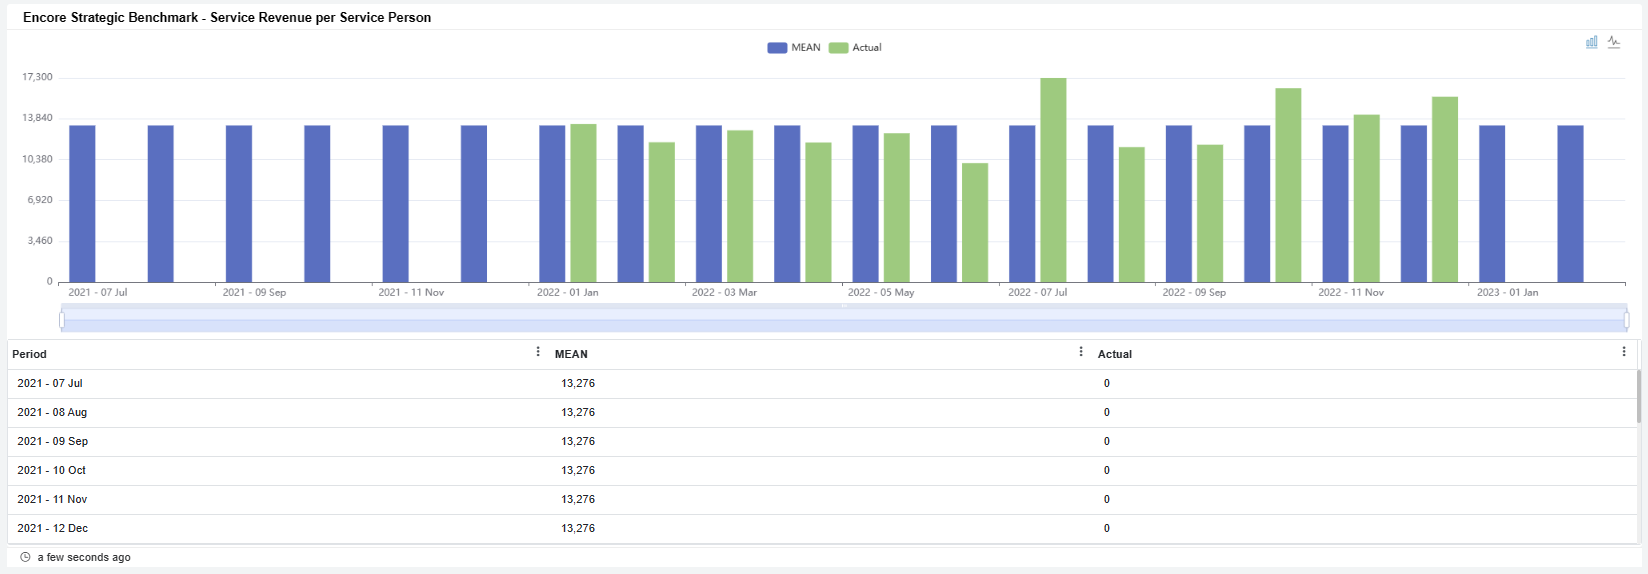
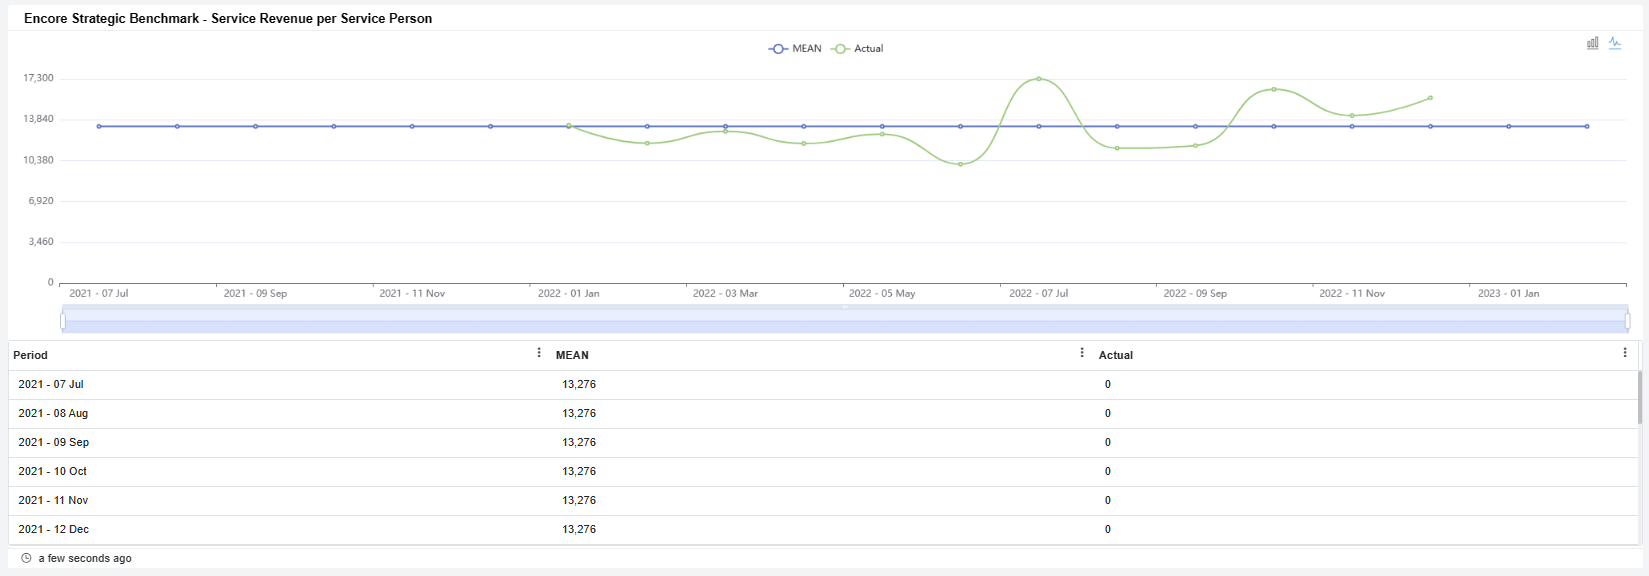
Data Source: Encore mapping for Service Revenue and Encore Settings for Service Person Count
Revenue per Employee
A column chart showing Revenue per Employee frequency by quarter and monthly layout of the selected range.
Revenue per Employee is a ratio that roughly measures revenue generated by each employee.
Calculation: Revenue / Employee Count
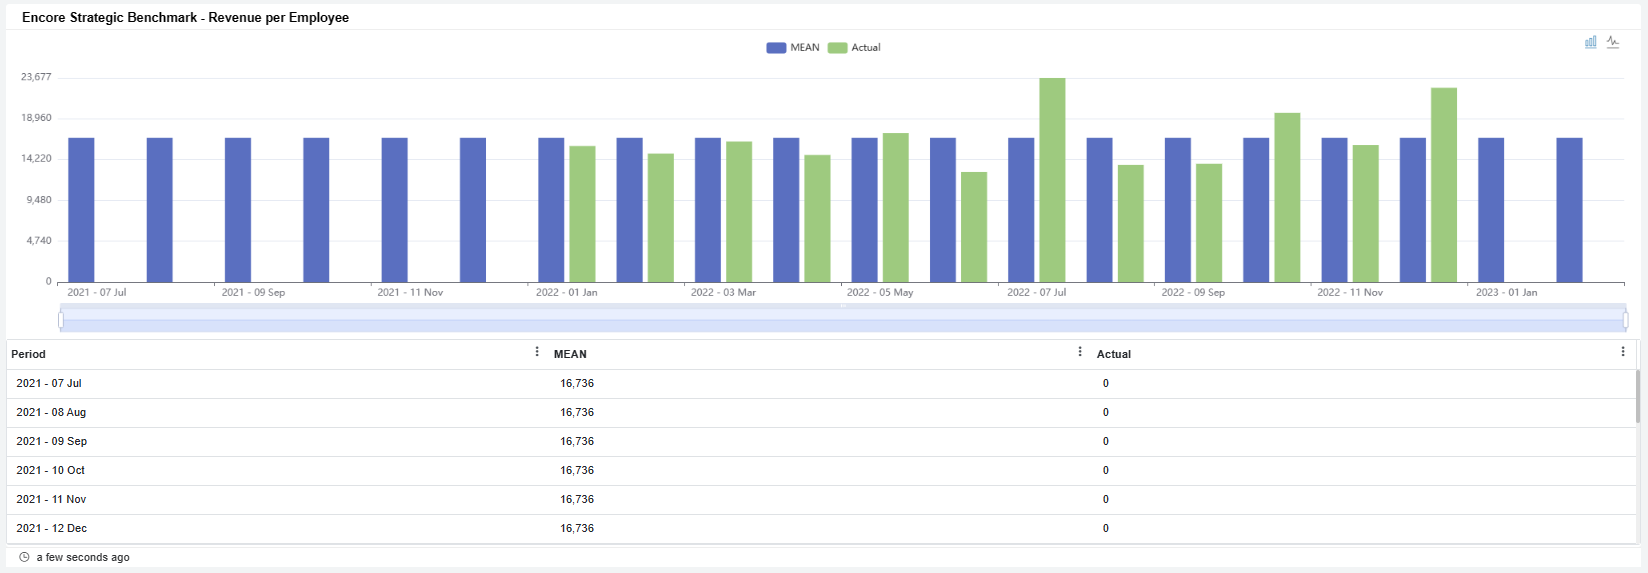
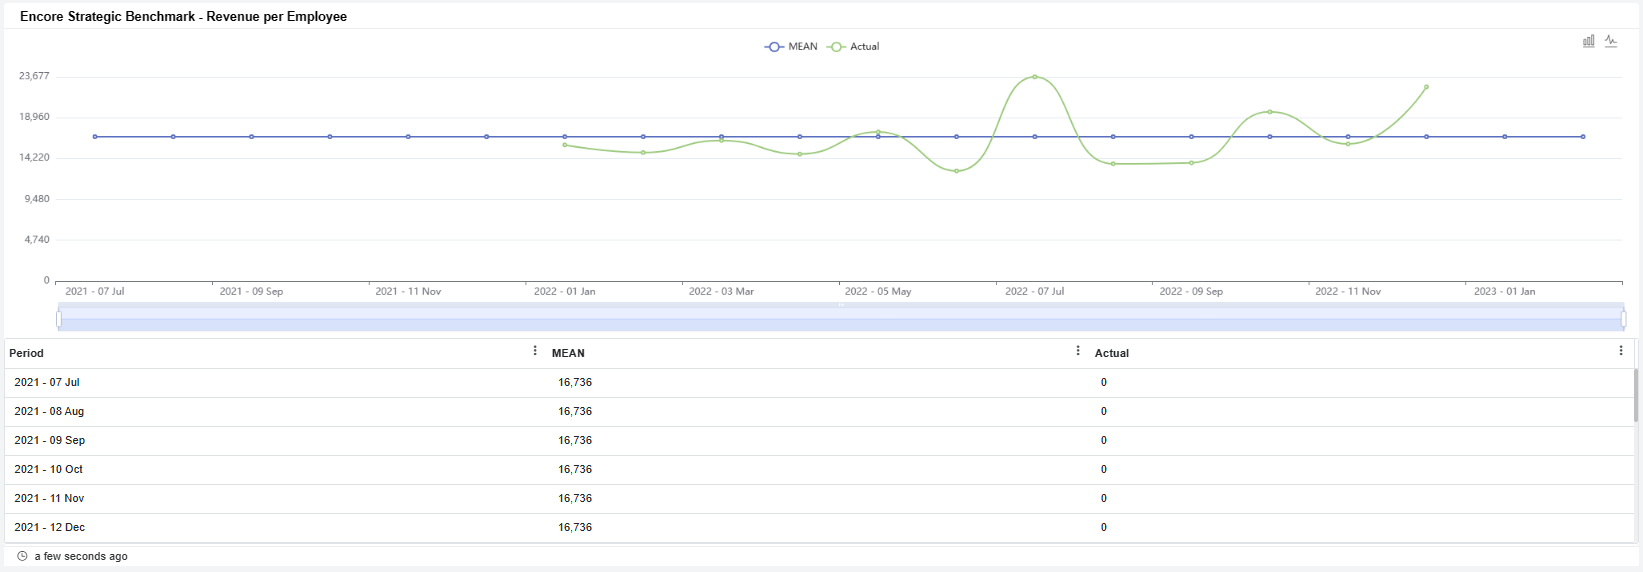
Data Source: Encore mapping for Revenue and Encore Settings for Employee Count
Net Operating Profit Per employee
A column chart showing Net Operating Profit Per employee frequency by quarter and monthly layout of the selected range.
Net Operating Profit Per employee is a ratio that roughly measures Net Operating Profit generated by each employee.
Calculation: (Revenue - (COGS + Expense + Depreciation + Amortization)) / Employee Count
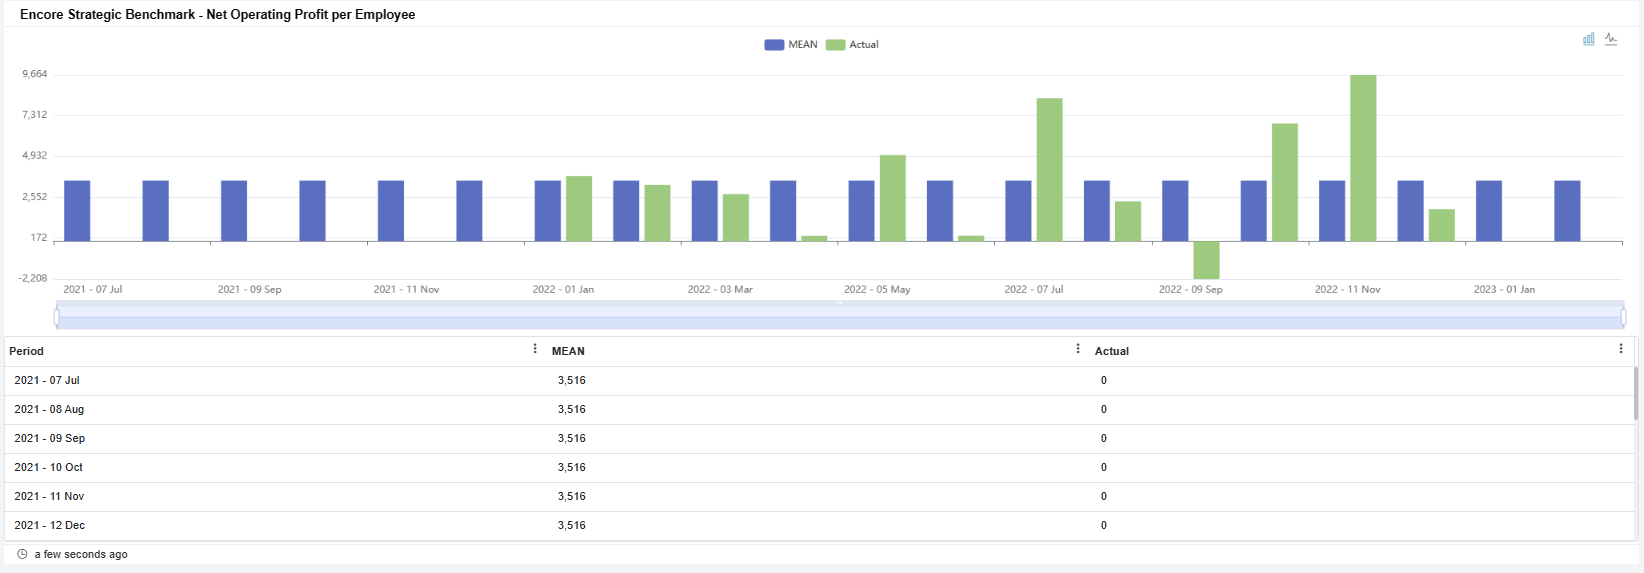
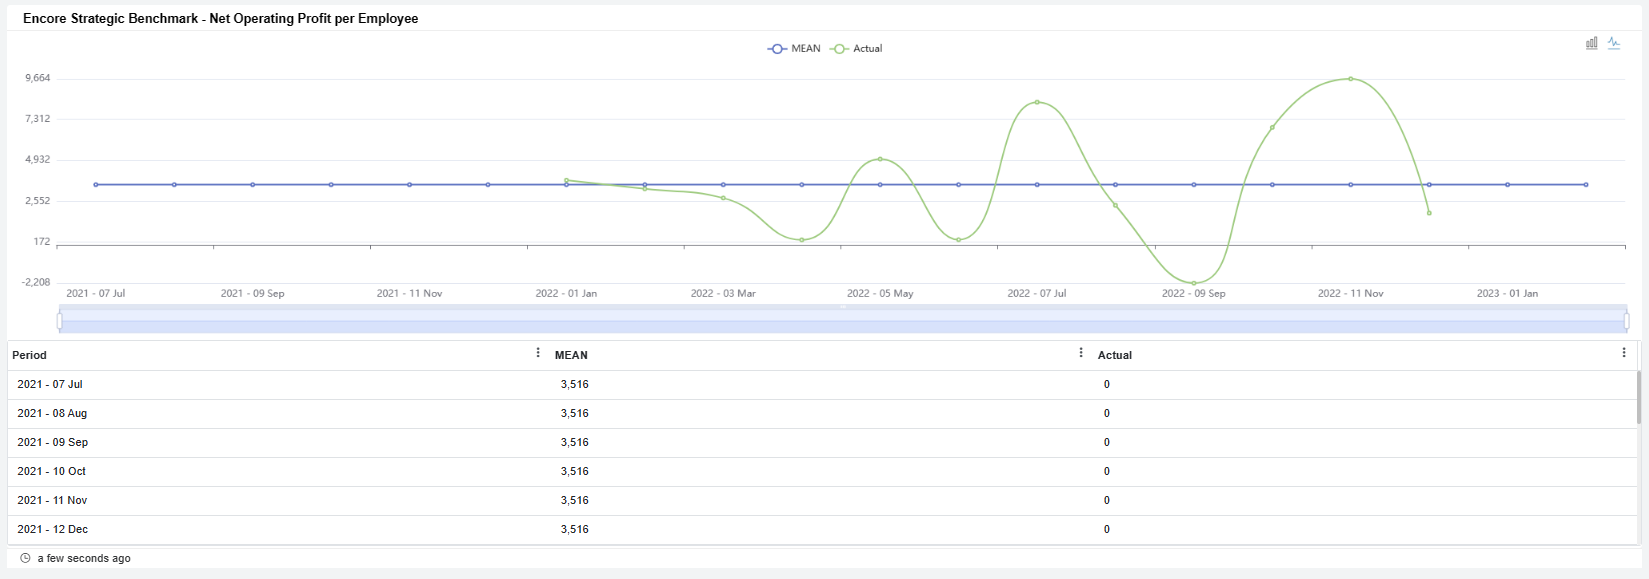
Data Source: Encore mapping for Net Operating Profit and Encore Settings for Employee Count
Net Operating Income
A column chart showing Net Operating Income percentages by quarter and monthly layout of the selected range.
Net Operating Income is Total Revenue minus Cost of Goods Sold(COGS),Expenses,Depreciation and Amortization.
Calculation: Revenue - (COGS + Expense + Depreciation + Amortization)
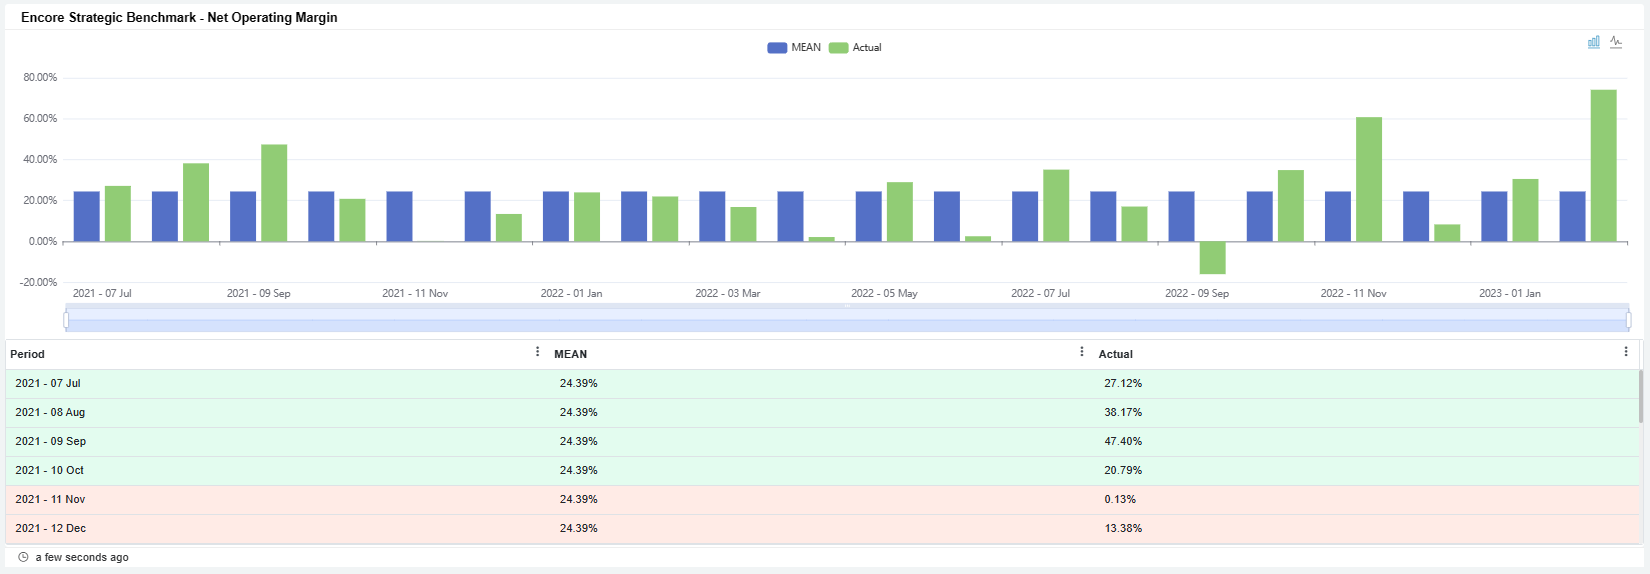
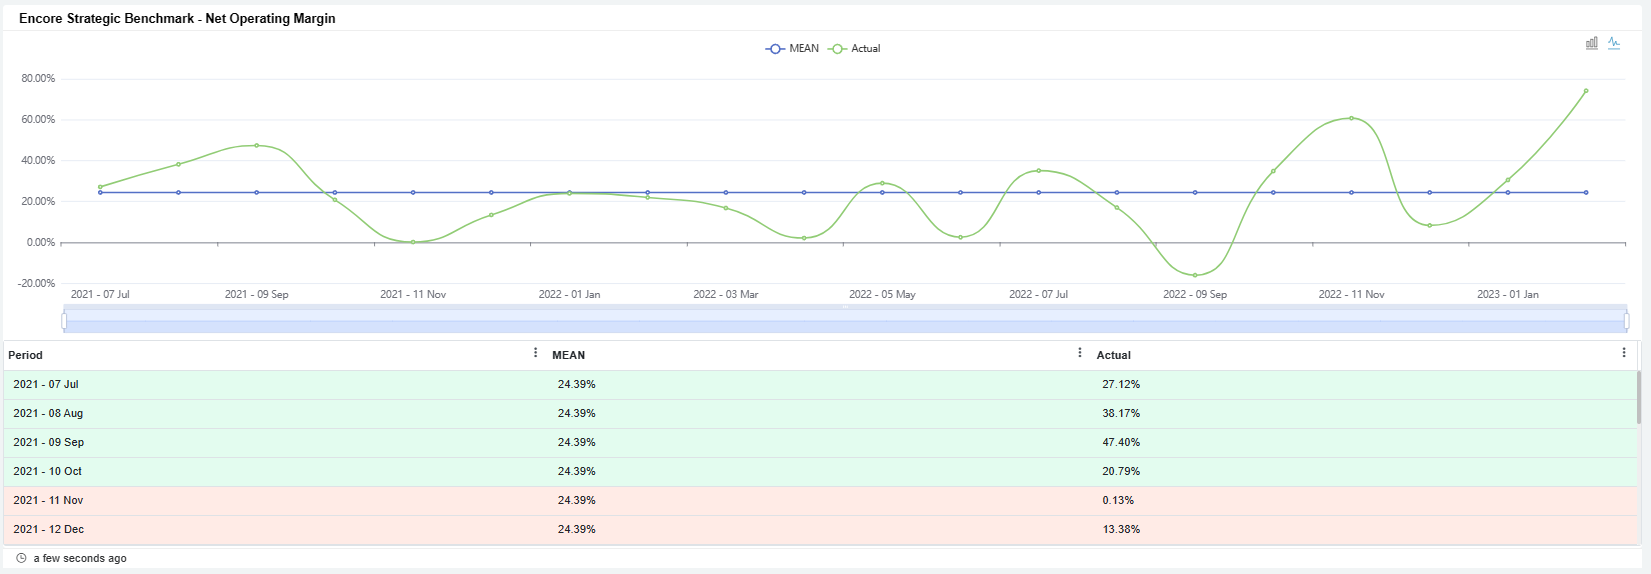
Data Source: Encore mapping
Days Sales Outstanding(DSO)
A column chart showing Days Sales Outstanding in days for the current calendar period
Days Sales Outstanding is a measure of the average number of days that it takes a company to collect payment for a sale
Calculation: DSO = (Average Accounts Receivable / Total Revenue) * 365
Average Accounts Receivable = (Accounts Receivable Beginning + Accounts Receivable End)/2
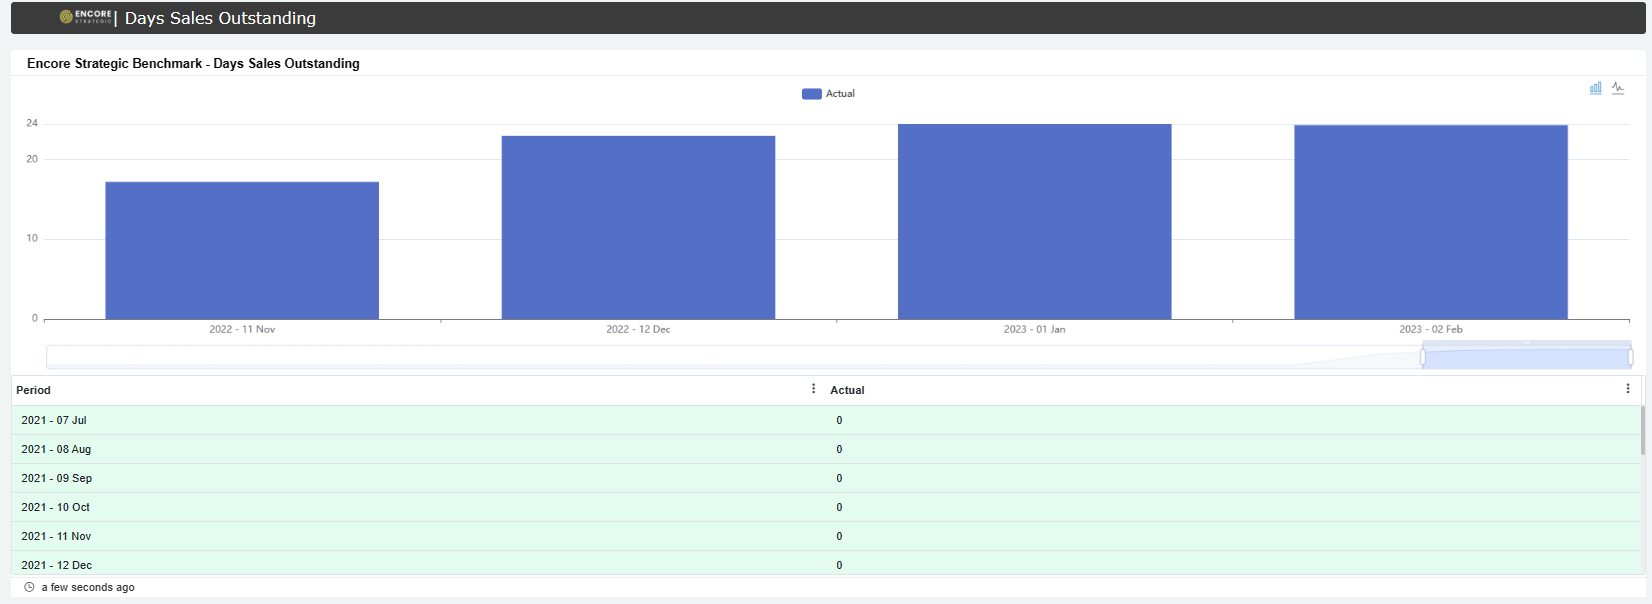
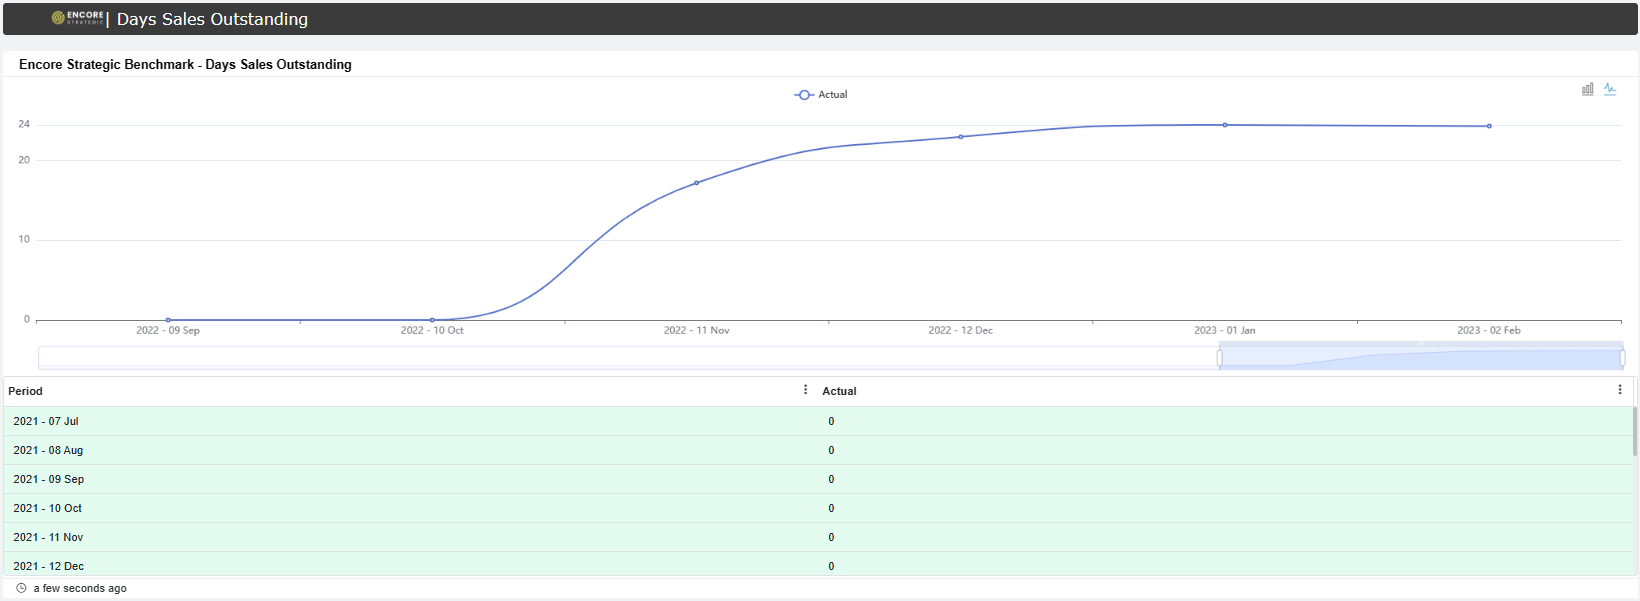
Data Source: Encore mapping
Overview
Content Tools
N O T I C E
MSPbots WIKI is moving to a new home at support.mspbots.ai![]() to give you the best experience in browsing our Knowledge Base resources and addressing your concerns. Click here
to give you the best experience in browsing our Knowledge Base resources and addressing your concerns. Click here![]() for more info!
for more info!