 N O T I C E
MSPbots WIKI is moving to a new home at support.mspbots.ai![]() to give you the best experience in browsing our Knowledge Base resources and addressing your concerns. Click here
to give you the best experience in browsing our Knowledge Base resources and addressing your concerns. Click here![]() for more info!
for more info!
Page History
The Service KPI Pulse Benchmarking App is one of the a powerful benchmarking apps of tool offered by MSPbots that includes comes with a peer group function. This app allows enables managed service providers (MSPs) to measure their performance on specific against target metrics and how they compare to it with their peers on key performance indicators (KPIs) such as response time, resolution time, utilization rate, and kill rates. The dashboard shows provides real-time data, paving the way for prompt action-taking, which helps MSPs take prompt actions for timely issue resolution , and improved operational efficiency.
...
Service managers and MSPs using the Service KPI Pulse Benchmarking app enjoy these benefits like these:
- A set of KPIs to measure performance against target goals
- Access to Proactive monitoring and prompt action-taking from a dashboard with real-time KPI results for proactive monitoring and prompt action-taking results
- A peer group function where you compare your KPI scores with industry standards and the performance of other companies
- Improved operational efficiency from an iterative process of learning from best practices and refinement
...
- Average Minutes to Response - This is the average time it takes a technician takes to respond to a client inquiry or request.
- Average Hours to Resolution - This is the average amount of time a technician spends from identifying the issue to resolution.
- Average Utilization - This measures the percentage of billable hours a technician works over a particular period of time. Billable hours are the number of hours within a time period when the technician works at the client's expense and contributes to company profit.
- Kill Rate - This metric is the ratio of resolved tickets to open tickets at a given time.
...
- In the MSPbots, go to Apps and open the Service KPI Plus Benchmarking app.
- Set up your KPI settings.

- Go to Settings > Service KPI Pulse Settings.
- Under the Title section, enable the switches for the tickets that should be included in the calculation and select options for each corresponding switch.
- Under the Utilization section, enable the switches and select the options for calculation.
- Next, for Daily Capacity / Availability, ConnecWise and Autotask users may select the PSA option to automatically add members automatically.
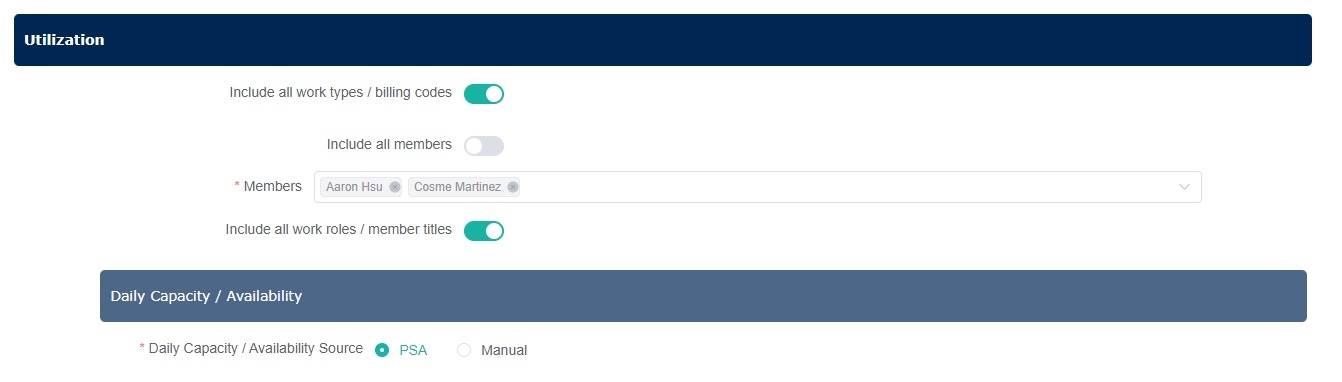
You can select Manual and click +Add to add members manually.
Note The PSA option is available to ConnectWise and Autotask users only. Kaseya BMS users must add members manually.
- Click Submit to apply the settings to your dashboard.
- Verify your KPI results by going to Dashboard > Service KPI Pulse Dashboard. If the dashboard does not show the results you expected, go back to the KPI Pulse Settings and modify the settings until you get the correct results.
- If you want to know how your MSP compares with your peers, join a peer group and add KPIs for your group.
...
The Service KPI Dashboard is where you monitor your MSP's performance against your KPIs. It has widgets that display your MSP's scores for Average Minutes to Response. Average Hours to Resolution, Average Utilization, and Kill Rate. This dashboard is updated in real time so you can identify and address possible issues as they arise.
To access Access the Service KPI dashboard , go by going to Dashboard > Service KPI Pulse Dashboard.
Below is an example of the Service KPI Dashboard. 
To learn more about the Service KPI Pulse Benchmarking app, send an email to product@mspbots.ai.
Related Topics
...
| Content by Label | ||||||||||
|---|---|---|---|---|---|---|---|---|---|---|
|
...
Overview
Content Tools