 N O T I C E
MSPbots WIKI is moving to a new home at support.mspbots.ai![]() to give you the best experience in browsing our Knowledge Base resources and addressing your concerns. Click here
to give you the best experience in browsing our Knowledge Base resources and addressing your concerns. Click here![]() for more info!
for more info!
Page History
The Client Portal Dashboard template provides gives users a real-time view regarding the of a client's ticket status, response, and resolutionsresolution. The various widgets shown as default has a drill-down feature for users to know more about its details.
Also, in order to show the results per client, the template has a slicer feature which filter the results per client.
| Table of Contents |
|---|
Sample Screenshot for Client Portal Dashboard Template
a. ConnectWise

b. Autotask

and slicers feature gives more information on each widget and allows the results to be filtered per client.
This article gives an overview of the following topics about the Client Portal Dashboard:
| Table of Contents | ||||
|---|---|---|---|---|
|
...
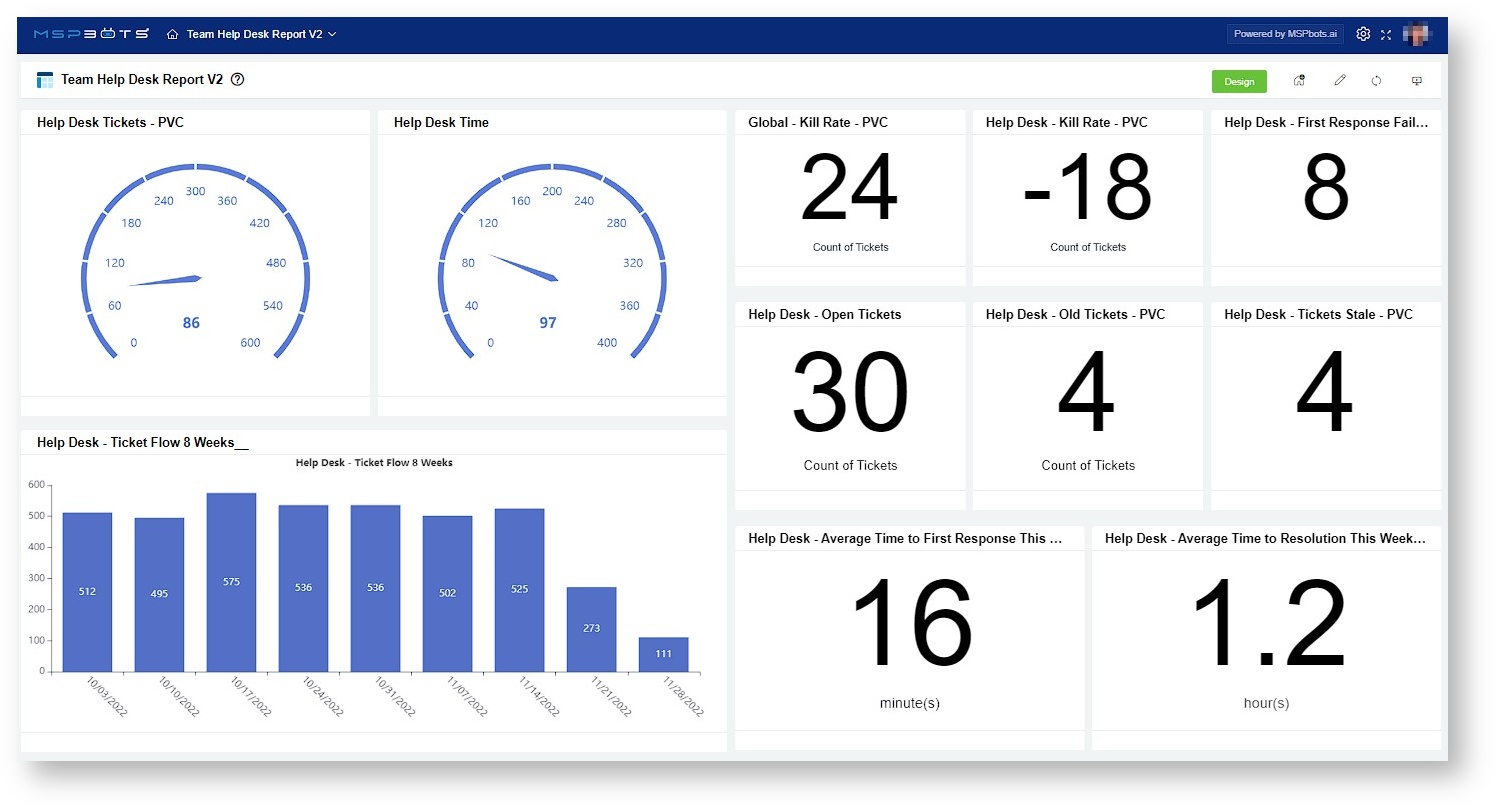
What does the Client Portal Dashboard look like?
Below are screen captures of sample Client Portal Dashboard templates for ConnectWise and Autotask.
Client Portal Dashboards for ConnectWise

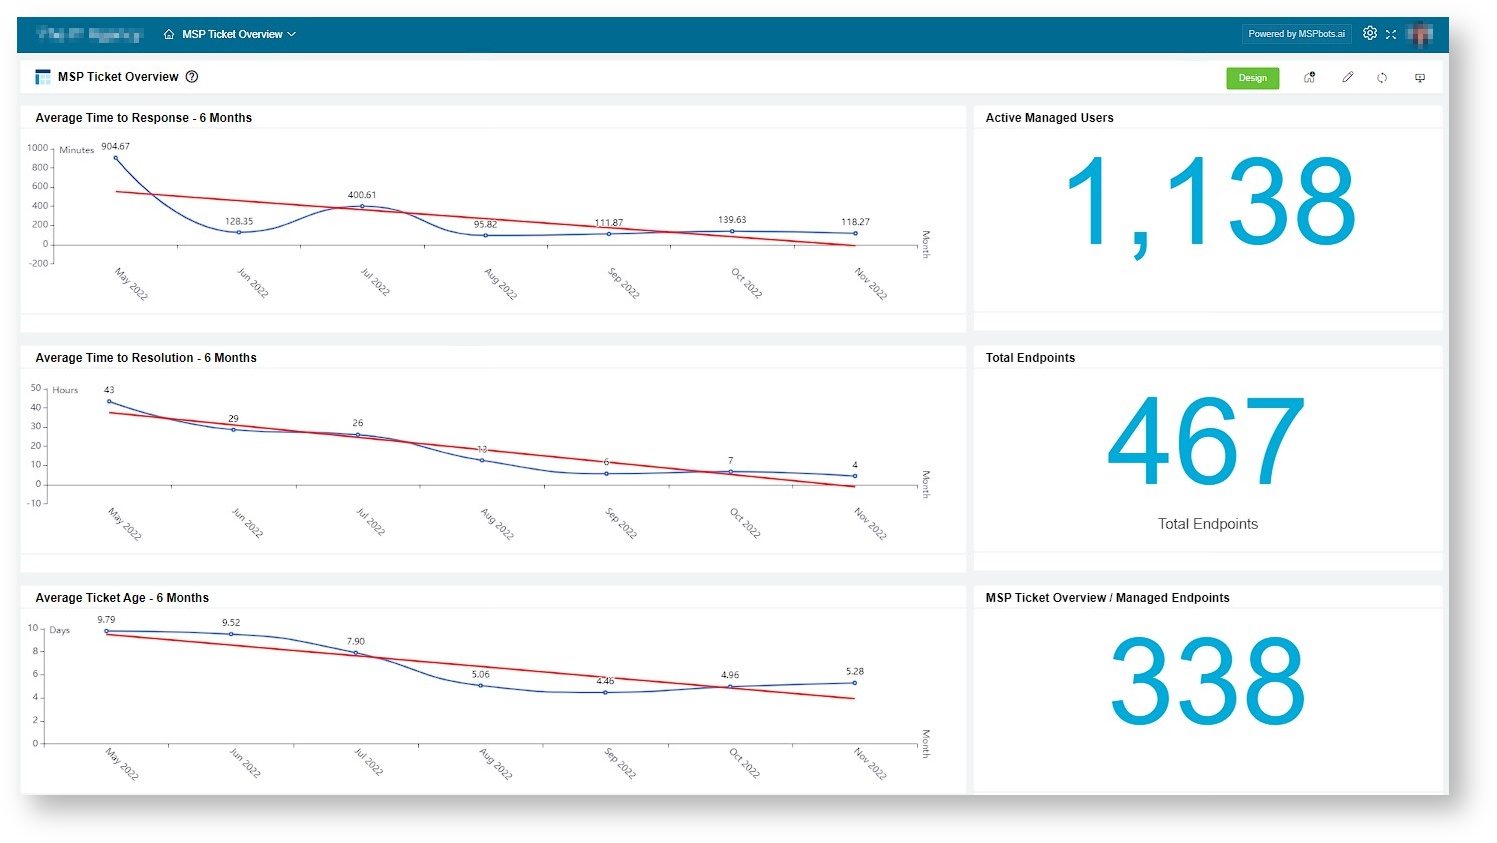
Client Portal Dashboards for Autotask

Descriptions
...
of Widgets and Features
| Widget Type | Widget Name | Description | PSA Availability |
|---|---|---|---|
| Slicer | Company filter | This slicer detects the uses email addresses to detect the client MSPs who are currently logged -in MSP's clients by their email address and will only display the data belonging to in. It displays only the data of the company set in the client portal management. MSP 's admin users can view all the companies listedon the list. |
|
| Card Number | Open Client | Show This card number shows the count of client open tickets. |
|
| Waiting on Customer - Client | Show This card number shows the count of tickets waiting on a client's response. |
| |
| Average to Respond | Show This card number shows the average time taken to respond in minutes forto tickets updated in the last 14 days and status is not closed.is measured in minutes. The ticket status should be Open. |
| |
| Average to Resolution | Show This card number shows the average time to resolution in minutesfor tickets updated in the last 14 days. This is measured per client, and status is not closed per Clientticket status should be Open. |
| |
| Pie Chart | Opened Last 14 Days By Type | Show This chart shows the type and count of tickets opened in the last 14 days by type. |
|
| Column Chart | Tickets Open by Tech - Client | Show This chart shows open tickets (non-resolved tickets) by Technician the technician per Clientclient. |
|
| Tickets Opened by Contact Last 14 days - Client | Show This chart shows the count of tickets opened by contacts in the last 14 days. |
| |
| Tickets Opened vs Closed Last 14 Days - Client | Show This chart shows the count of tickets opened by per day and the count of tickets completed at the end of the day for the last 14 days. |
|
How to Access the Client Portal Dashboard Template
...
- Log in to the MSPBots
...
- app and
...
- navigate to Dashboards.


2. At On the Dashboard pageDashboards tab, click "Template Dashboard" tabDashboards.


3. Hover to Search field and type in Search for "Client Portal" . Show results to show the templates for Autotask and ConnectWise client portal setupClient Portal.


4. Select and click the desired Client Dashboard Template - Client Portal to access.
5. Click to open and view the new dashboard. (see screenshot above)
How to show results per Company
Click the dashboard that you want to view.
New Template: ConnectWise Manage Client Dashboard - Client Portal

New Template: ConnecWise Manage Audit Report - Client Portal

How to Show Results per Company
On 1. At the Client Portal Dashboard view, hover to click on the Company drop-down dropdown text field.

2. Click the drop-down arrow to select or filter the results per company.


What else can I do in the Client Portal Dashboard?
How to use the Client Portal for your clients
| Content by Label | ||||||||||||
|---|---|---|---|---|---|---|---|---|---|---|---|---|
|
Overview
Content Tools