 N O T I C E
MSPbots WIKI is moving to a new home at support.mspbots.ai![]() to give you the best experience in browsing our Knowledge Base resources and addressing your concerns. Click here
to give you the best experience in browsing our Knowledge Base resources and addressing your concerns. Click here![]() for more info!
for more info!
Page History
The TruMethods Smart Numbers App app is a business management tool that provides a centralized and , visual representation of your company's data and performance indicators. Business owners, service managers, and other stakeholders can refer to the TruMethods dashboards and widgets to gain real-time insights for informed decision-making, a thorough evaluation of performance, and timely action-taking.
The TruMethods Smart Numbers app is designed for TruMethods users and works on PSAs Professional Services Automation (PSA) software like ConnectWise, Autotask, and Kaseya BMS.
What's in this article:
| Table of Contents |
|---|
What are the dashboards available in the TruMethods Smart Numbers app?
...
Leadership Dashboard
The Leadership Dashboard contains data for Support Weekly and Monthly Leadership, Centralized Services, Projects, and Technical Alignment. This dashboard hosts widgets like Average Resolution Time, Average Support Tickets Response Time, and Support Tickets Created and Closed.


Service Delivery Dashboard
The Service Delivery Dashboard contains widgets for Support, Centralized Services, and Technical Alignment. Some examples of the widgets are Same-Day Support Ticket Response, Centralized Services Ticket Created, and Managed Service Clients.

Financial Dashboard
The Financial Dashboard is a comprehensive tool that provides data and insights into your company's key financial metrics, including metrics for Profit, Revenue, Leverage, and Sales.
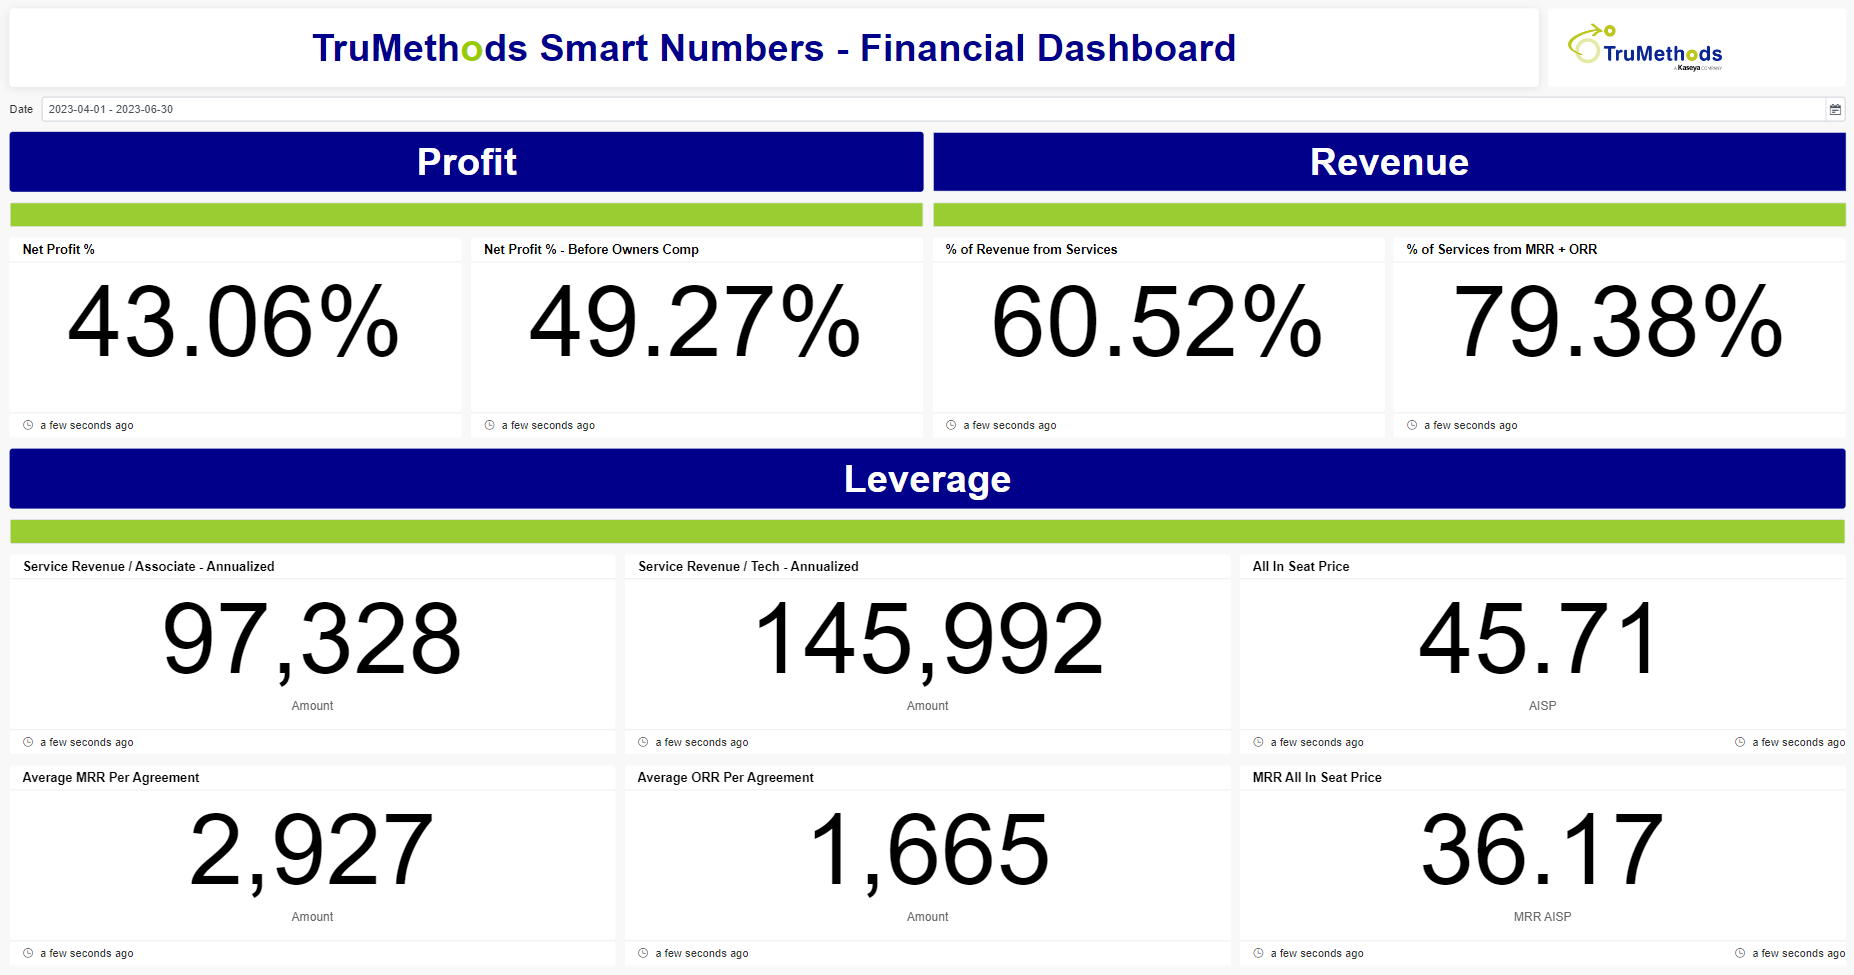
Below are the widgets for the metrics and the computations for each.
- PROFIT
Net Profit % - This card widget shows the percentage of Net Profit to Total Revenue for the selected date range.
Computation: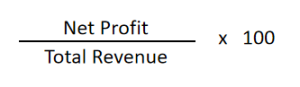
Net Profit % Before Owner's Comp - This card widget is calculated as the percentage of Revenue less Expenses plus Drawdowns divided by the Total Revenue for the selected date range.
Computation: 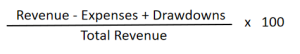
REVENUE
% of Revenue from Services - This card widget shows the percentage of the sum of the Revenue from Services over the Total Revenue for the selected date range.
Computation: 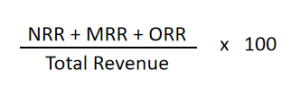
% of Services from MRR + ORR - This card widget shows the percentage of the sum of the Services from MRR and ORR over the Total Revenue for the selected date range.
Computation: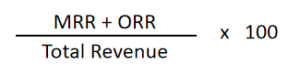
- LEVERAGE
Service Revenue / Associate - Annualized - This card widget shows the average Service Revenue per Associate for the selected date range.
Computation: 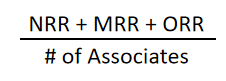
Service Revenue / Tech - Annualized - This card widget shows the average Service Revenue per Tech Associate for the selected date range.
...
Computation: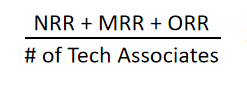
All-In Seat Price - This widget displays the average MRR and NRR per seat for the selected date range.
Computation: 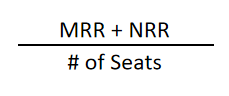
Average MRR per Agreement - This widget displays the average Monthly Recurring Revenue per Agreement for the selected date range.
Computation: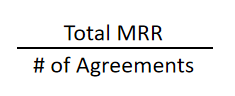
Average ORR Per Agreement - This widget displays the average of Other Recurring Revenue per Agreement for the selected date range.
Computation: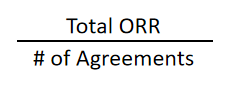
MRR All-In Seat Price - This widget displays the average Monthly Recurring Revenue per Seat for the selected date range.
Computation: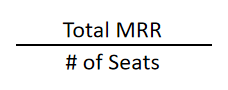
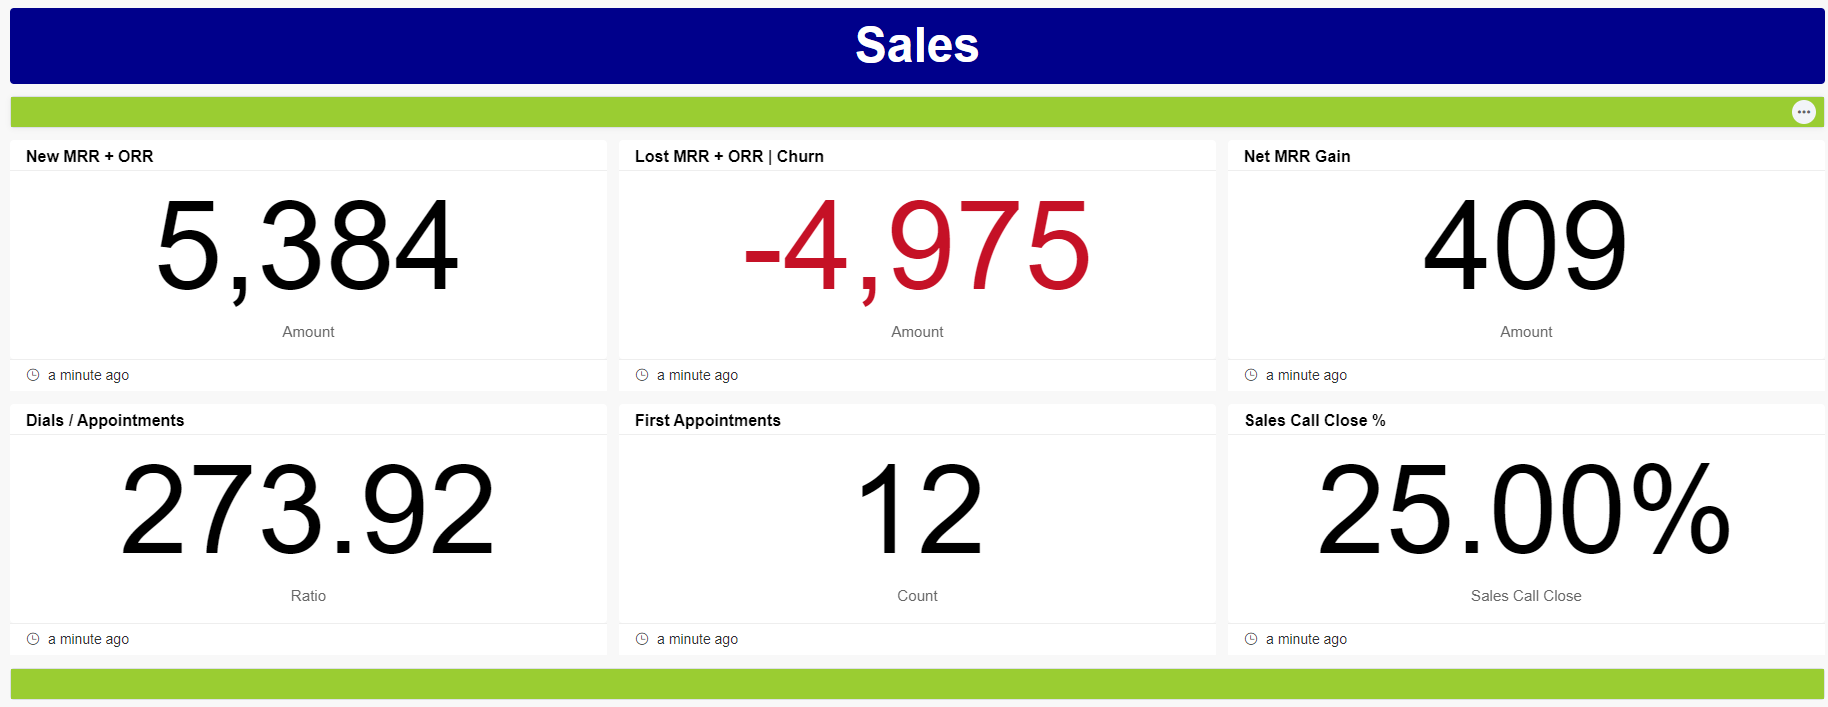
SALES
New MRR + ORR - This card widget shows the total Monthly Recurring Revenue (MRR) and Other Recurring Revenue (ORR) during the selected date range.
Computation: Total New MRR + ORR
Lost MRR + ORR | Churn - This card widget displays the total Monthly Recurring Revenue (MRR) and Other Recurring Revenue (ORR) lost during the selected date range.
Computation: Total Lost MRR + ORR
Net MRR Gain - This card widget calculates the net difference in the sum of the Monthly Recurring Revenue (MRR) and Other Recurring Revenue (ORR) from the sum of revenue during the selected date range.
Computation: 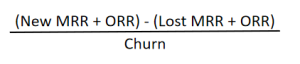
Dials / Appointments - This card widget shows the ratio of the total dials to the total appointments made during the selected date range.
Computation: Total Dials / Total Appointments
First Appointments - This card widget displays the total count of initial appointments scheduled during the selected date range.
Sales Call Close % - This card widget calculates the percentage of new agreements closed successfully in relation to the total count of first appointments made during the selected date range.
Computation: 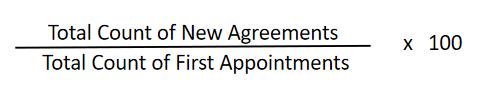
...
| Info |
|---|
The data shown in the dashboards are based on the data you enter in the TruMethods Smart Numbers Settings form. Please see <section> Configure TruMethods Settings for more information about this form. |
How can I access TruMethods Smart Numbers?
...
You can open TruMethods on the MSPbots app by going to Apps on the menu and clicking TruMethods BI Package on the Apps tab.

How can I start using the TruMethods app?
(diagram)
Installing the TruMethods app
For Sir G: Is TruMethods installed/available by default?
...
TruMethods Smart Numbers comes with your MSPbots app. You don't need to install it to be able to start using the dashboards and widgets to improve and respond to your service delivery, projects, support, and leadership needs. After you connect your PSA and software, configure your TruMethods settings, and validate the dashboard data, you are ready to start your TruMethods experience!
1. Connect your PSAs and software to MSPbots
The TruMethods app work on the following PSAs and software. Click your PSAs and software on the list table to view the guide on how to connect these to MSPbots.
| PSA | RMM | |
|---|---|---|
| ConnectWise PSA | Auvik | Kaseya VSA |
| Autotask | ConnectWise Automate | N-able N-Central |
| Kaseya BMS | Datto RMM | NinjaOne |
For Sir G: Should I write "ConnectWise Manage" in the above table?
Configuring and activating TruMethods
Go to Settings...
Verifying your connection and TruMethods activation
...
| Anchor | ||||
|---|---|---|---|---|
|
After successfully connecting your PSAs, you are now ready to configure your TruMethods settings. Do the following steps to configure the settings:
- Open the TruMethods Smart Numbers app.
- Once open, hover over Settings and select TruMethods Smart Number Settings.

- When the TruMethods Smart Number Settings tab opens, you will see sections or categories for KPI configurations. Each section has options to include or exclude specific filters or settings. Review the available options and select the filters you want to include or exclude based on your requirements and preferences.

- Click Submit to save.

3. Validate your TruMethods data
You are ready to validate the data on your reports after configuring the settings. Do the following steps:
Open the TruMethods Smart Numbers app.
Hover over Dashboards and select the dashboard for checking.

Review the data on the report and verify if the values are correct and presented according to your needs. If it is not, adjust or review your configurations in Settings using the procedure in Step 2 above.
Do these steps for both the Leadership and Service Delivery dashboards.
For more information on MSPbots and how it has been a game changer for many MSP businesses, view the MSPbots Demos, Trainings, and Webinars.
For more information on TruMethods, read the Who We Are - TruMethods page or visit the TruMethods website.
Overview
Content Tools