 N O T I C E
MSPbots WIKI is moving to a new home at support.mspbots.ai![]() to give you the best experience in browsing our Knowledge Base resources and addressing your concerns. Click here
to give you the best experience in browsing our Knowledge Base resources and addressing your concerns. Click here![]() for more info!
for more info!
Page History
| Table of Contents |
|---|
Encore Strategic
...
The 17 Encore Strategic Financial Benchmark metric calculations provide Benchmarking provides insight into a company's Financial KPIs. These metrics calculations provide the financial key performance indicators (KPIs) with data derived from expenses, revenue, and employee count. The 16 metrics calculated quarterly and monthly measure overall profitability , and the employees' contribution over revenue and net operating income by using data derived from Expenses, Revenue, and Employee count.
Product Margin %
.
All accounts in the Encore Strategic Benchmarking app are classified to include account groups, categories, and subcategories which consist of all accounts that are directly mapped to that specific grouping. This consists of all accounts associated with their parent categories and any nested subcategories. By following this approach, any account that is mapped to the designated group, category, or subcategory, including those mapped to the nested categories and subcategories within the account hierarchy, will be incorporated.
This article shows how the following metrics are calculated:
| Table of Contents | ||||
|---|---|---|---|---|
|
Product Margin
...
The Product Margin metric shows a column chart with product margin percentages by quarter and a A column chart showing Product Margin percentages by quarter and monthly layout of the selected range. Product Margin It is product revenue minus product cost of goods sold (COGS) expressed as a percentage of product revenue.
Calculation: (Product Sales - Product COGS) / Product SalesSales

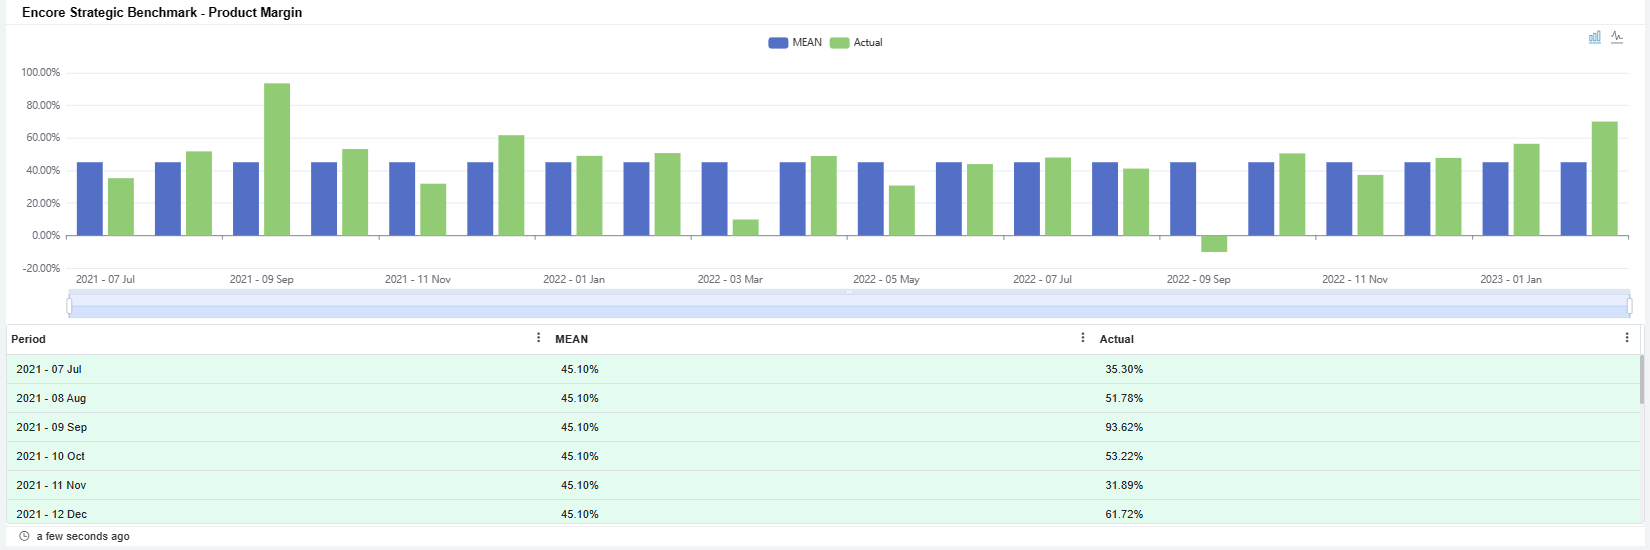
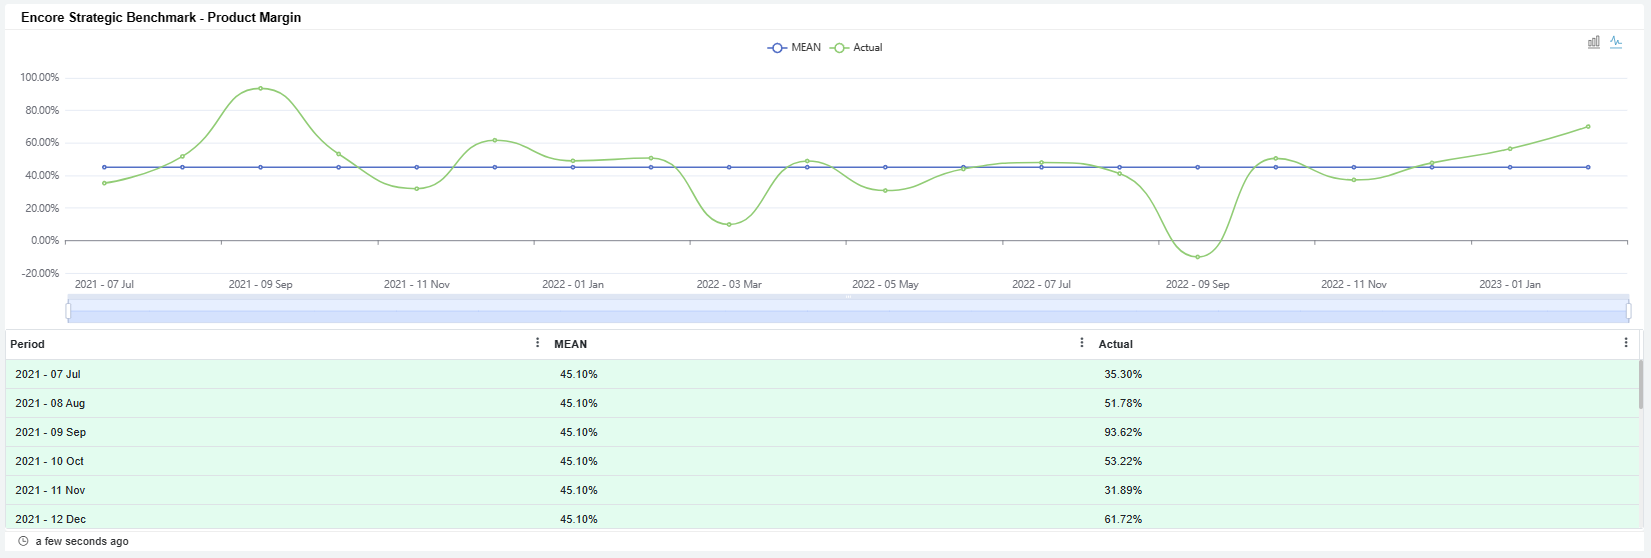
Data Source: Encore mapping
...
mapping
Account Grouping for Product Margin
| Account Category | Account Subcategory |
|---|---|
| Product Sales | Hardware & Software |
Cloud Resale | |
| Product COGS | Hardware & Software Costs |
Cloud Resale COGS | |
Special Product 1 | |
Special Product 2 |
Percent of Services to Total Revenue
...
A column chart showing the The Percent of Services to Total Revenue frequency by metric shows a column chart with the percentage of services to total revenue frequency by quarter and a monthly layout of the selected range.
Percent of Services to Total Revenue is Total Service Revenue expressed as percentage of Total Revenue.
This is the total service revenue expressed as a percentage of total revenue.
Calculation: Calculation: Service Revenue / Total Revenue
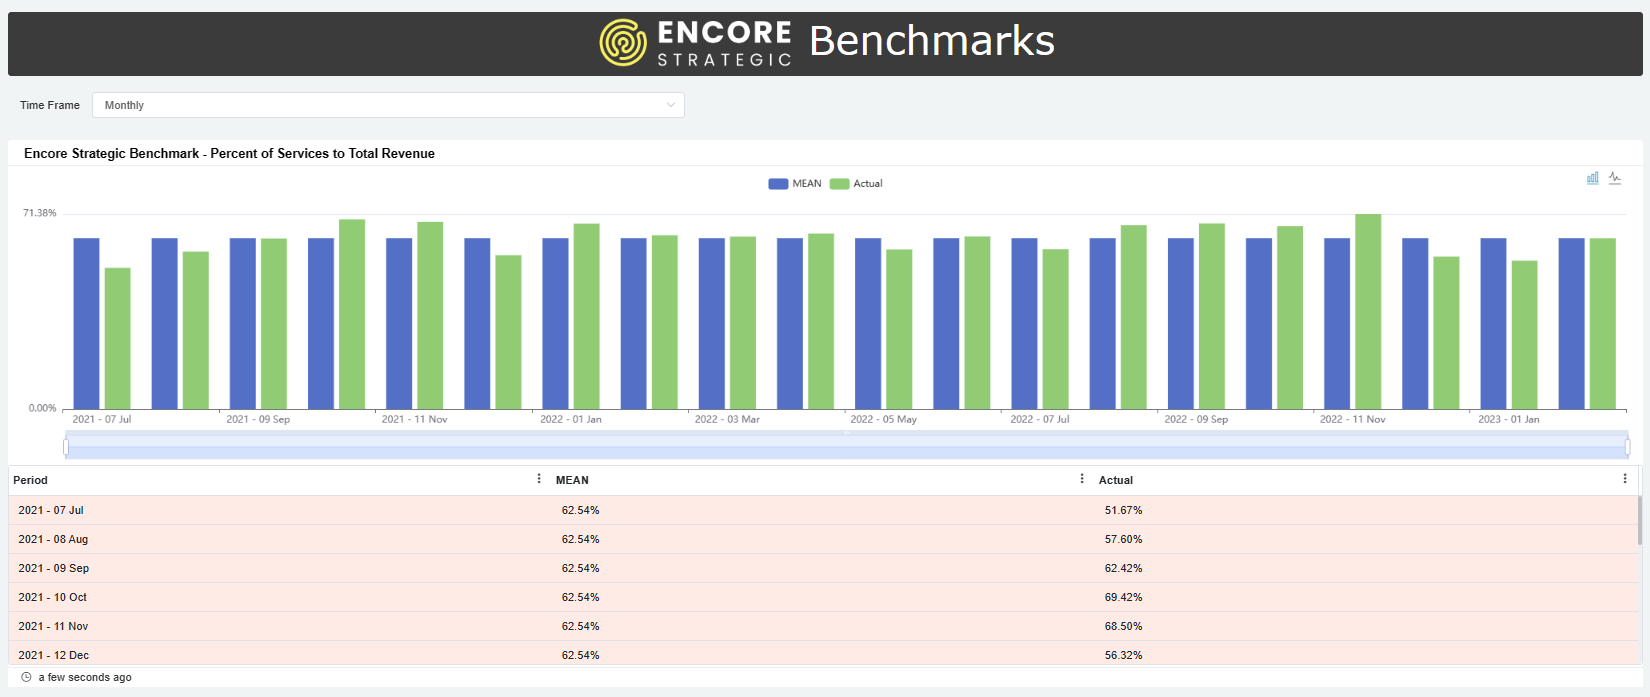
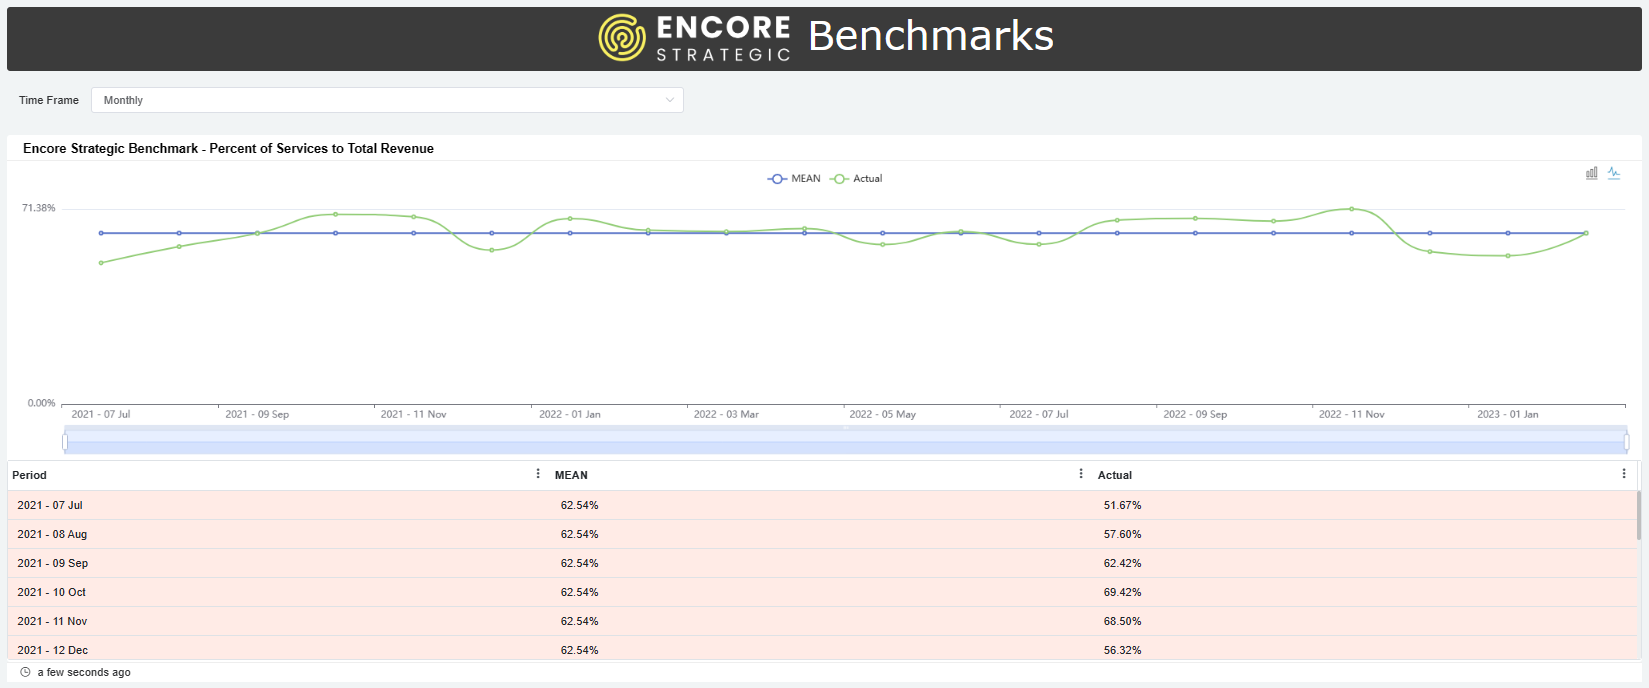
Data Source: Encore mapping
...
mapping
Account Grouping for Percent of Services to Total Revenue
- Service Revenue
Account Category Account Subcategory Recurring Service Revenues
Managed Services
BCDR
Security
Labor-Related Revenue
Block Hour Revenue
Time & Materials
Project Revenues
VOIP Revenue
Hardware As A Service Revenue
- Total Revenue
Account Group Account Category Account Subcategory Income Product Sales
Hardware & Software
Cloud Resale
Special Product 1
Special Product 2
Recurring Service Revenues
Managed Services
BCDR
Security
Labor-Related Revenue
Block Hour Revenue
Time & Materials
Project Revenues
VOIP Revenue
Hardware As A Service Revenue
Miscellaneous Income
Returns & Allowances
Service Gross Profit Margin
...
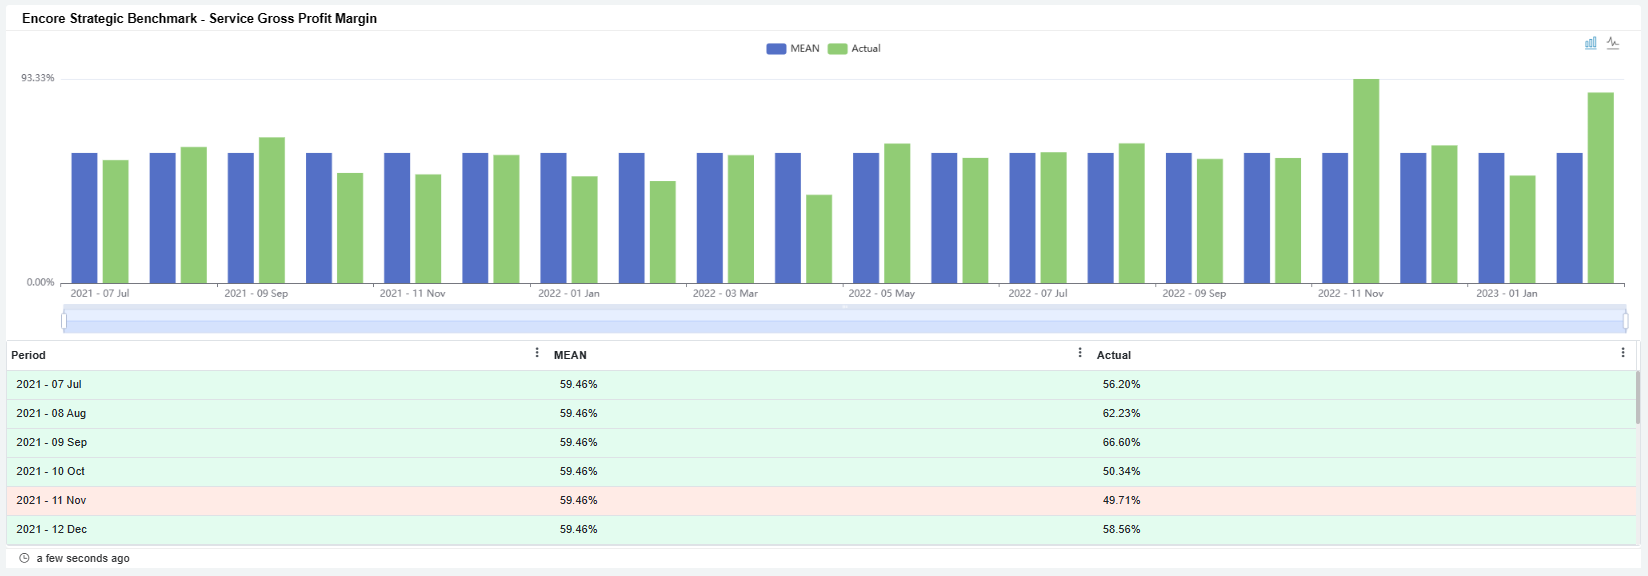
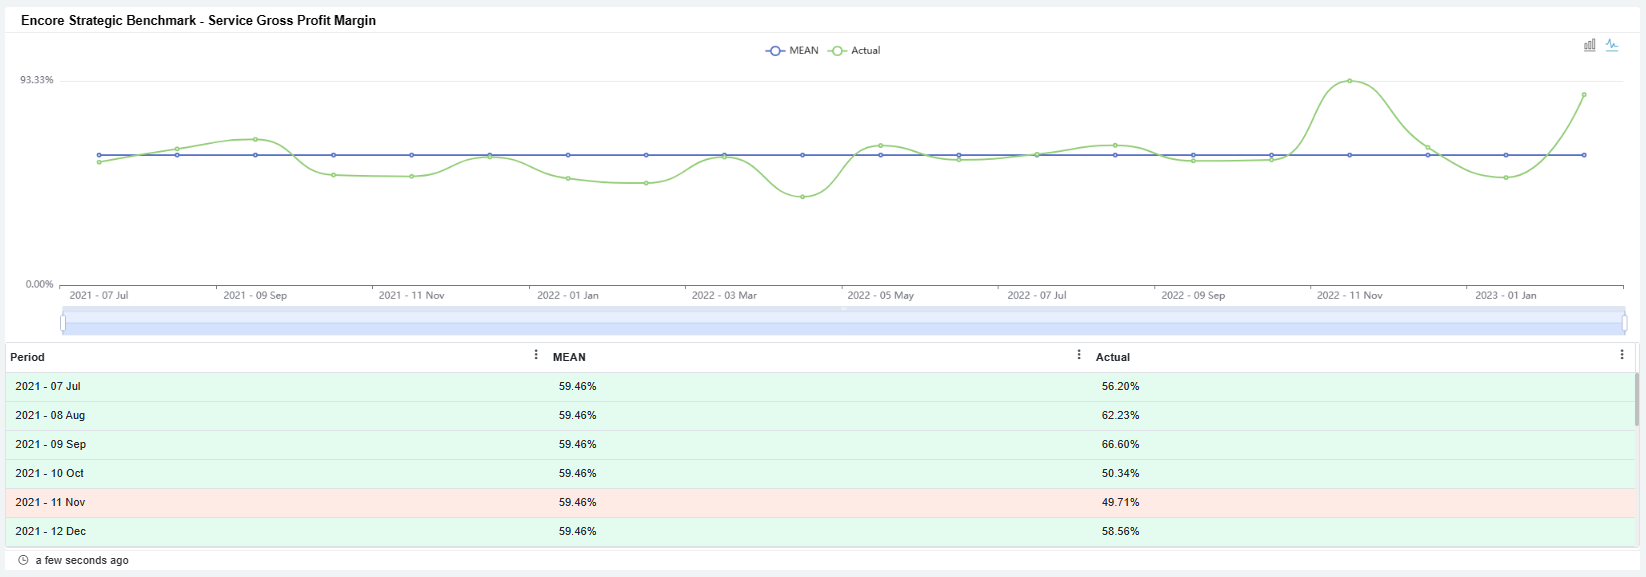
A column chart showing Service The metric Service Gross Profit Margin benchmark displays a column chart with service gross profit margin percentages by quarter and a monthly layout of the selected range. Service Gross Profit Margin It is service revenue minus service cost of goods sold (COGS) expressed as a percentage of service revenue.
Calculation:(Service Revenue - Service COGS) / Service Revenue
Data Source: Encore mapping
...
mapping
Account Grouping for Service Gross Profit Margin
- Service Revenue
Account Category Account Subcategory Recurring Service Revenues
Managed Services
BCDR
Security
Labor-Related Revenue
Block Hour Revenue
Time & Materials
Project Revenues
VOIP Revenue
Hardware As A Service Revenue
- Service COGS
Account Category Account Subcategory Recurring Service COGS
Managed Services Costs
BCDR
Security Costs
Labor Costs
Technician Salaries
Technician Payroll Taxes
Technician Benefits
Project Costs
VOIP Costs
Hardware As A Service Costs
Percent of Recurring Revenues to Total Service
...
Revenue
...
The Percent
...
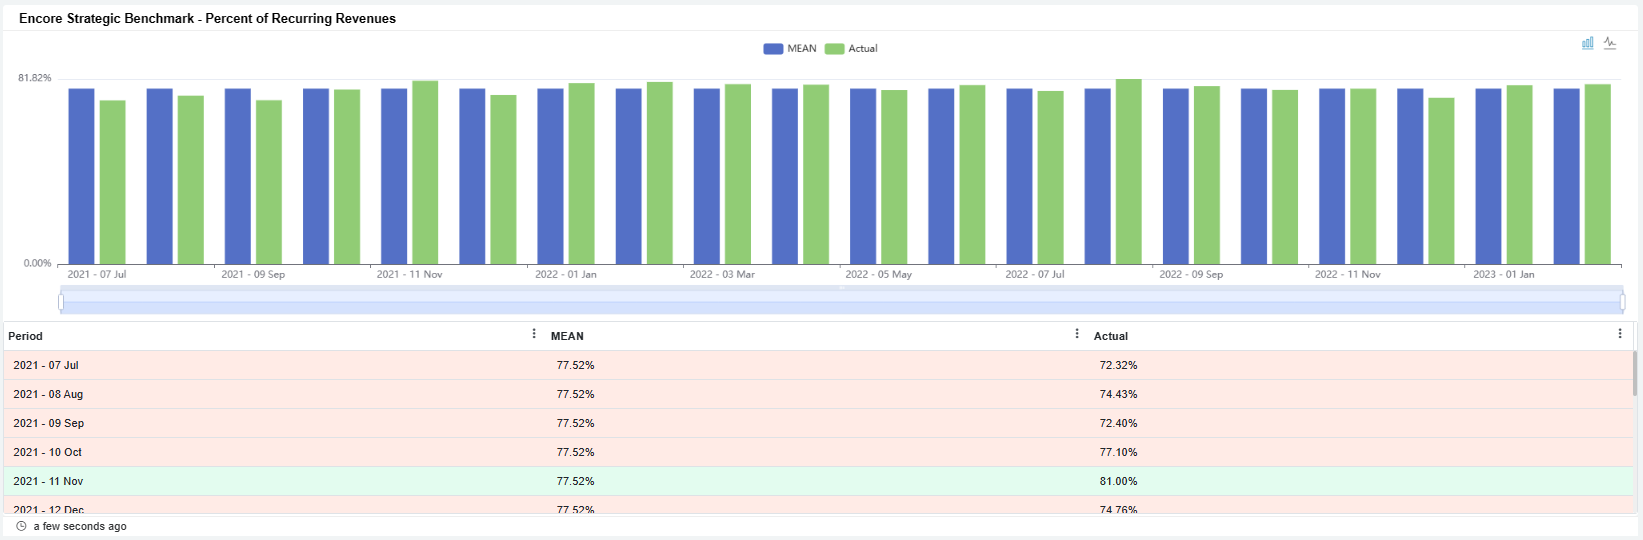
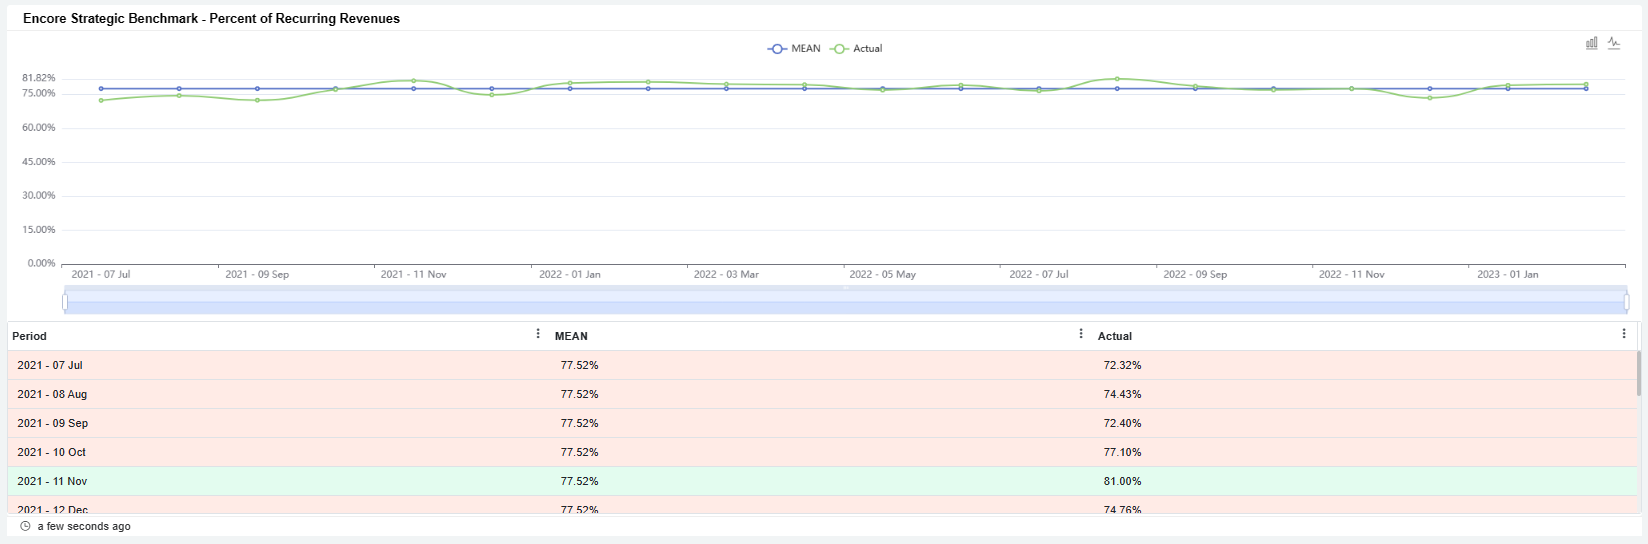
A column chart showing the Percent of Recurring Revenues to Total Service Revenue frequency by metric has a column chart showing the percentage of recurring revenues to total service revenue frequency by quarter and monthly layout of the selected range. Percent of Recurring Revenues to Total Service Revenue is Recurring Service Revenue It is recurring service revenue expressed as a percentage of Total Service Revenuetotal service revenue.
Calculation: Recurring Service Revenue / Total Service Revenue
Data Source: Encore mapping
Account Grouping for Percent of Recurring Revenues to Total Service Revenue
- Recurring Service Revenue
Account Category Account Subcategory Recurring Service Revenues
Managed Services
BCDR
Security
- Total Service Revenue
Account Category Account Subcategory Recurring Service Revenues
Managed Services
BCDR
Security
Labor-related Revenue
Block Hour Revenue
Time & Materials
Project Revenues
VOIP Revenue
Hardware as a Service Revenue
Percent of Project and Installation Revenue to Total Service
...
Revenue
...
The metric Percent of Recurring Revenues to Total Service Revenue has a
...
A column chart showing Percent of Project and Installation Revenue to Total Service revenue frequency by quarter and the percentage of recurring revenues to total service revenue frequency by quarter and a monthly layout of the selected range. Percent of Project and Installation Revenue to Total Service revenue is Project and Installation Revenue It is recurring service revenue expressed as a percentage of Total Service Revenuetotal service revenue.
Calculation: Project Revenue / Total Service RevenueRevenue
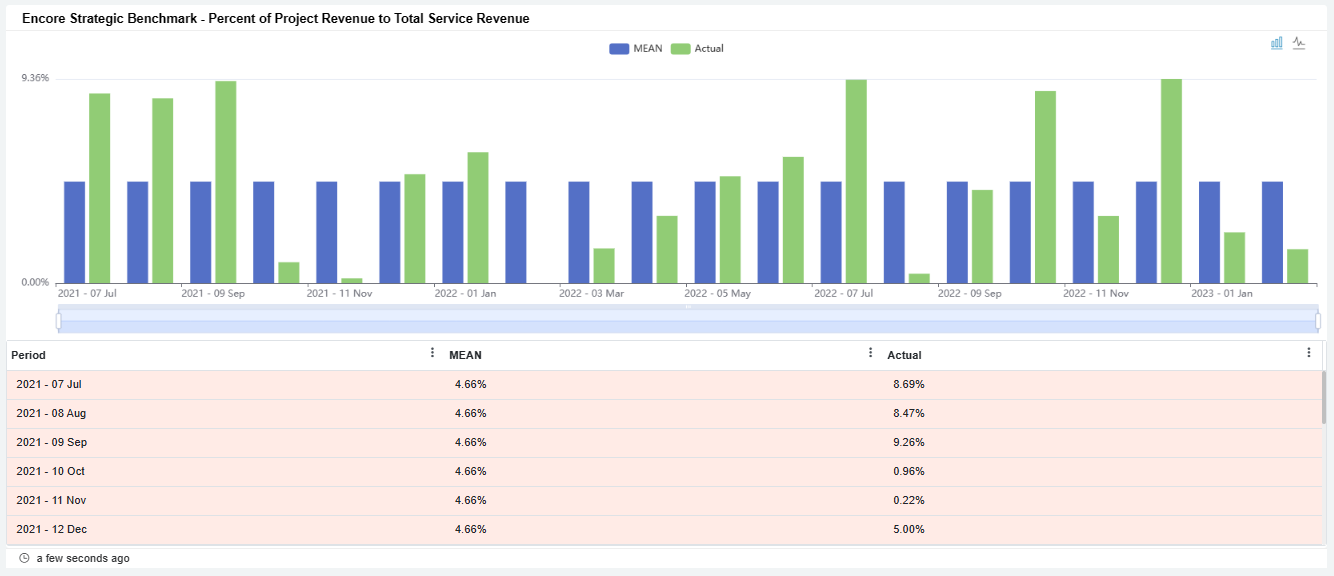
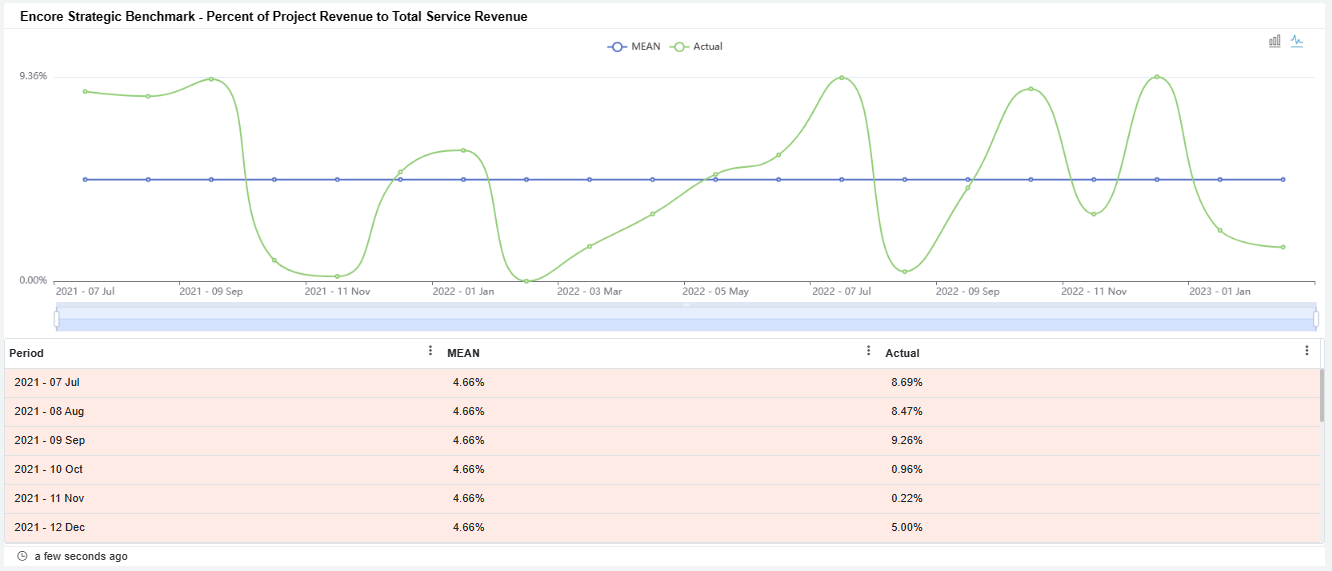
Data Source: Encore mapping
...
mapping
Account Grouping for Percent of Project and Installation Revenue to Total Service Revenue
- Project Revenue
Account Category Account Subcategory Labor-Related Revenue
Project Revenues
- Total Service Revenue
Account Category Account Subcategory Recurring Service Revenues
Managed Services
BCDR
Security
Labor-Related Revenue
Block Hour Revenue
Time & Materials
Project Revenues
VOIP Revenue
Hardware As A Service Revenue
Percentage of Other Non-Recurring Revenue to Total Service
...
Revenue
...
The Percent of Service Salaries to Service Revenue metric is a
...
A column chart showing Percentage of Other Non-Recurring Revenue to Total Service revenue frequency by the percentage of service salaries to service revenue frequency by quarter and monthly layout of the selected range. Percentage of Other Non-Recurring Revenue to Total Service revenue is Other Non-Recurring Revenue It is service salaries expressed as a percentage of Total Service Revenuetotal service revenue.
Calculation Calculation: Other Non-Recurring Revenue / Total Service RevenueRevenue

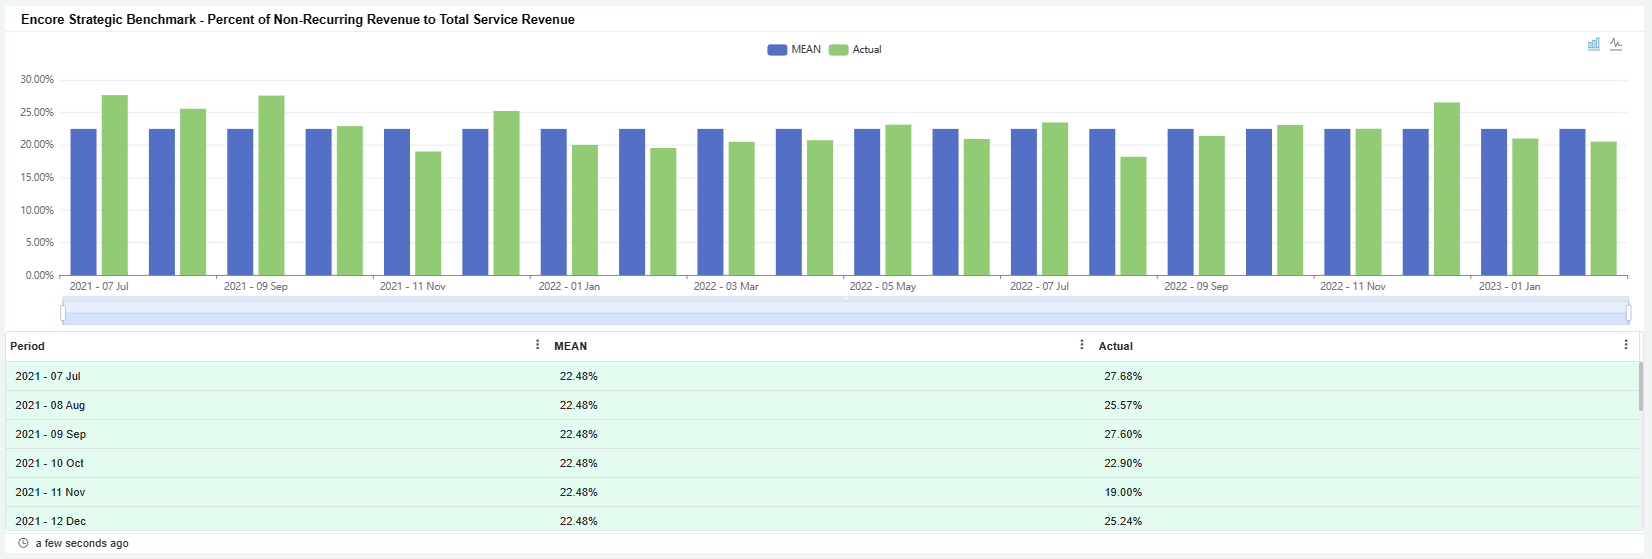
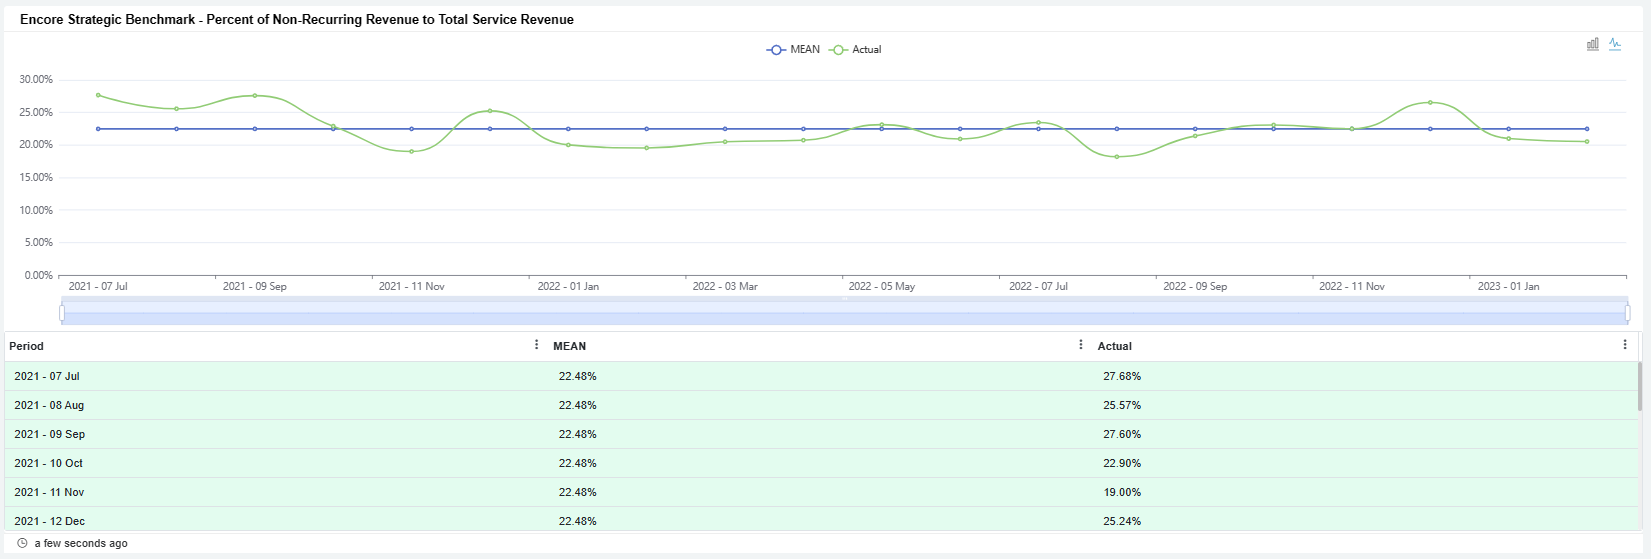
Data Source: Encore mapping
...
mapping
Account Grouping for Percent of Project and Installation Revenue to Total Service Revenue
- Other Non-Recurring Project Revenue
Account Category Account Subcategory Labor-Related Revenue
Block Hour Revenue
Time & Materials
Project Revenues
VOIP Revenue
Hardware As A Service Revenue
Miscellaneous Income
- Total Service Revenue
Account Category Account Subcategory Recurring Service Revenues
Managed Services
BCDR
Security
Labor-Related Revenue
Block Hour Revenue
Time & Materials
Project Revenues
VOIP Revenue
Hardware As A Service Revenue
Percent of Service Salaries to Service
...
Revenue
...
The Percent A column chart showing Percent of Service Salaries to Service Revenue frequency by metric is a column chart showing the percentage of service salaries to service revenue frequency by quarter and a monthly layout of the selected range. Percent of Service Salaries to Service Revenue is Service Salaries It is service salaries expressed as a percentage of Total Service Revenuetotal service revenue.
Calculation: Technician Salaries / Service Revenue

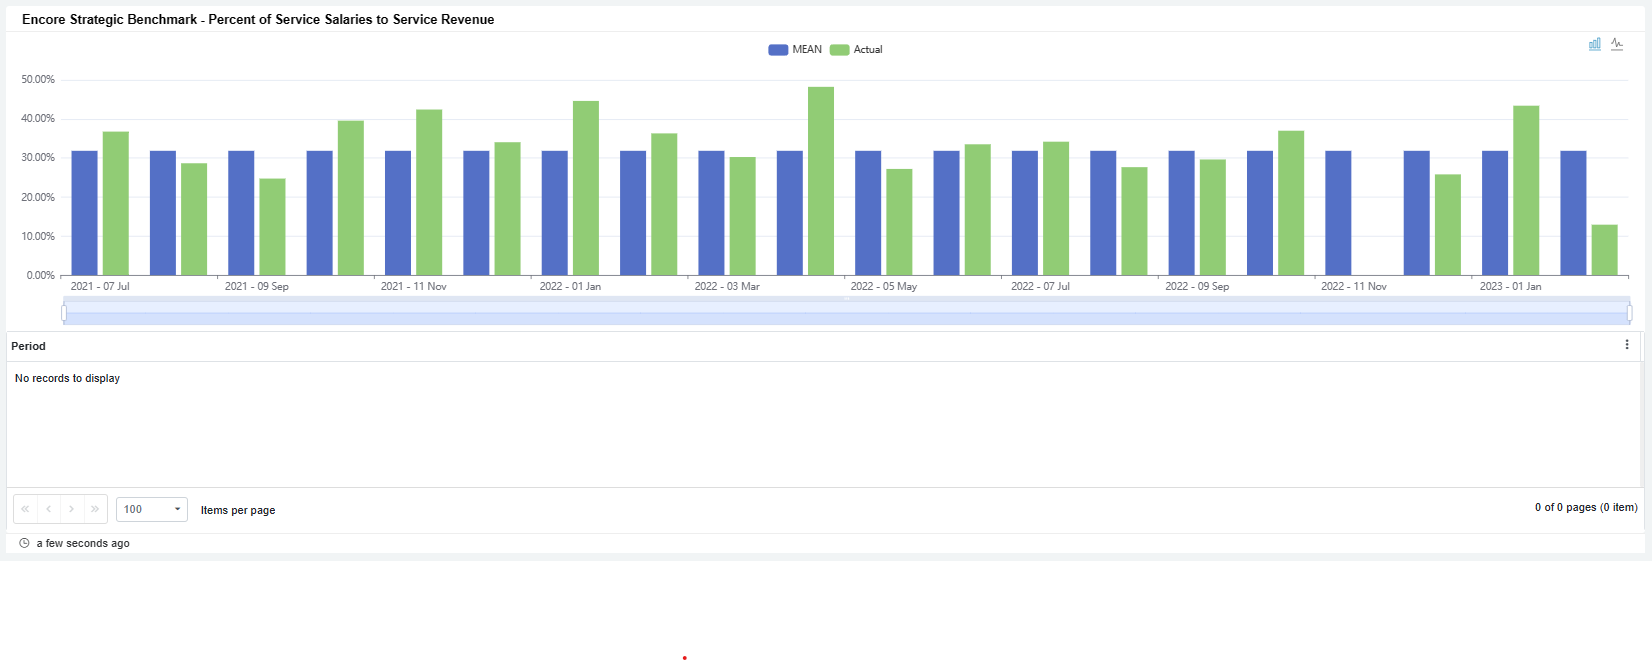
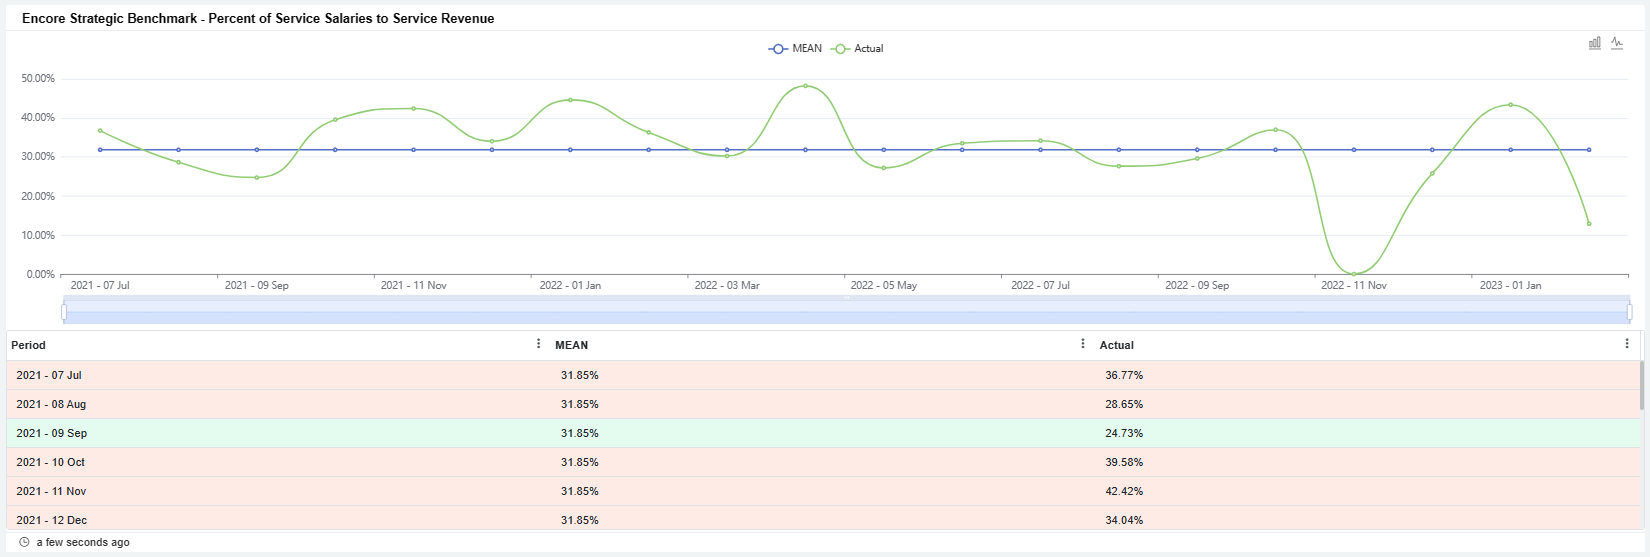
Data Source: Encore mapping
...
Account Grouping for Percent of Service Salaries to Service Revenue
- Technician Salaries
Account Group Account Category Account Subcategory COGS - Cost of Goods Sold
Labor Costs
Technician Salaries
- Service Revenue
Account Category Account Subcategory Recurring Service Revenues
Managed Services
BCDR
Security
Labor-Related Revenue
Block Hour Revenue
Time & Materials
Project Revenues
VOIP Revenue
Hardware As A Service Revenue
Sales Salaries and Commissions as a Percentage of
...
Revenue
...
The Sales
...
A column chart showing Sales Salaries and Commissions as a Percentage of Revenue frequency by metric displays a column chart with sales salaries and commissions as a percentage of revenue frequency by quarter and a monthly layout of the selected range. Sales Salaries and Commissions as a Percentage of Revenue are Sales It is sales salaries plus commission expressed as a percentage of Total Revenuetotal revenue.
Calculation: (Salaries + Commissions) / Total Revenue
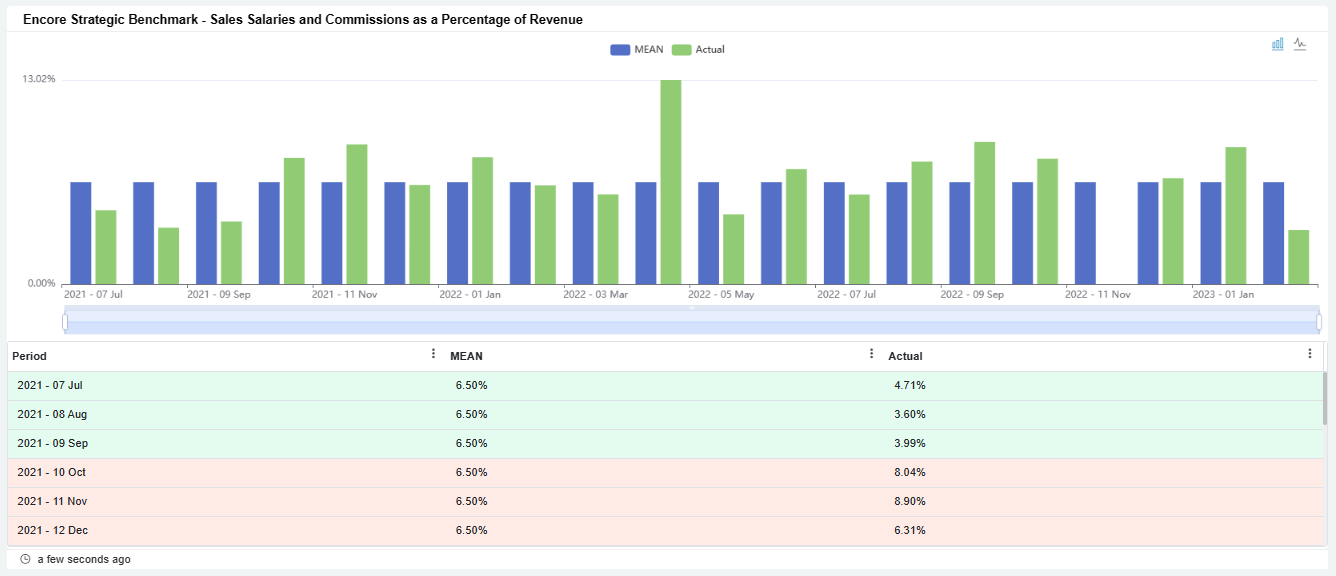
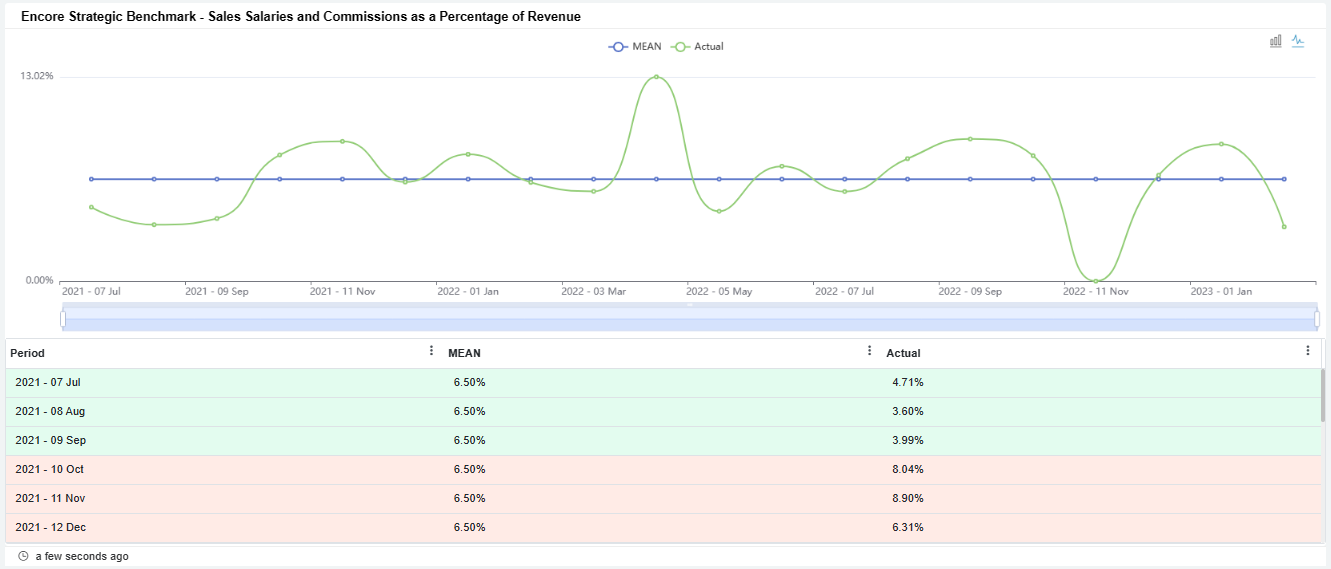
Data Source: Encore mapping
...
mapping
Account Groupings for Sales Salaries and Commissions as a Percentage of Revenue
- Salaries + Commissions
Account Category Account Subcategory Sales Expense
Salaries
Commissions
- Total Revenue
Account Group Account Category Account Subcategory Income
Product Sales
Hardware & Software
Cloud Resale
Special Product 1
Special Product 2
Recurring Service Revenues
Managed Services
BCDR
Security
Labor-Related Revenue
Block Hour Revenue
Time & Materials
Project Revenues
VOIP Revenue
Hardware As A Service Revenue
Miscellaneous Income
Returns & Allowances
Advertising and Marketing as a Percentage of
...
Revenue
...
The Advertising
...
A column chart showing Advertising and Marketing as a Percentage of Revenue frequency by metric shows a column chart with advertising and marketing as a percentage of revenue frequency by quarter and a monthly layout of the selected range. Advertising and Marketing as a Percentage of Revenue It is advertising expense plus marketing expense expressed as a percentage of Total Revenuetotal revenue.
Calculation: (Advertising + Marketing) / Total Revenue
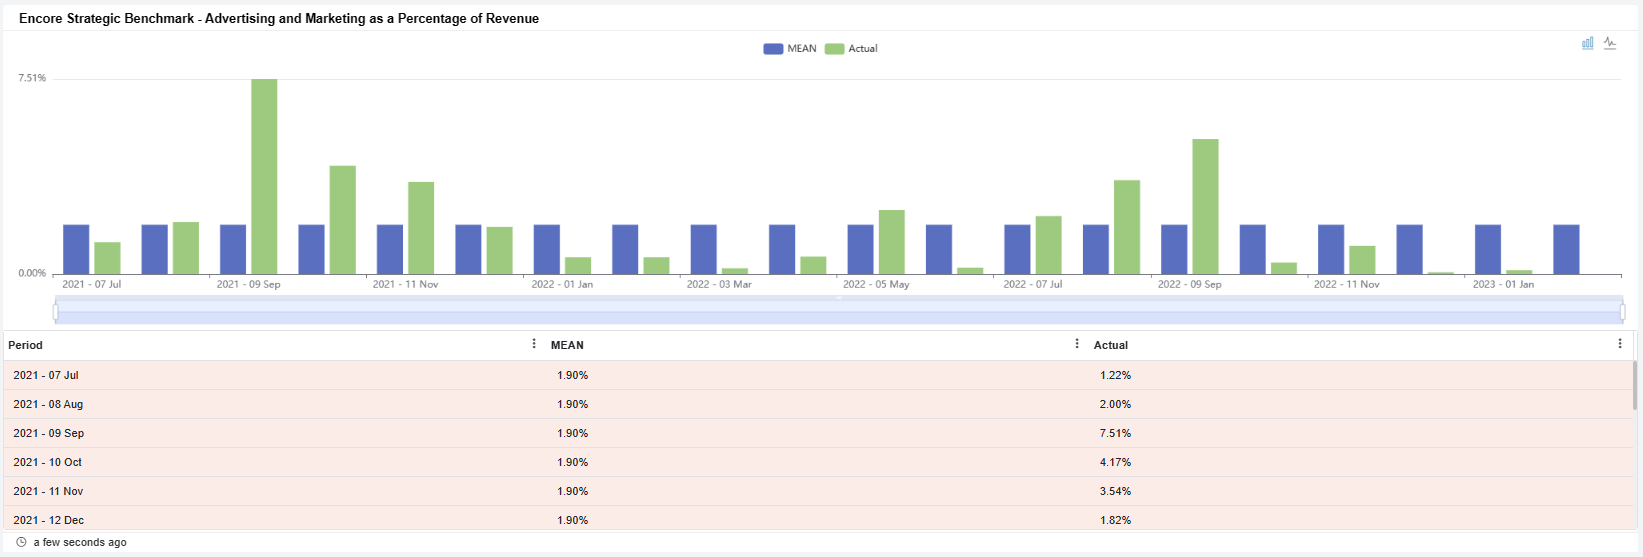
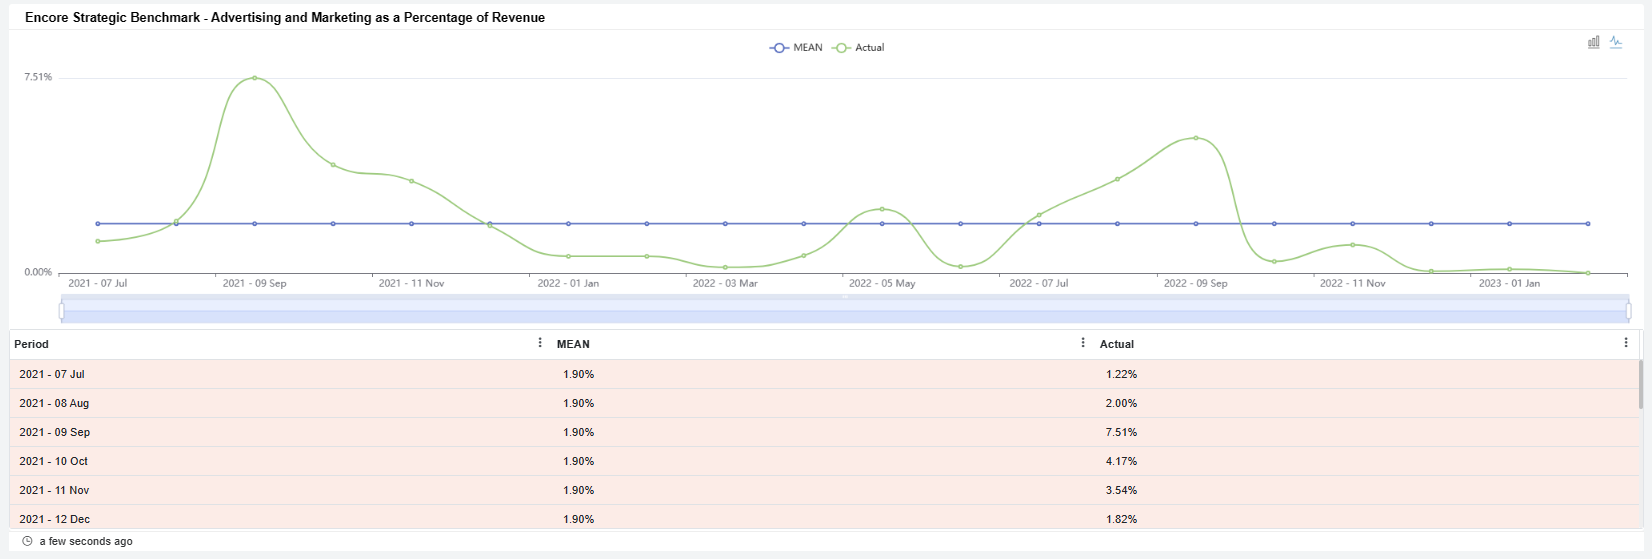
Data Source: Encore mapping
...
mapping
Account Grouping for Advertising and Marketing as a Percentage of Revenue
- Advertising + Marketing
Account Group Account Category Account Subcategory COGS - Cost of Goods Sold
Sales Expense
Marketing
Expenses
Advertising
- Total Revenue
Account Group Account Category Account Subcategory Income
Product Sales
Hardware & Software
Cloud Resale
Special Product 1
Special Product 2
Recurring Service Revenues
Managed Services
BCDR
Security
Labor-Related Revenue
Block Hour Revenue
Time & Materials
Project Revenues
VOIP Revenue
Hardware As A Service Revenue
Miscellaneous Income
Returns & Allowances
Admin as a Percentage of Revenue
...
The Admin as a Percentage of Revenue
...
A metric has a column chart showing Admin admin as a Percentage percentage of Revenue revenue frequency by quarter and a monthly layout of the selected range. Admin as a Percentage of Revenue is Admin Expenses It is admin expenses expressed as a percentage of Total Revenuetotal revenue.
Calculation: Total Admin Expenses / Total Revenue
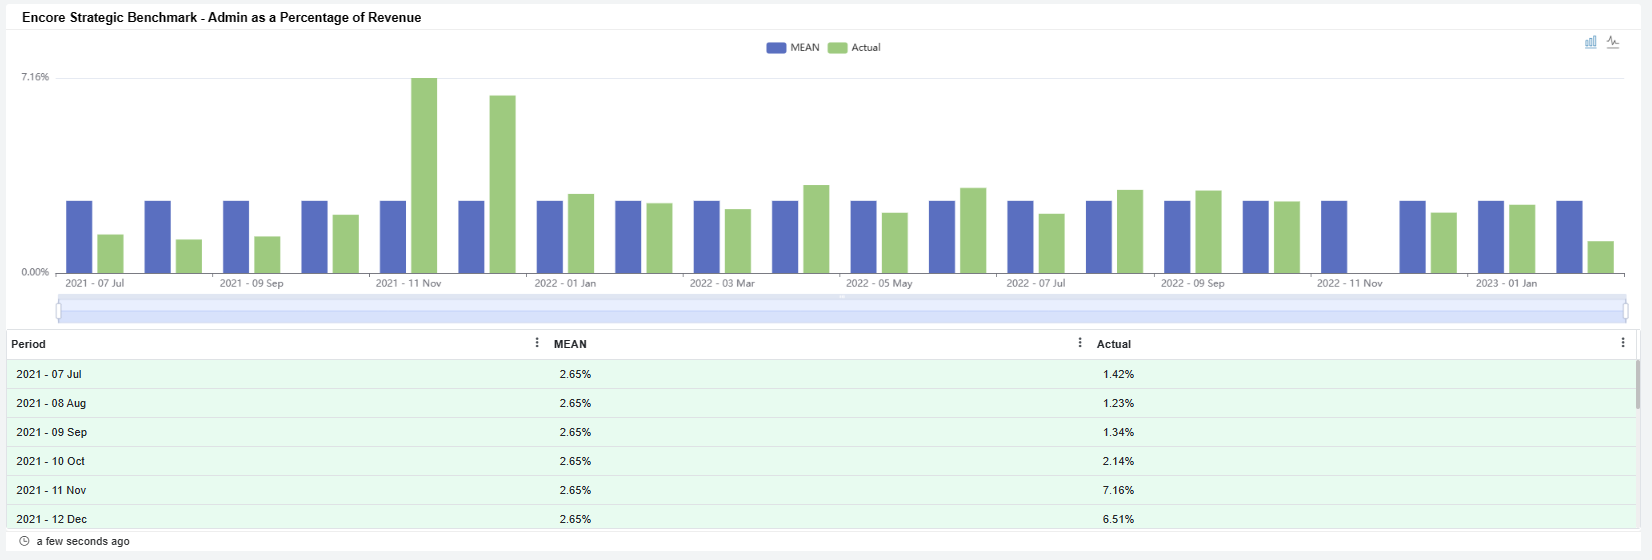
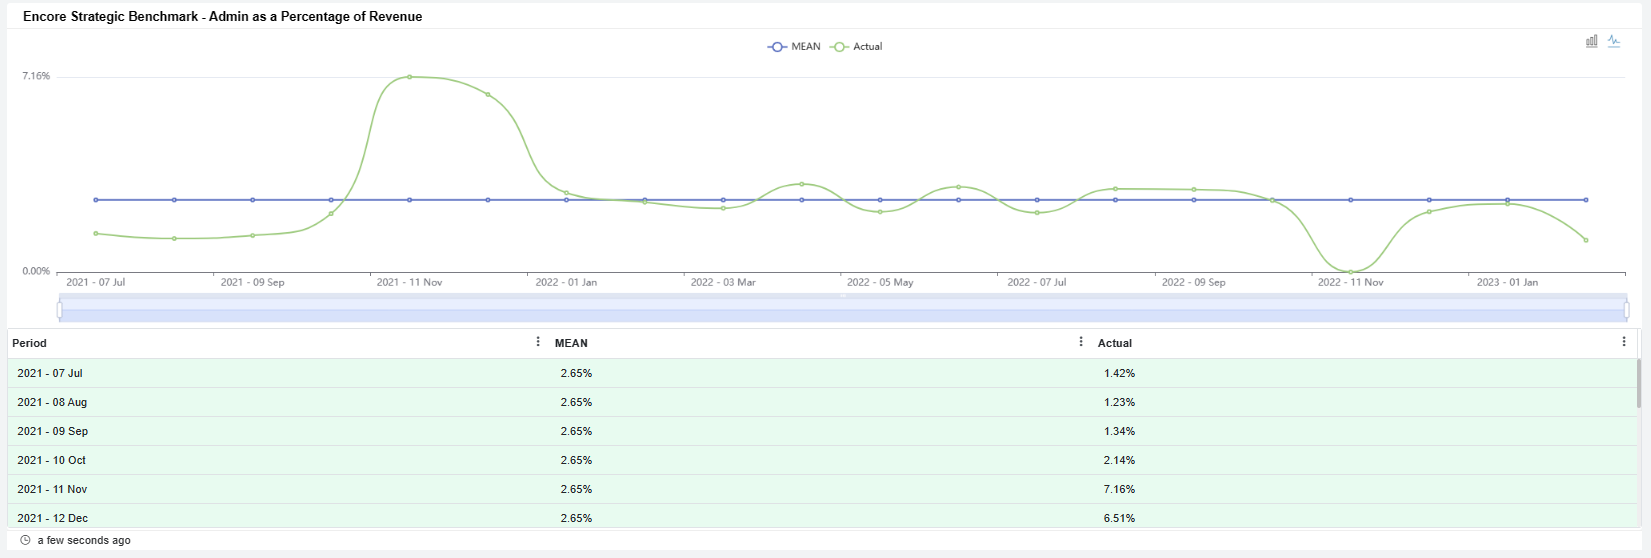
Data Source: Encore mapping
Gross Profit after sales expense
Account Groupings for Admin as a Percentage of Revenue
- Total Admin Expenses
Account Group Account Category Expenses
Salaries - Admin
- Total Revenue
Account Group Account Category Account Subcategory Income
Product Sales
Hardware & Software
Cloud Resale
Special Product 1
Special Product 2
Recurring Service Revenues
Managed Services
BCDR
Security
Labor-Related Revenue
Block Hour Revenue
Time & Materials
Project Revenues
VOIP Revenue
Hardware As A Service Revenue
Miscellaneous Income
Returns & Allowances
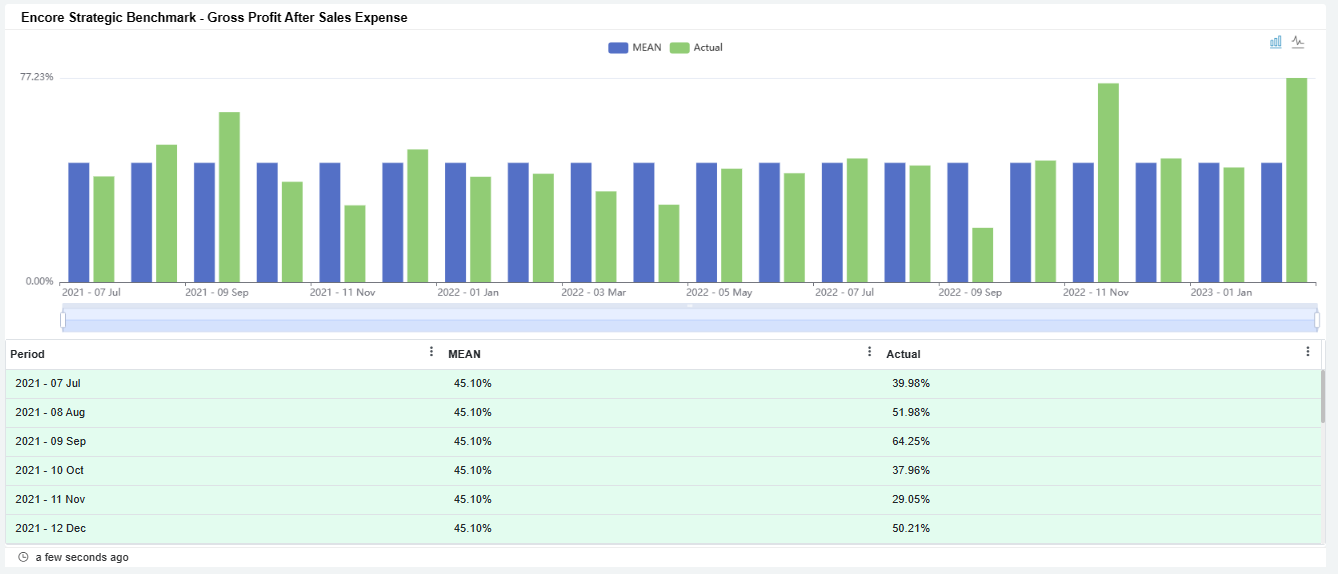
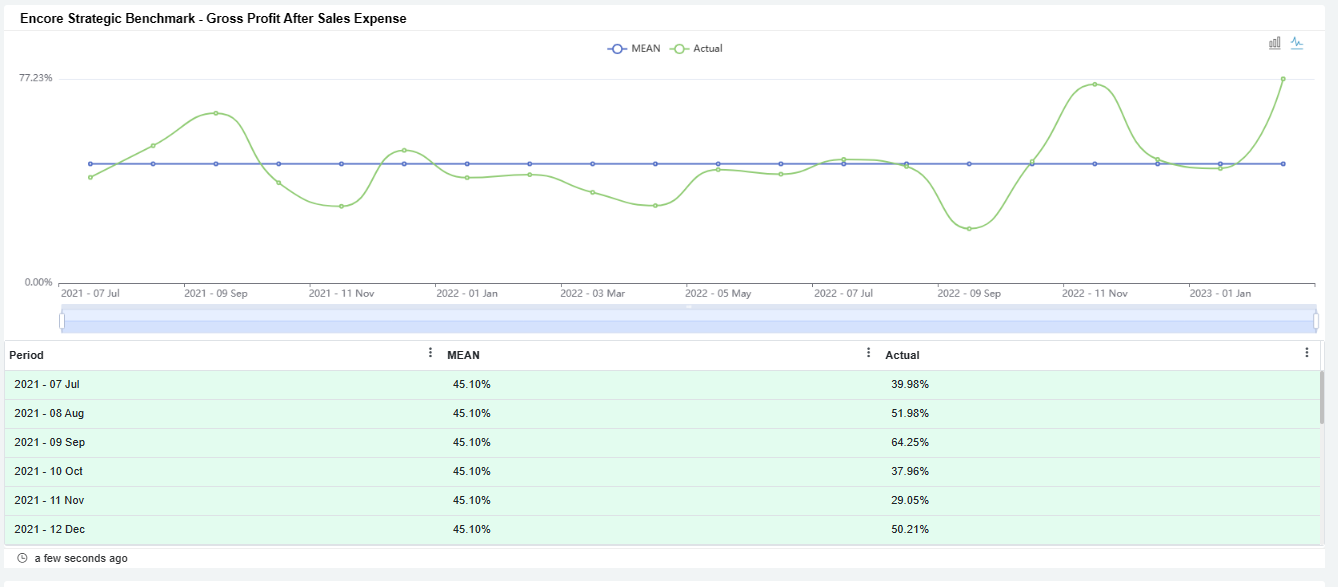
Gross Profit After Sales Expense
...
The Gross Profit After Sales Expense metric shows the Gross Profit After Sales Expense frequency by quarter and a A column chart showing Gross Profit after sales expense frequency by quarter and monthly layout of the selected range. Gross Profit after sales expense is It is the Total Revenue less the Total Cost of goods sold minus sales expenses.
Calculation: (Total Revenue - COGS) - Sales Expenses Expenses
Data Source: Encore mapping
Service Revenue per Service Person
mapping
Account Groupings for Gross Profit After Sales Expense
- Total Revenue
Account Group Account Category Account Subcategory Income
Product Sales
Hardware & Software
Cloud Resale
Special Product 1
Special Product 2
Recurring Service Revenues
Managed Services
BCDR
Security
Labor-Related Revenue
Block Hour Revenue
Time & Materials
Project Revenues
VOIP Revenue
Hardware As A Service Revenue
Miscellaneous Income
Returns & Allowances
- COGS
Account Group Account Category Account Subcategory COGS - Cost of Goods Sold
Product COGS
Hardware & Software Costs
Cloud Resale COGS
Special Product 1
Special Product 2
Recurring Service COGS
Managed Services Costs
BCDR
Security Costs
Labor Costs
Technician Salaries
Technician Payroll Taxes
Technician Benefits
Project Costs
VOIP Costs
Hardware As A Service Costs
Sales Expense
Salaries
Commissions
Marketing
Travel and Lodging
Training
Other
Service Revenue per Service Person
...
The metric Service Revenue per Service Person is a column chart showing the frequency of Service Revenue per Service Person by quarter and a A column chart showing Service Revenue per Service Person frequency by quarter and monthly layout of the selected range. Service Revenue per Service Person is a ratio that roughly It measures service revenue generated by each service person.
Calculation: Service Revenue / Service Person Count
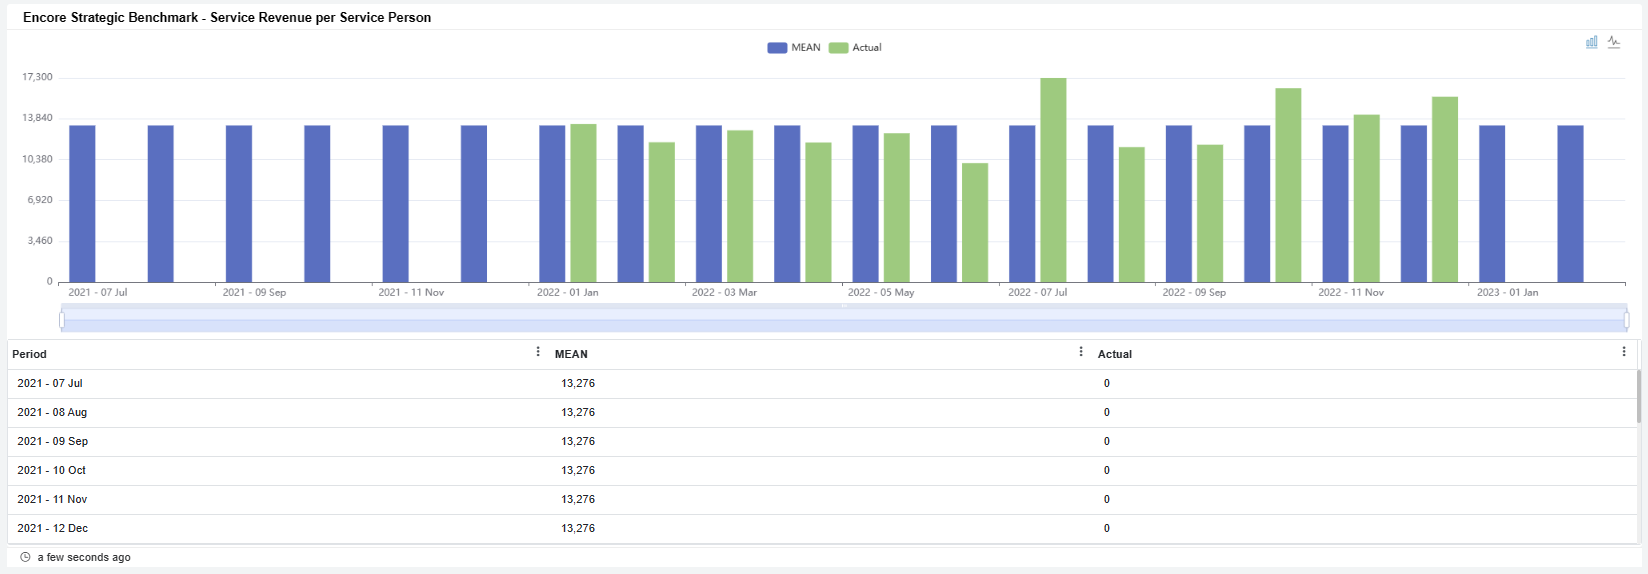
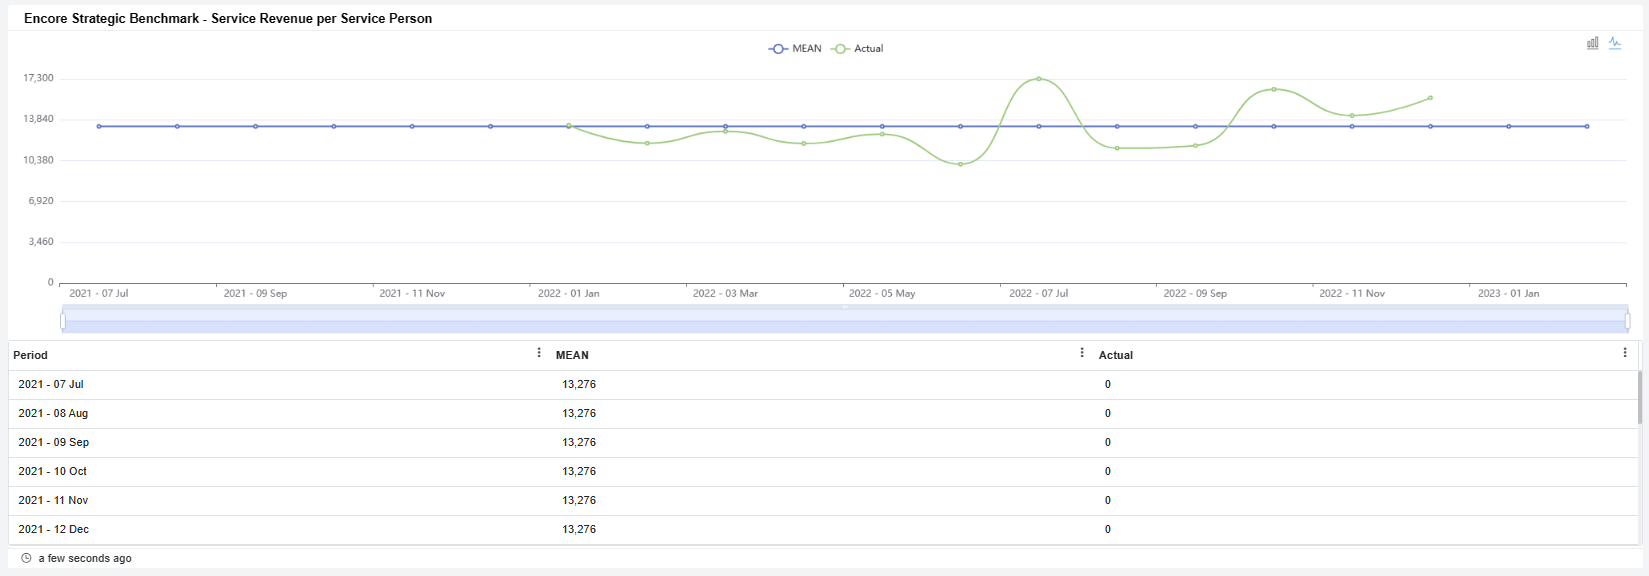
Data Source: Encore mapping for Service Revenue and Encore Settings for Service Person Count
Account Grouping for Service Revenue per Service Person*
- Service Revenue
Account Category Account Subcategory Recurring Service Revenues
Managed Services
BCDR
Security
Labor-Related Revenue
Block Hour Revenue
Time & Materials
Project Revenues
VOIP Revenue
Hardware As A Service Revenue
*Service Person Count
...
represents the calculated average of Service Employee Headcount from the Encore Benchmarking Employee Headcount Form within the specified reporting period.
Revenue per Employee
...
The metric
Revenue per Employee
...
A is a column chart showing Revenue Revenue per Employee frequency by quarter and a monthly layout of the selected range. Revenue per Employee is a it is the ratio that roughly measures revenue generated by each employee.
CalculationCalculation: Revenue / Employee CountCount
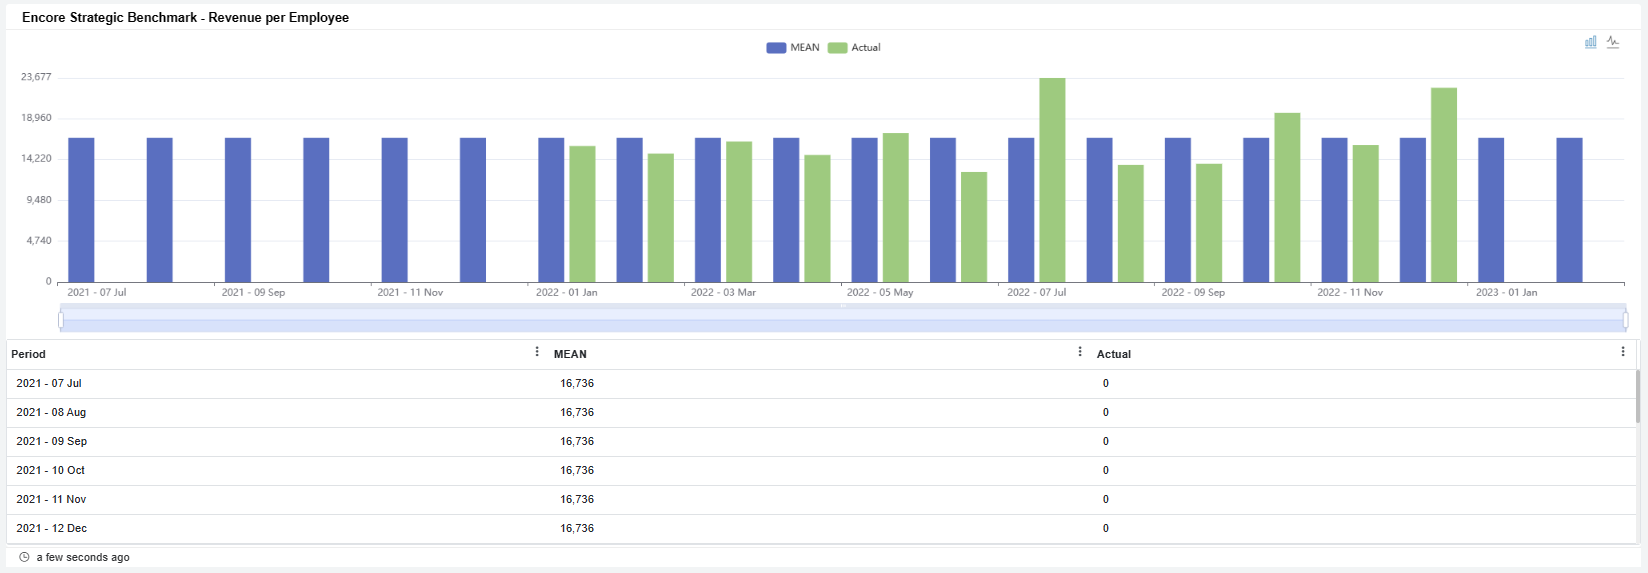
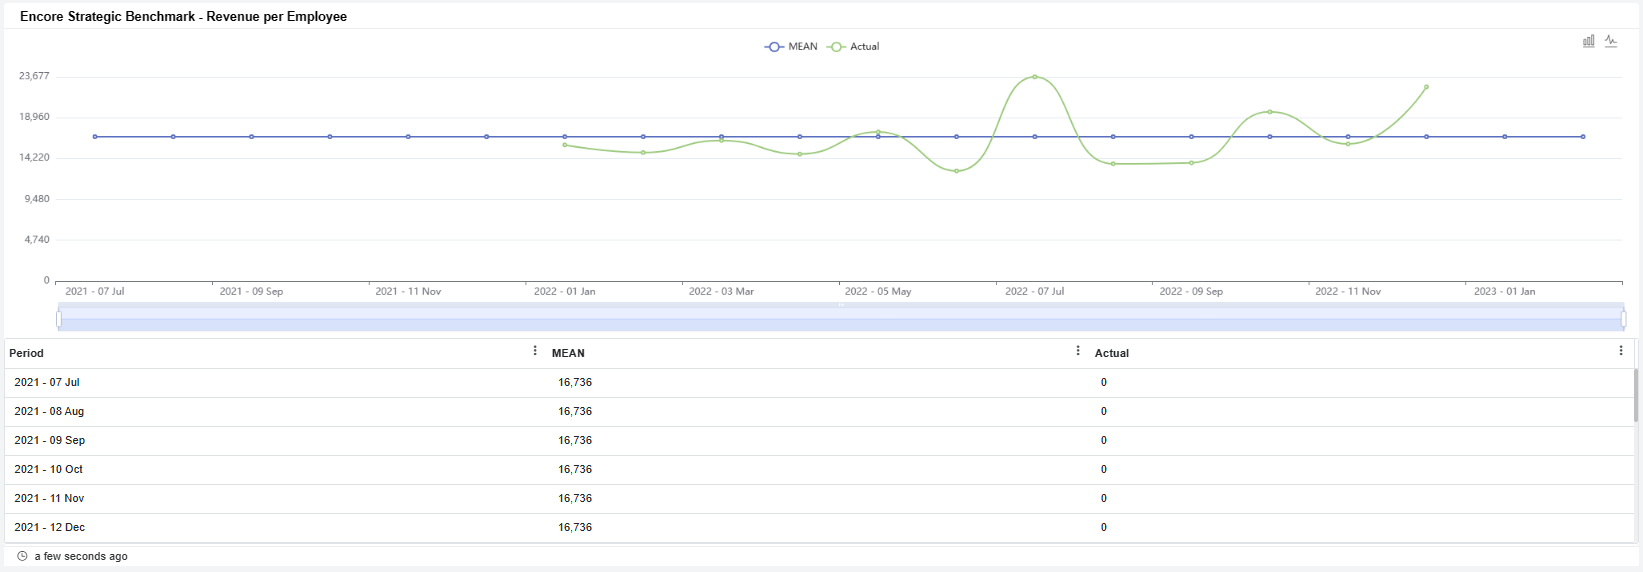
Data Source: Encore mapping for Revenue and Encore Settings for Employee Count
Account Grouping for Revenue per Employee
- Revenue
Account Group Account Category Account Subcategory Income
Product Sales
Hardware & Software
Cloud Resale
Special Product 1
Special Product 2
Recurring Service Revenues
Managed Services
BCDR
Security
Labor-Related Revenue
Block Hour Revenue
Time & Materials
Project Revenues
VOIP Revenue
Hardware As A Service Revenue
Miscellaneous Income
Returns & Allowances
Employee Count
...
represents the calculated average of Service Employee, Sales, and Admin Headcount totals from the Encore Benchmarking Employee Headcount Form within the specified reporting period.
Net Operating Income Anchor netoperatingincome netoperatingincome
| netoperatingincome | |
| netoperatingincome |
...
The metric Net Operating Income shows net operating income percentages by quarter and a
Net Operating Profit Per employee
A column chart showing Net Operating Profit Per employee frequency by quarter and monthly layout of the selected range.
Net Operating Profit Per employee is a ratio that roughly measures Net Operating Profit generated by each employee.
Calculation: (Revenue - (COGS + Expense + Depreciation + Amortization)) / Employee Count
It is Total Revenue minus Cost of Goods Sold(COGS), Expenses, Depreciation, and Amortization.
Calculation: Total Revenue – (COGS + Expense - Taxes)
Data Source: Encore mapping for Net Operating Profit and Encore Settings for Employee Count
Net Operating Income
mapping
Account Groupings for Net Operating Income
- Total Revenue
Account Group Account Category Account Subcategory Income
Product Sales
Hardware & Software
Cloud Resale
Special Product 1
Special Product 2
Recurring Service Revenues
Managed Services
BCDR
Security
Labor-Related Revenue
Block Hour Revenue
Time & Materials
Project Revenues
VOIP Revenue
Hardware As A Service Revenue
Miscellaneous Income
Returns & Allowances
- COGS
Account Group Account Category Account Subcategory COGS - Cost of Goods Sold
Product COGS
Hardware & Software Costs
Cloud Resale COGS
Special Product 1
Special Product 2
Recurring Service COGS
Managed Services Costs
BCDR
Security Costs
Labor Costs
Technician Salaries
Technician Payroll Taxes
Technician Benefits
Project Costs
VOIP Costs
Hardware As A Service Costs
Sales Expense
Salaries
Commissions
Marketing
Travel and Lodging
Training
Other
- Expenses
Account Group Account Category Account Subcategory Expenses
Computer and Internet
Continuing Education
Dues and Subscriptions
Employee Benefits
Insurance
Legal and Professional
Licenses and Permits
Miscellaneous
Office Expense
Officer Salaries
Repairs and Maintenance
Salaries - Admin
Printing
Accounting
Advertising
Automobile Expense
Bank charges
Books and publications
Contributions
Postage and Delivery
Rent
Telephone
Travel
Utilities
Website
Meals & Entertainment
Taxes
Taxes - Business
Taxes - Payroll
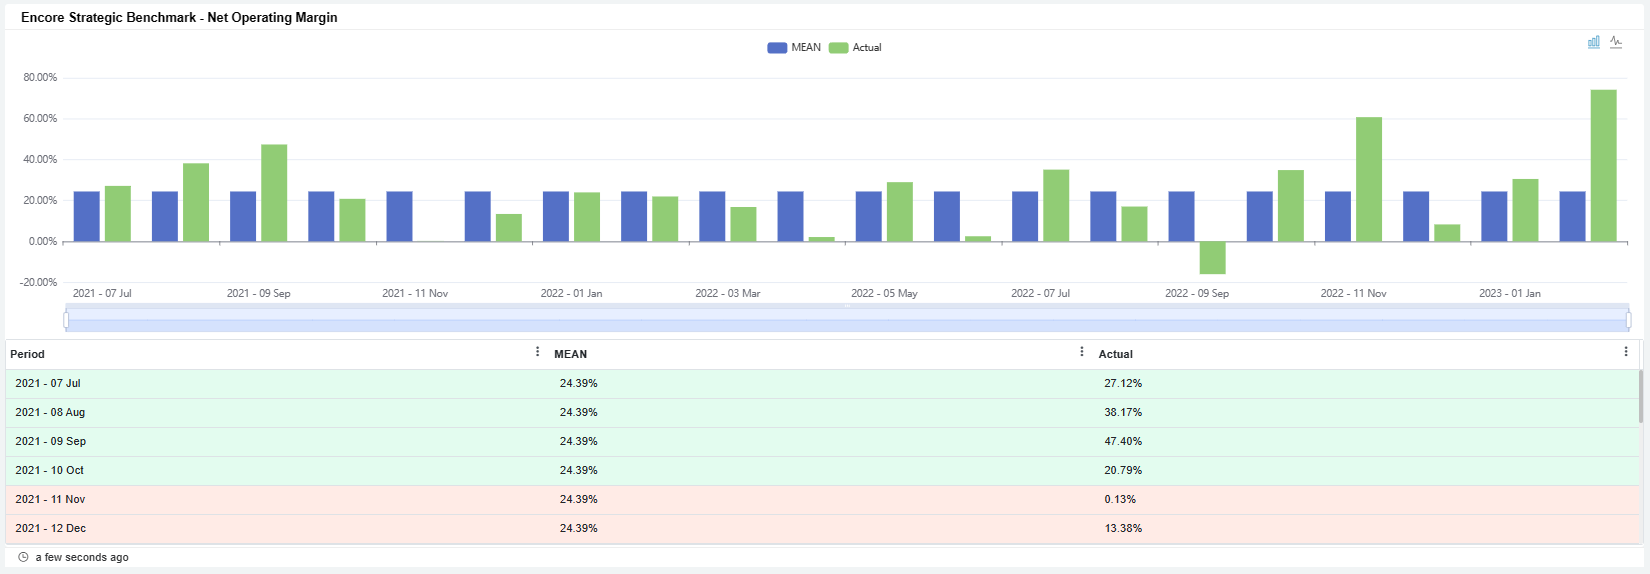
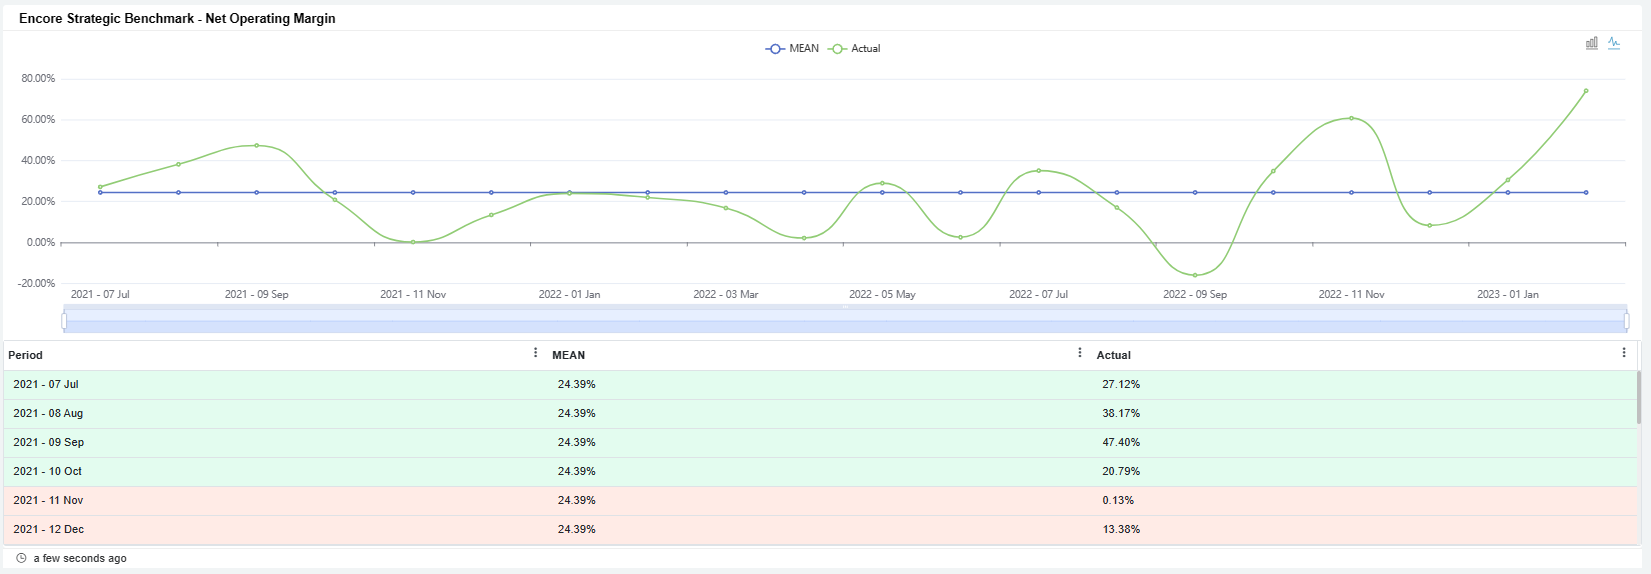
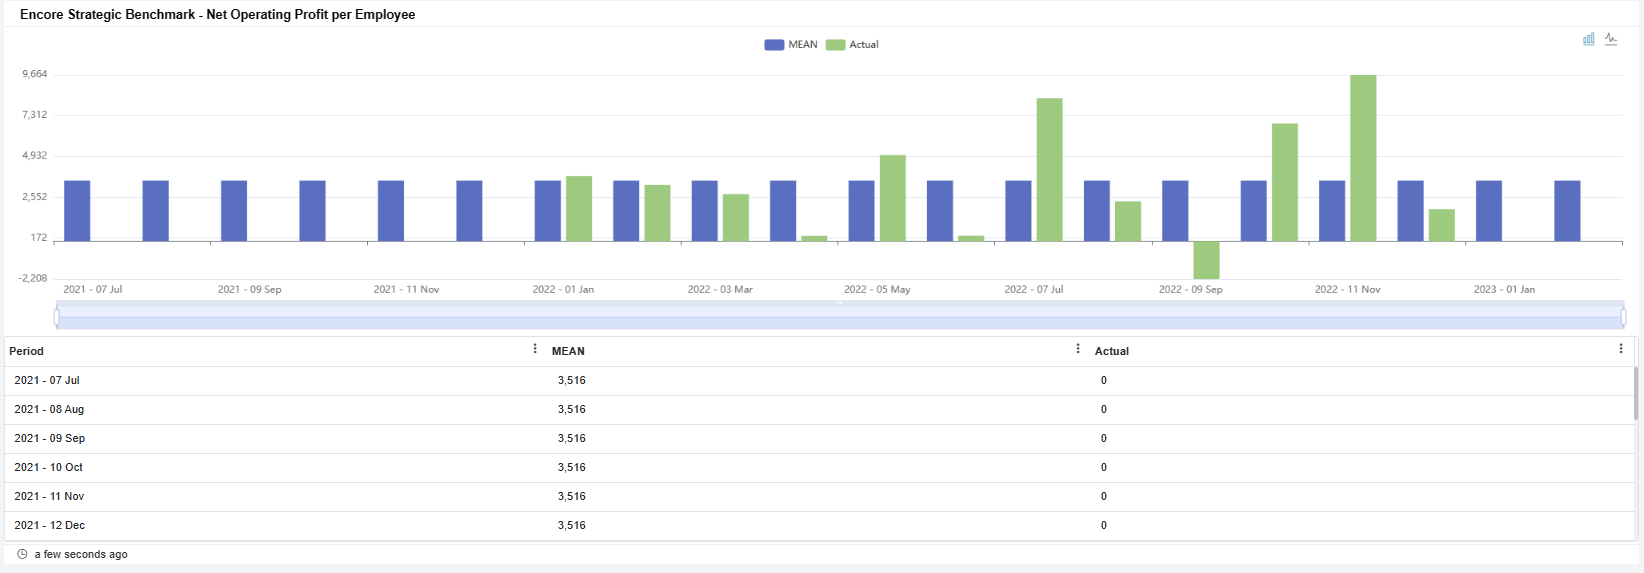
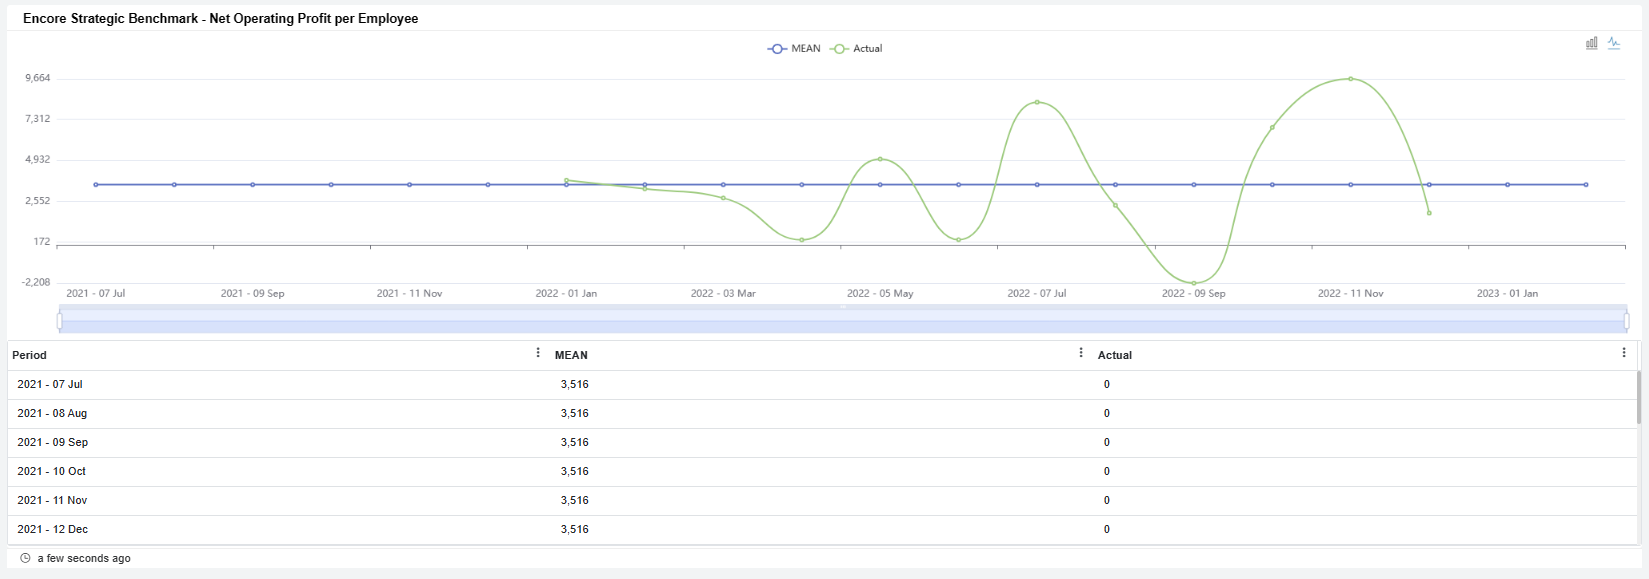
Net Operating Profit per Employee
...
The metric Net Operating Profit per Employee shows a chart with each employee's net operating profit frequency by quarter and a A column chart showing Net Operating Income percentages by quarter and monthly layout of the selected range.
Net Operating Income is Total Revenue minus Cost of Goods Sold(COGS),Expenses,Depreciation and Amortization.
It is the ratio that roughly measures net operating profit generated by each employee.
Calculation: Net Operating Income / Employee Count
Calculation: Revenue - (COGS + Expense + Depreciation + Amortization)
Data Source: Encore mapping
...
for Net Operating Profit and Encore Settings for Employee Count
Days Sales Outstanding (DSO)
...
...
The metric A column chart showing Days Sales Outstanding displays a column chart with the sales outstanding in days for the current calendar period Days Sales Outstanding . It is a measure of the average number of days that it takes a company to collect payment for a sale.
Calculation: DSO = (Average Accounts Receivable / Total Revenue) * 365 Average Accounts Receivable = (Accounts Receivable Beginning + Accounts Receivable End)/2number of days in the specified reporting period
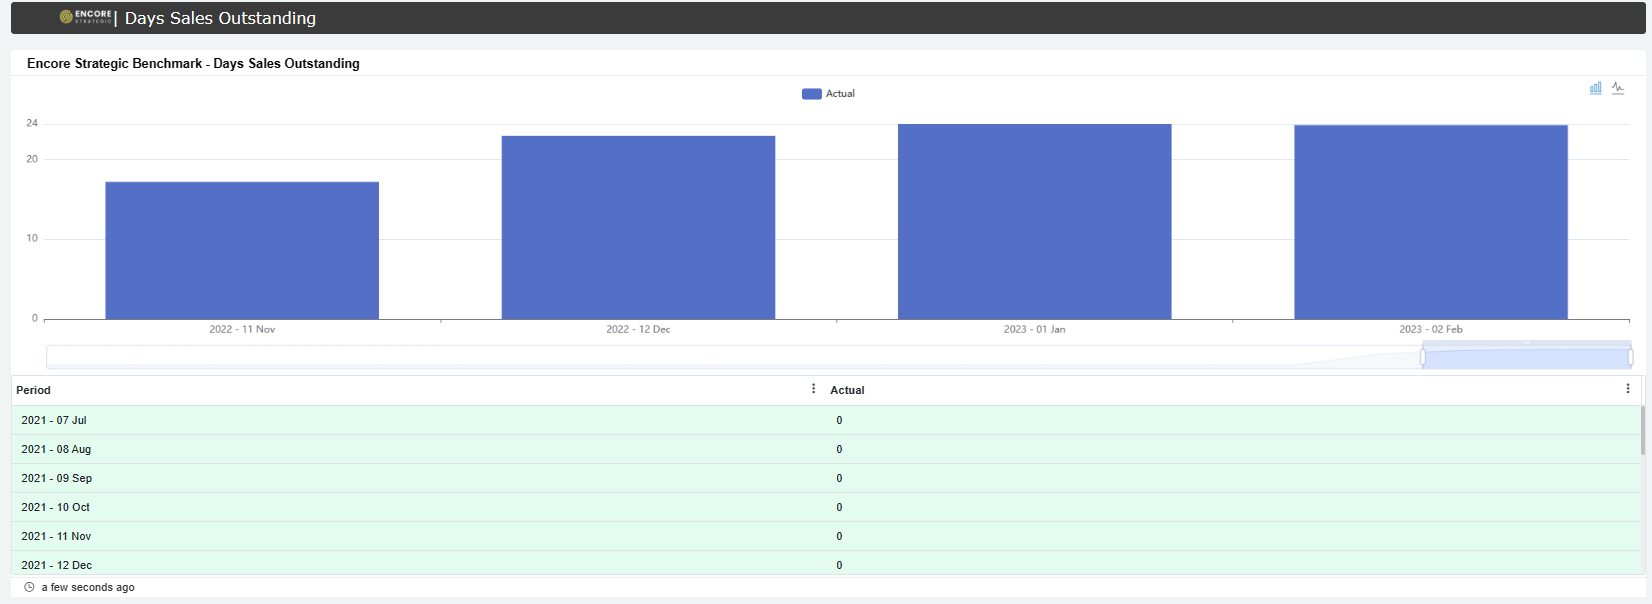
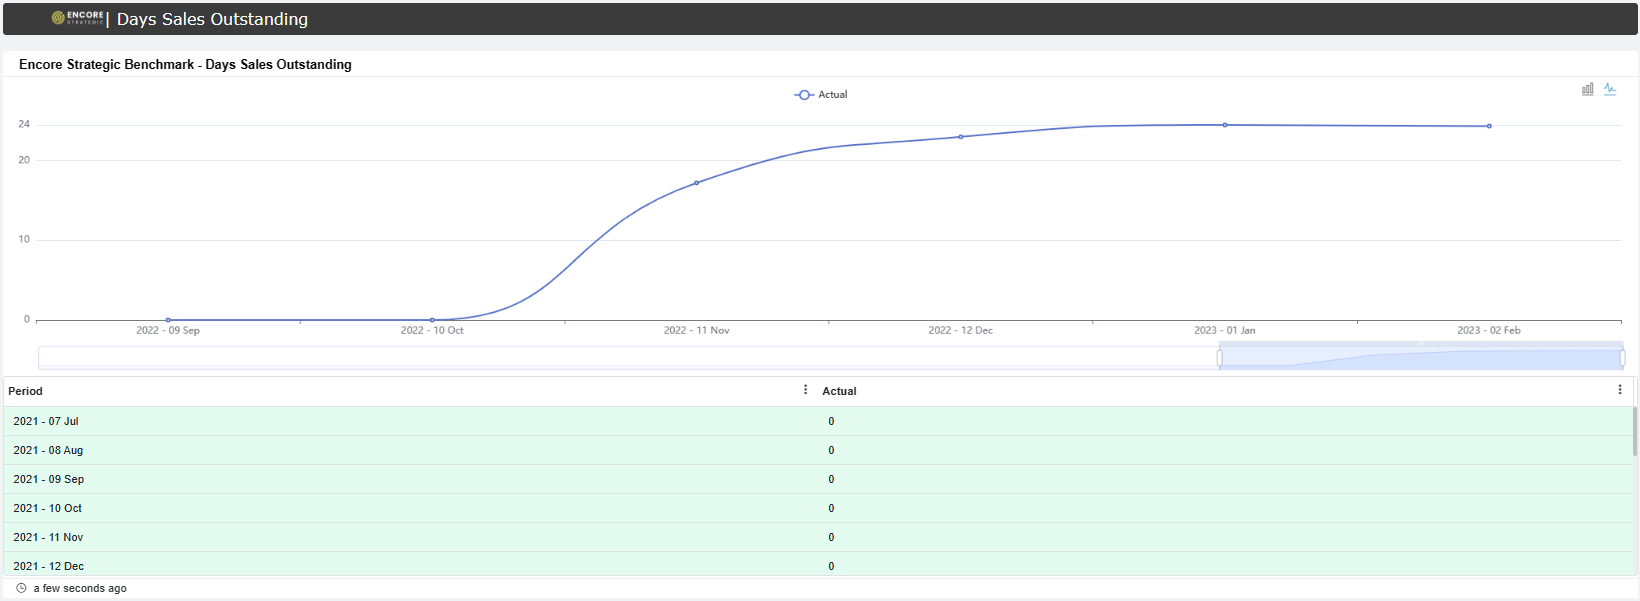
Data Source: Encore mappingmapping
Account Grouping for DSO
- Accounts Receivable
Account Category Account Subcategory Accounts receivable (A/R)
Accounts receivable
- Total Revenue
Account Group Account Category Account Subcategory Income
Product Sales
Hardware & Software
Cloud Resale
Special Product 1
Special Product 2
Recurring Service Revenues
Managed Services
BCDR
Security
Labor-Related Revenue
Block Hour Revenue
Time & Materials
Project Revenues
VOIP Revenue
Hardware As A Service Revenue
Miscellaneous Income
Returns & Allowances
Related Topics
...
| Content by Label | ||||||||||
|---|---|---|---|---|---|---|---|---|---|---|
|
Overview
Content Tools