 N O T I C E
MSPbots WIKI is moving to a new home at support.mspbots.ai![]() to give you the best experience in browsing our Knowledge Base resources and addressing your concerns. Click here
to give you the best experience in browsing our Knowledge Base resources and addressing your concerns. Click here![]() for more info!
for more info!
Page History
The AgreeThis app package contains dashboards with different views on active and closed tickets as well as important KPIs used to gauge the team's effectiveness in resolving tickets. The widgets included will enable users to monitor day-to-day team performance and can be used for business reviews to provide insights.
Table of Contents
List of Dashboards
Dashboard Name | Description |
|---|---|
| Active Tickets Summary | This dashboard shows the count of active tickets (non-child and non-internal) per board, per status, and per date created. In addition, it gives full visibility of ageing tickets with respect to creation date and date of last update. |
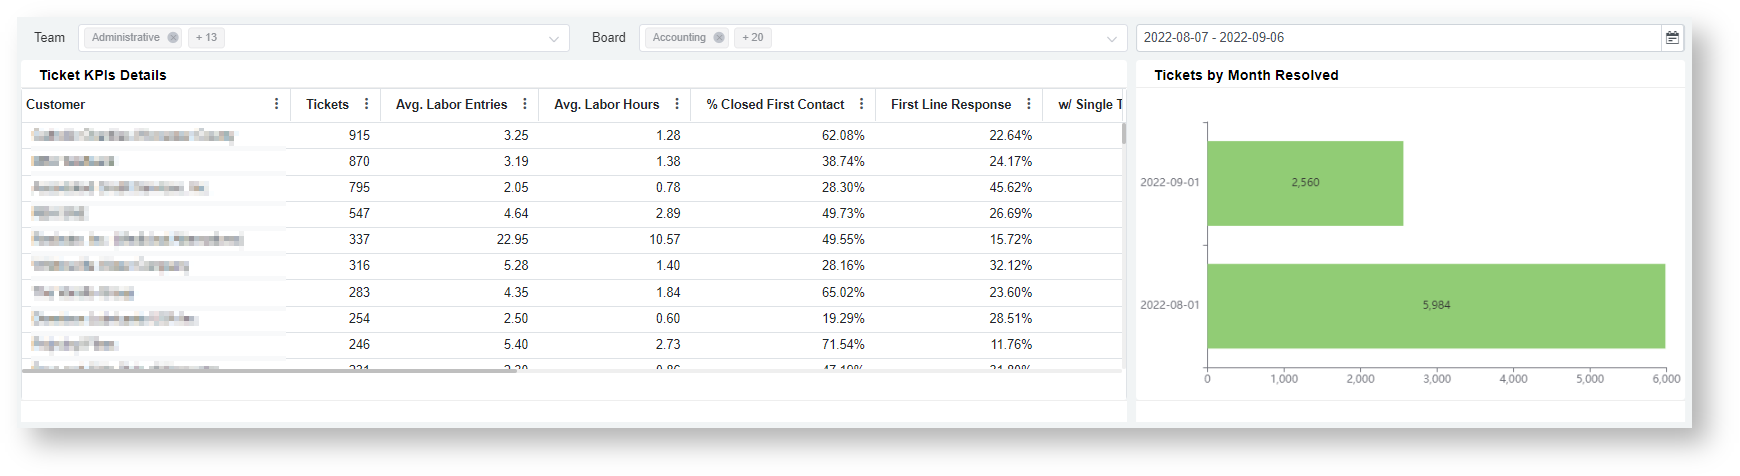
| Ticket KPIs |
| This dashboard shows the monthly trend of relevant KPIs for open and closed tickets (non-child and non-internal) such as Ave. Time to Respond and Ave. Time to Resolve. All of these are also shown per customer for easy investigation. | |
| Tickets Resolved - Technician Efficiency | This dashboard gives an overview on count and daily rate of Tickets Resolved for the selected date range. Also shows the % of tickets resolved by First Line Response. |
| Tickets Opened-Closed Same Day | This dashboard shows the count and percentage of tickets that were opened and closed on the same day as well as their weekly trend for the selected date range. |
| Ticket Labor Analysis | This dashboard compares the total ticket count with the total labor hours on a per company, board, and subtype level. It also shows their monthly trend for the selected date range. |
Terms and Calculations
Terms | Definition/Calculation |
|---|
Last Activity
Tickets Summary - Ticket KPIs
This dashboard provides an overview of all projects so that stakeholders can easily monitor their progress and provide timely support. It shows the Cost Performance Index (CPI), % of on track in terms of delivery date and budget hours, and breakdown of projects per status, customer, manager.
Available slicers are: Status, Project Manager, and Project Type
Tickets Summary - Ticket Daily Stats
The table in this dashboard allows users to deep dive on specific projects or customers and see more details that affect the project completion such as % Budget Remaining, Start Date, and Scheduled Date.
Available slicers are: Status, Project Manager, and Project Type
Tickets Summary - Ticket Labor Analysis
The table in this dashboard allows users to deep dive on specific projects or customers and see more details that affect the project completion such as % Budget Remaining, Start Date, and Scheduled Date.
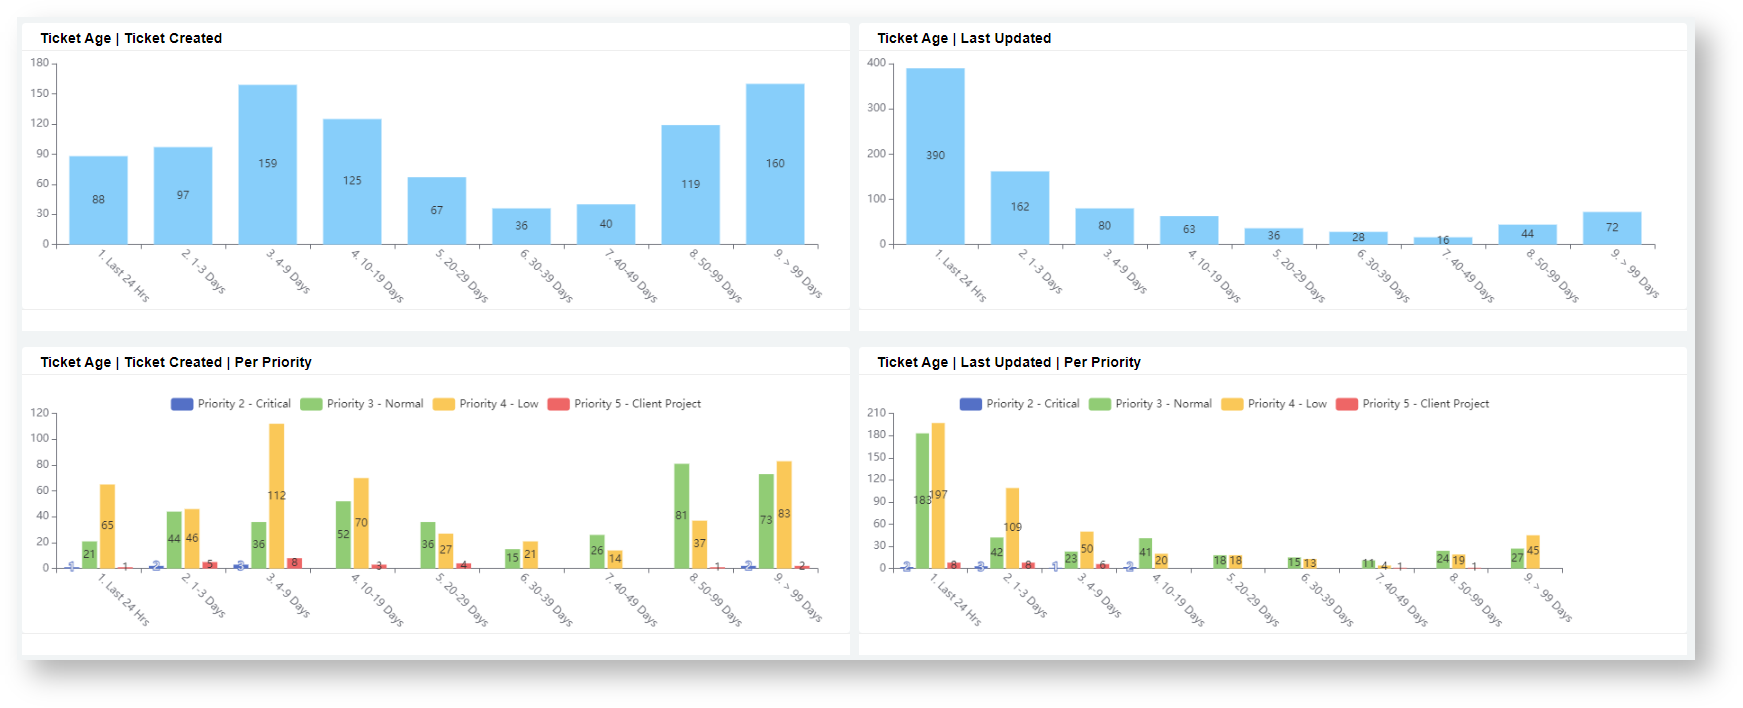
| Ticket Age | For active tickets (non-child and non-internal), calculated as (Current Date - Ticket Created Date) or (Current Date - Last Updated Date) |
| Tickets Resolved | Count of all tickets (non-child and non-internal) with a Date Resolved timestamp |
| Average Labor Entries | Average count of time entries per ticket (non-child and non-internal) |
| Average Labor Hours | Average number of hours recorded per ticket (non-child and non-internal) |
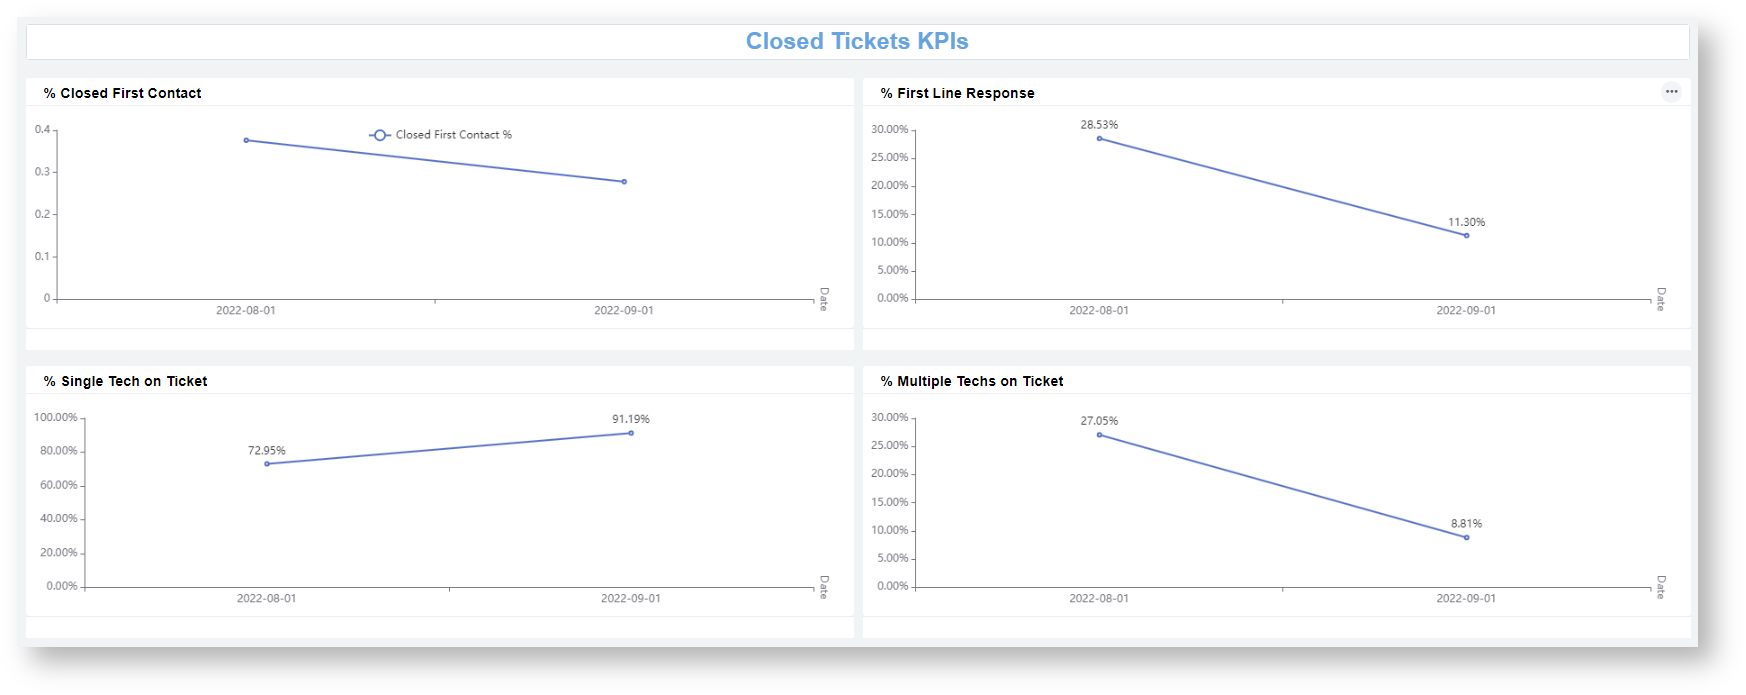
| Closed First Contact | Closed tickets (non-child and non-internal) that only have 1 or 0 recorded time entry. Excludes time entries with less than 3 minutes and those with no technician assigned. |
| First Line Response | Closed tickets (non-child and non-internal) that only have 1 recorded time entry. Excludes time entries with less than 3 minutes and those with no technician assigned. |
| Single Technician on Ticket | Closed tickets (non-child and non-internal) with only 1 or no technician that logged time. Excludes time entries with less than 3 minutes |
| Multiple Technician on Ticket | Closed tickets (non-child and non-internal) with 2 or more technicians that logged time. Excludes time entries with less than 3 minutes |
| Reopened Tickets | Tickets (non-child and non-internal) that were reopened, meaning it was tagged as closed at one point but was changed to open/in-progress again. |
| Avg. Time to First Time Entry | Average number of hours it takes before the first time entry is recorded per ticket (non-child and non-internal) |
| Avg. Time to Respond | Average Respond time (in Hrs) per ticket (non-child and non-internal). Data is from ConnectWise Manage internal SLA |
| Avg. Time to Resolution Plan | Average Resolution Plan time (in Hrs) per ticket (non-child and non-internal). Data is from ConnectWise Manage internal SLA |
| Avg. Time to Resolve | Average Resolve time (in Hrs) per ticket (non-child and non-internal). Data is from ConnectWise Manage internal SLA |
| Opened/Closed Same Day | Tickets with same date opened and date closed |
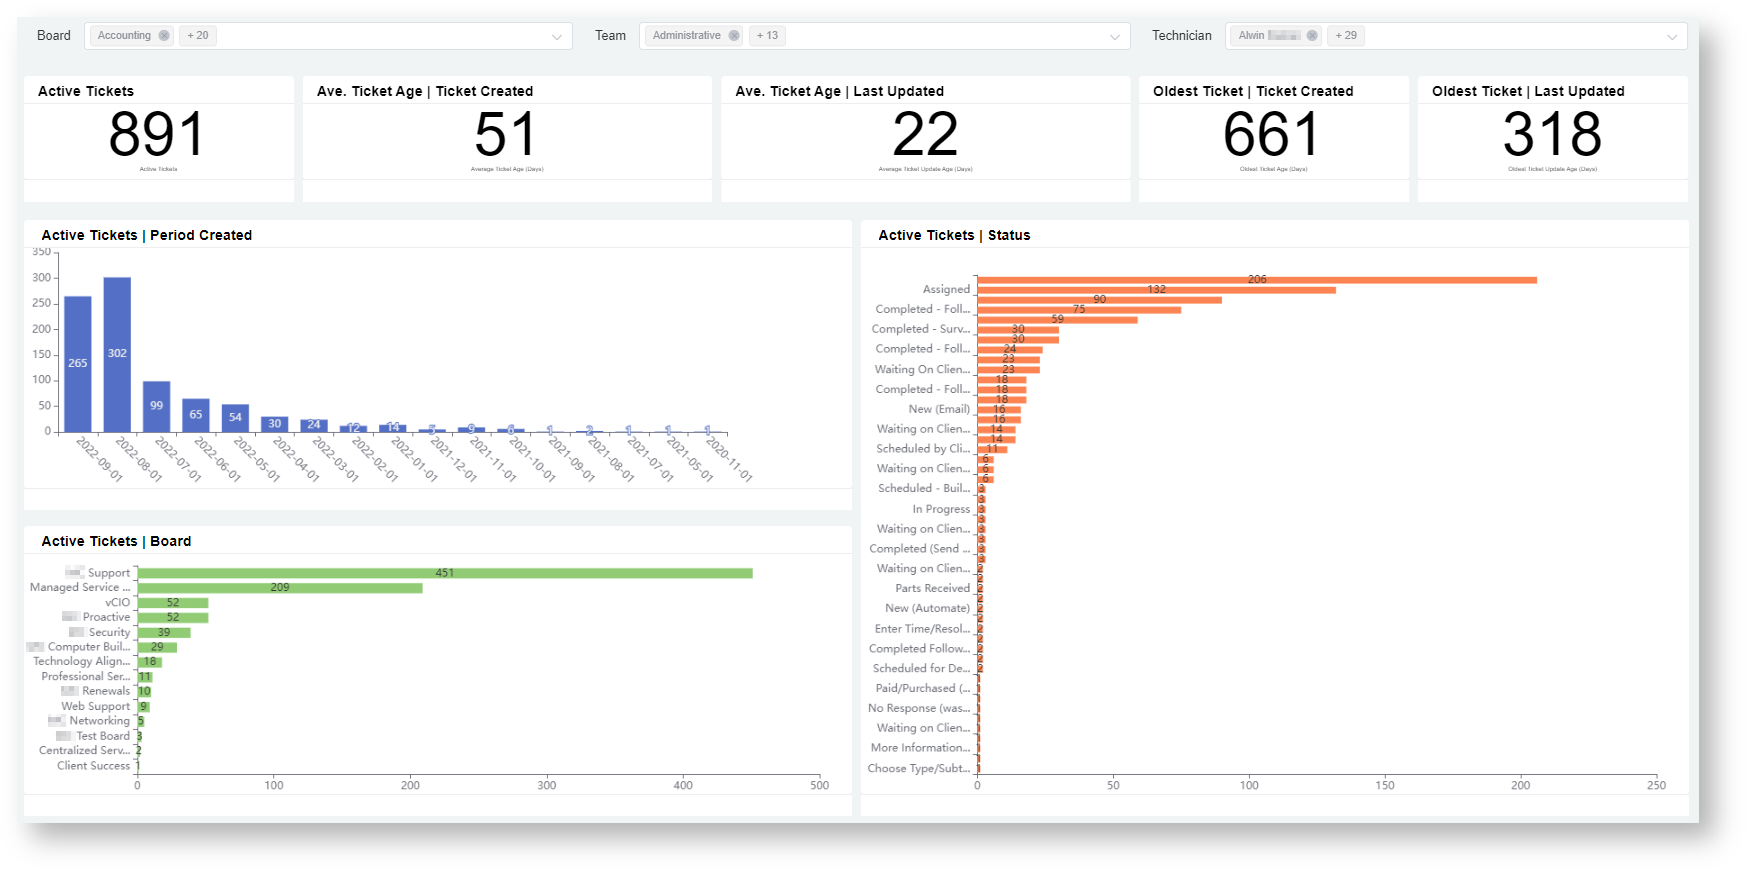
Active Tickets Summary
This dashboard shows the count of active tickets (non-child and non-internal) per board, per status, and per date created. In addition, it gives full visibility of ageing tickets with respect to creation date and date of last update.
Available slicers are: Board, Team, Technician, and Date Range
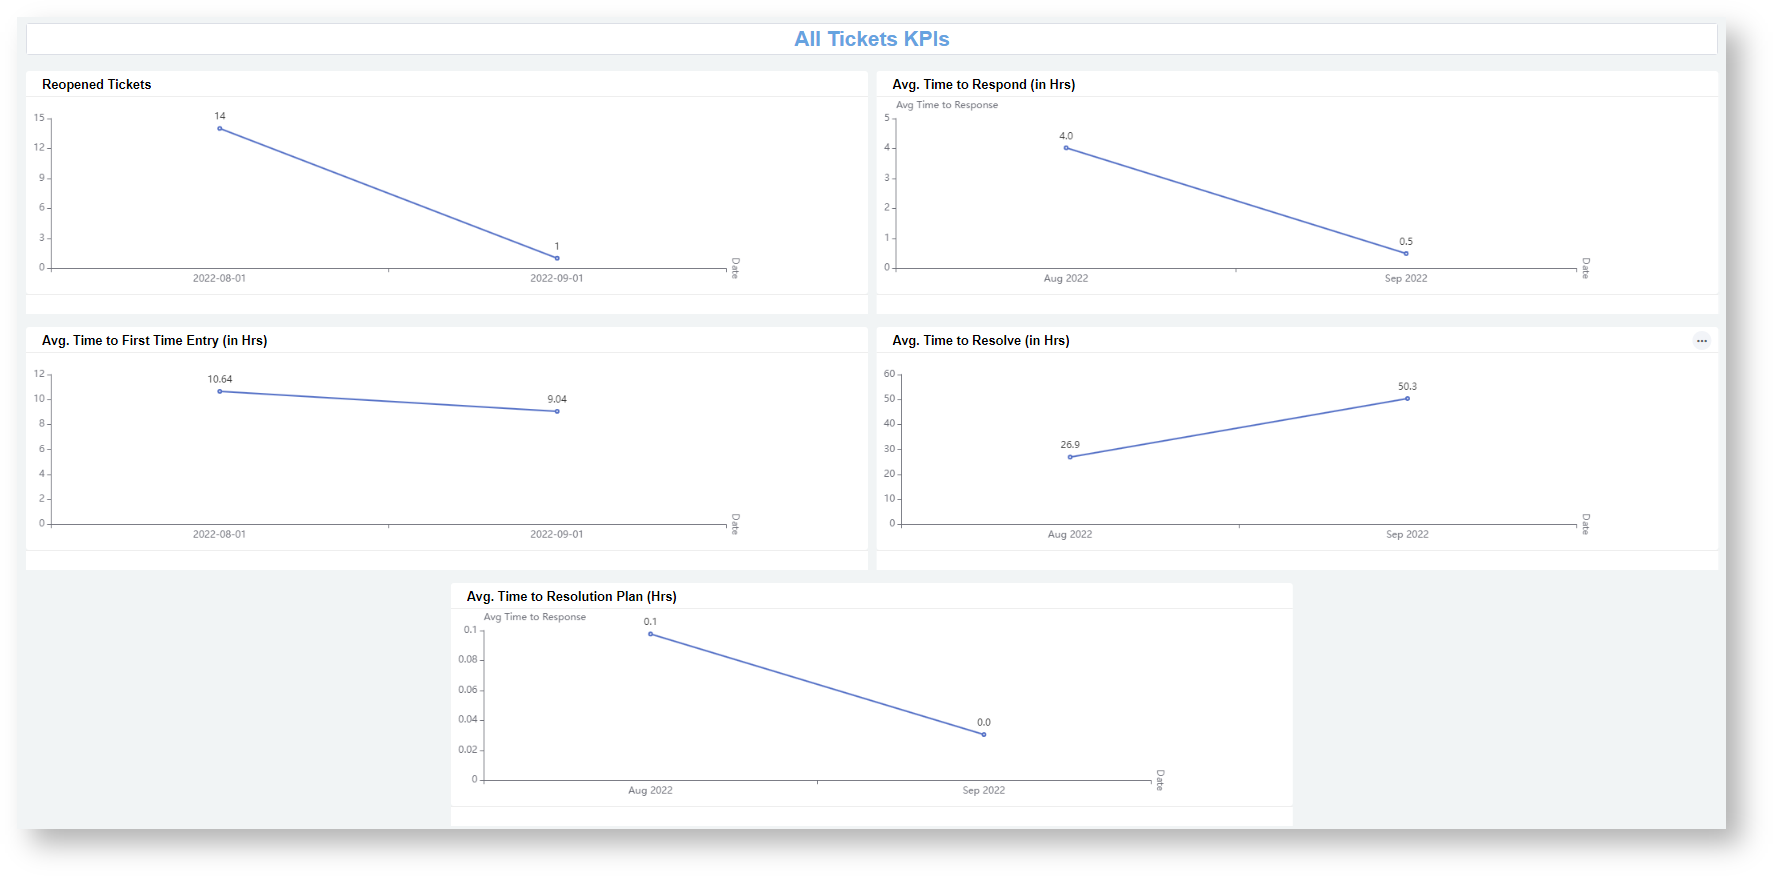
Ticket KPIs
This dashboard shows the monthly trend of relevant KPIs for open and closed tickets (non-child and non-internal) such as Ave. Time to Respond and Ave. Time to Resolve. All of these are also shown per customer for easy investigation.
Available slicers are: Board, Team, and Date Range
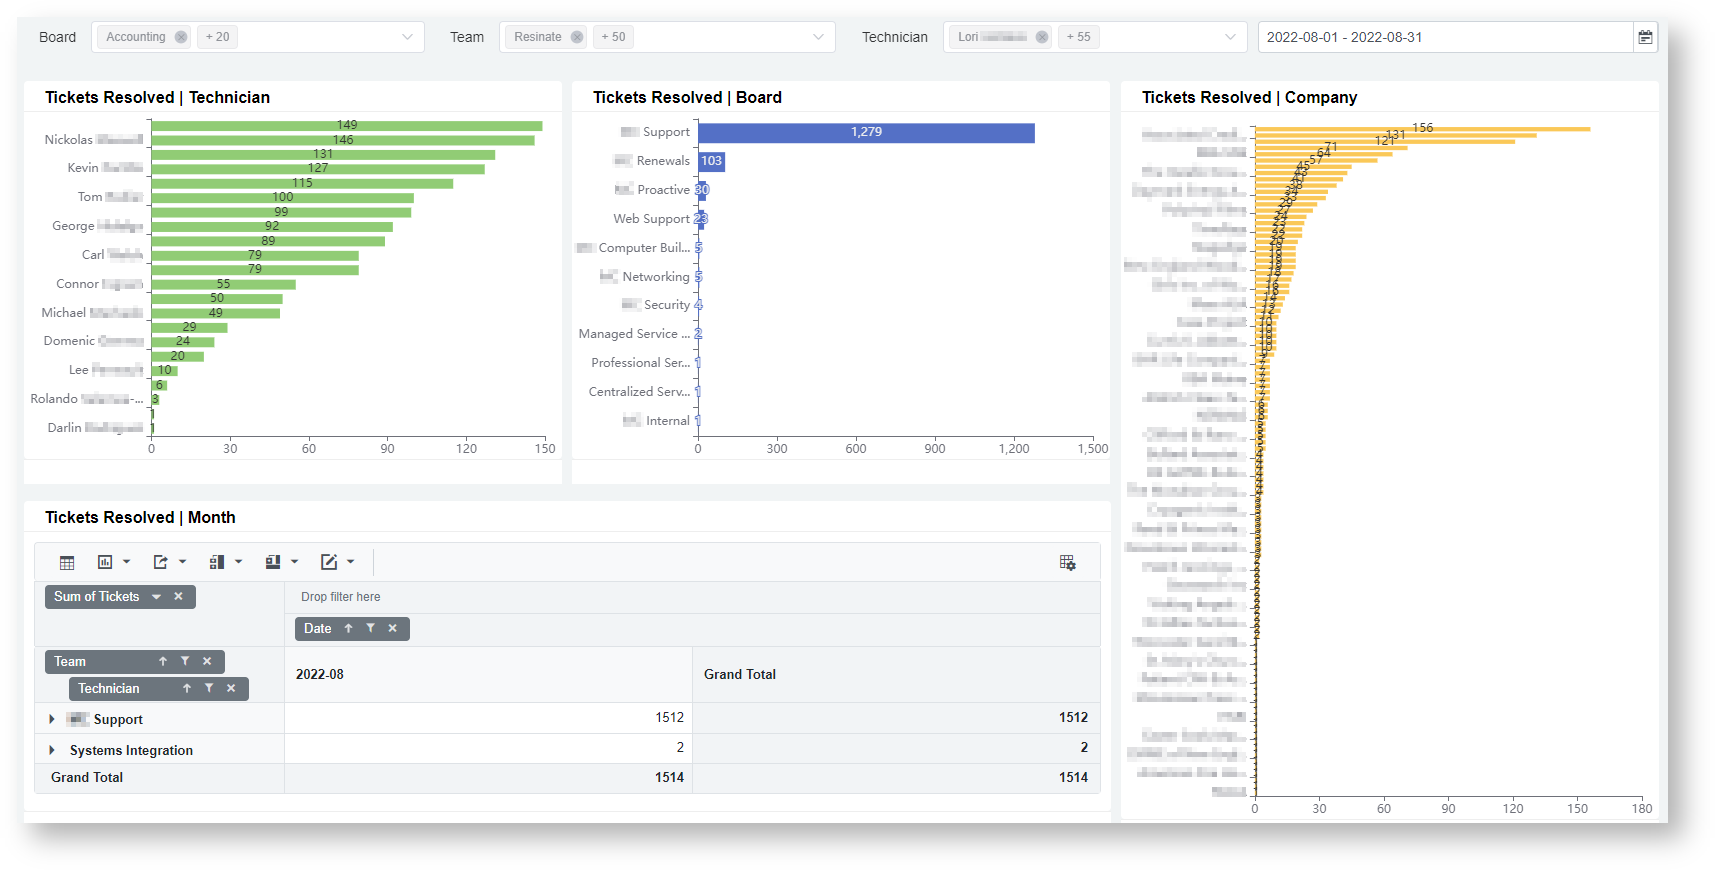
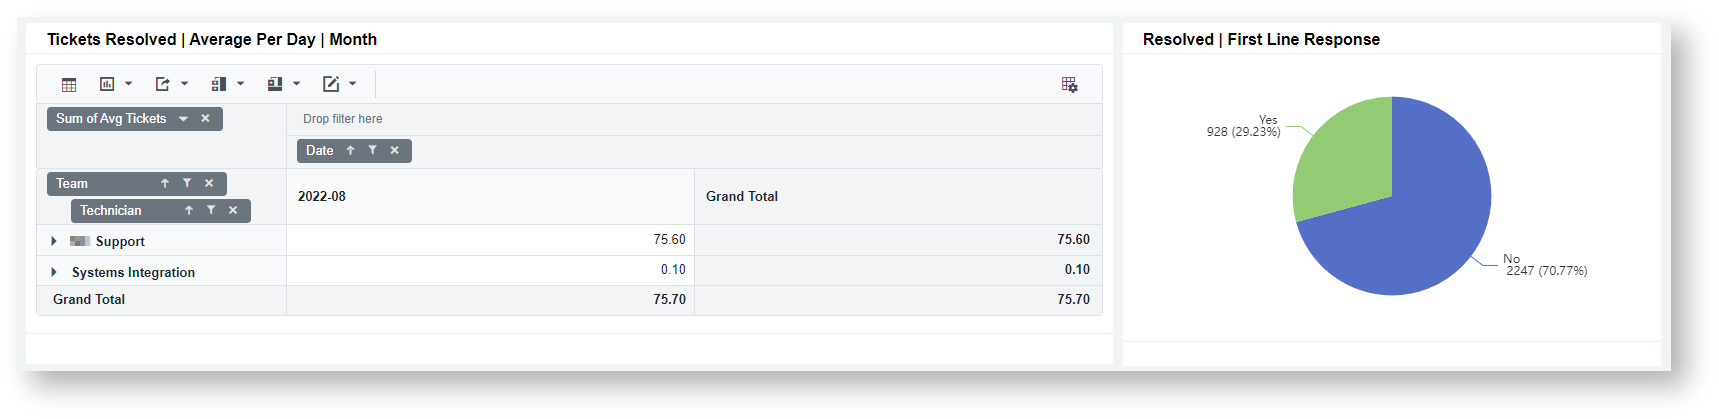
Tickets Resolved - Technician Efficiency
This dashboard gives an overview on count and daily rate of Tickets Resolved for the selected date range. Also shows the % of tickets resolved by First Line Response.
Available slicers are: Board, Team, Technician, and Date Range
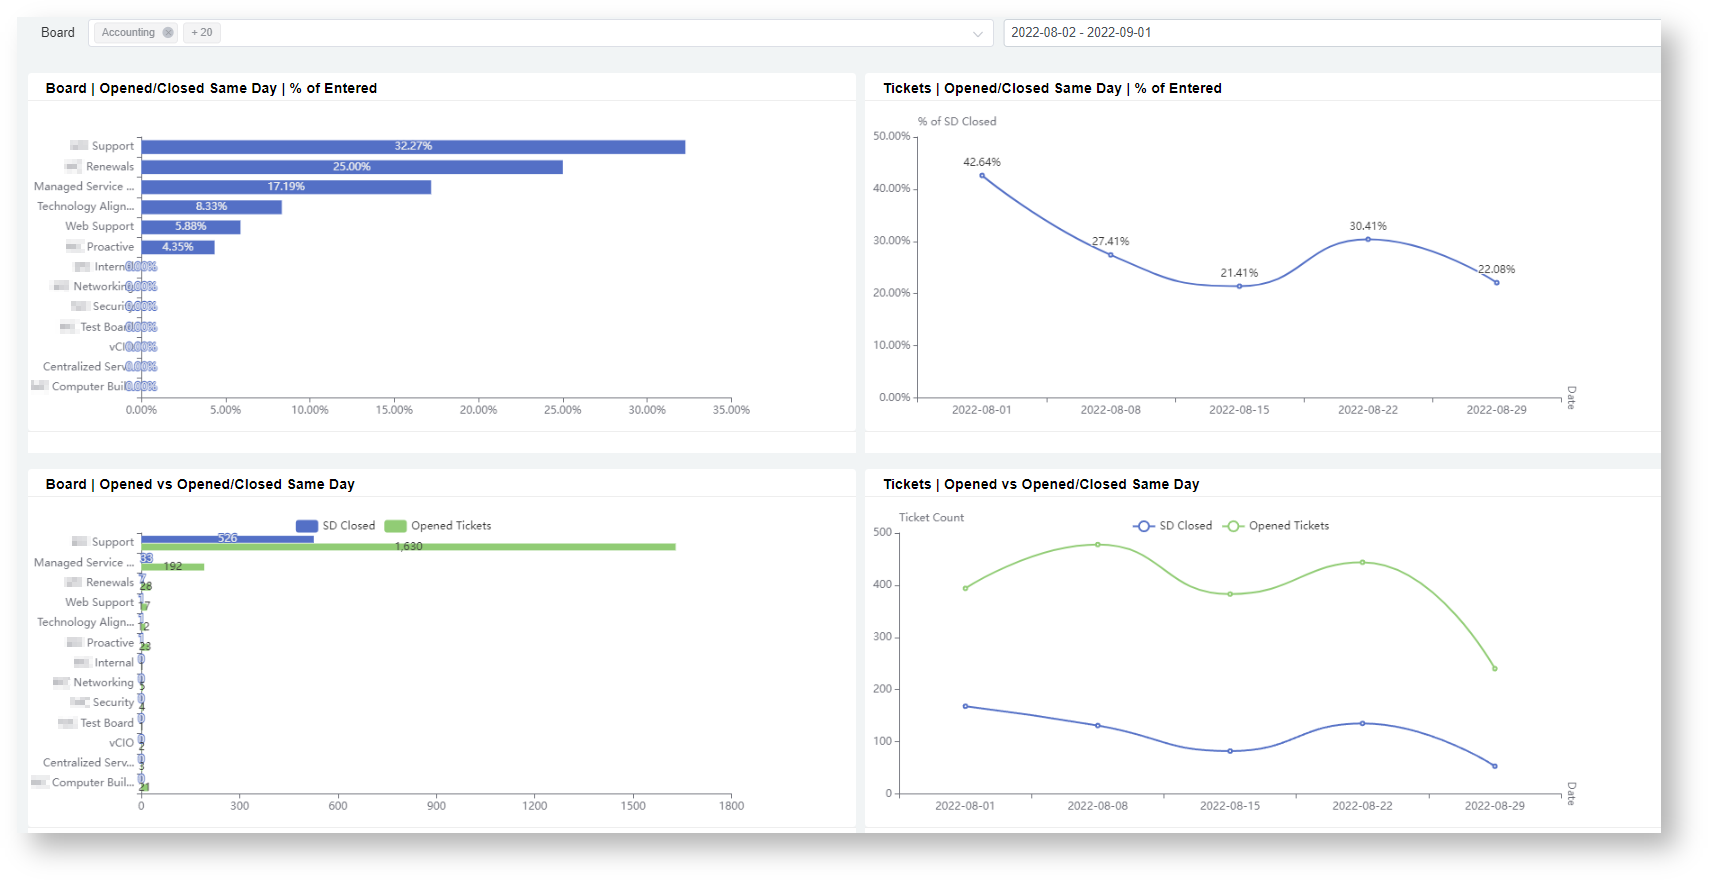
Tickets Opened-Closed Same Day
This dashboard shows the count and percentage of tickets that were opened and closed on the same day as well as their weekly trend for the selected date range.
Available slicers are: Board and Date Range
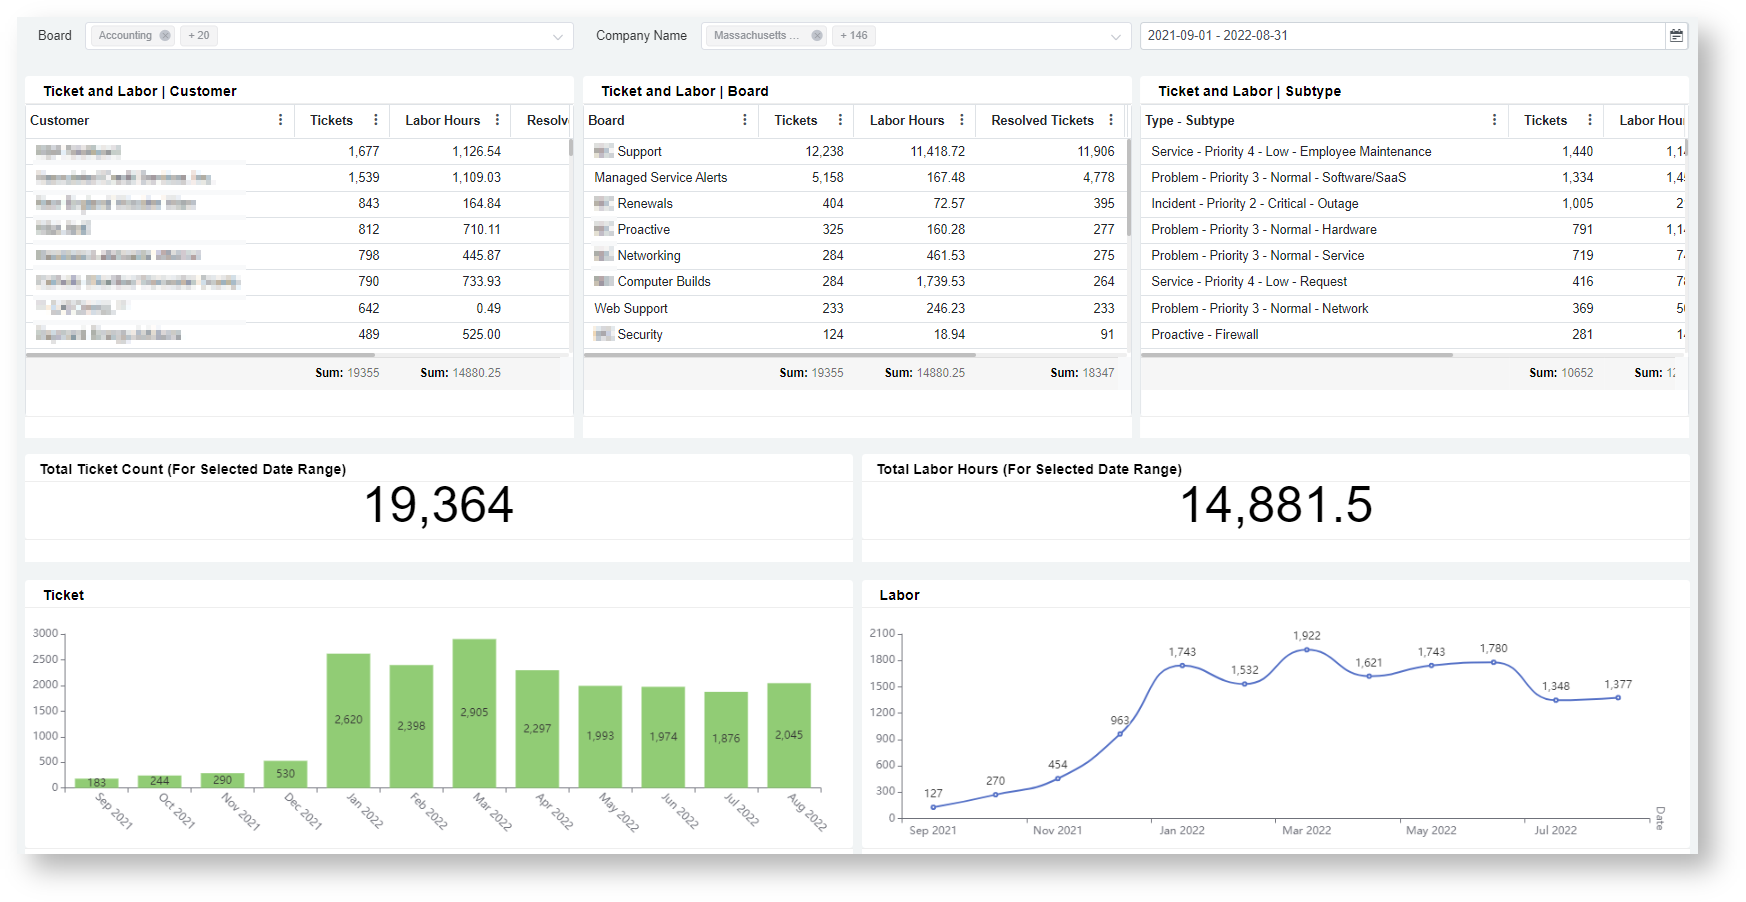
Ticket Labor Analysis
This dashboard compares the total ticket count with the total labor hours on a per company, board, and subtype level. It also shows their monthly trend for the selected date range.
Available slicers are: Board, Company, and Date Range
 Available slicers are: Status, Project Manager, and Project Type
Overview
Content Tools