 N O T I C E
MSPbots WIKI is moving to a new home at support.mspbots.ai![]() to give you the best experience in browsing our Knowledge Base resources and addressing your concerns. Click here
to give you the best experience in browsing our Knowledge Base resources and addressing your concerns. Click here![]() for more info!
for more info!
Page History
The MSP Finance Team Financial Forecasting is a key tool which app enables users to make informed decisions on resource allocation, investments, budgeting, risk management, and strategic planning. By analyzing historical data, trends, and seasonality we , you can plot potential future outcomes and at the very least make inform decision-makers aware of the direction of the company's finances.
This article discusses how the calculation for the MSP Finance Team Financial Forecasting is done.
| Table of Contents |
|---|
Background and
...
Methodology
...
The MSP Finance Financial Forecasting app of MSPbots uses Overall Trends and Seasonality to calculate values for forecasting. The following example of a seasonality graph
...
Seasonality Example:

The above example illustrates the high price seasonality of two commodities , corn and soy. Where , where abundant supply in in during the fall harvest period results in lower prices which . This period reaches its peak during the summer months.
Seasonality Graph

The following graphs show how time components affect trends.
Components of Time Series
...
A. Trend B. With Cyclical Values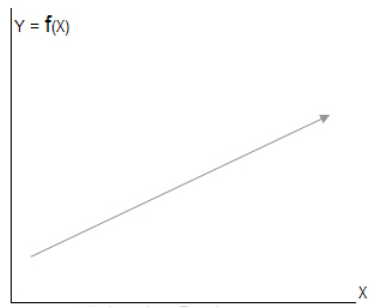
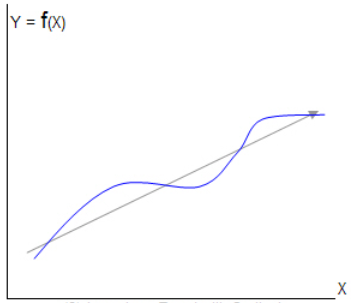
Fig.
...
A displays a simple trend line of value (Y) over time (X)
...
Fig.
...
B Trend line overlaid with cyclical (regularly recurring) movement
...
...
C. With Cyclical and Seasonal
...
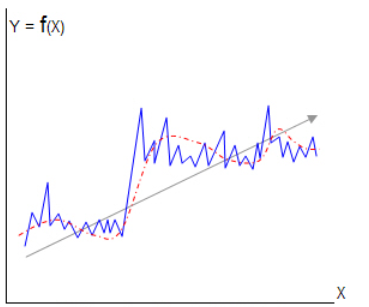
Variations D. With Cyclical and Seasonal Variations and Random fluctuations
. 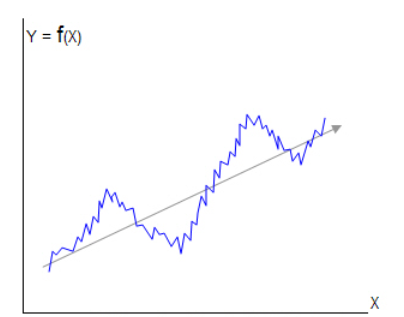
 Figs c & d adds
Figures C and D add Seasonal and Random value movements to the trend.
...
How actual Gross Margin, Revenue, and Expenses are forecasted
...
We use a machine learning MSPbots uses a Machine Learning model to automatically calculate and detect a) The overall trend b) Overall Trends and Seasonality.
To forecast values, the this model uses an 1.) :
- Autoregressive Technique
...
- - This technique assumes that a set of time series data is dependent on its past values and there is a linear relationship between the current value and its past data
...
- . Autoregressive models are used in financial and stock market forecasts and economic modeling.
- Fournier Method - This is a method of forecasting which is designed to improve the accuracy of
...
- time series forecasting by incorporating a more flexible prior distribution for the trend component
...
- . This facilitates more complex and non-linear trends in time series data.
...
- This method also incorporates additional parameters to factor in seasonality and is widely used as a forecasting method in industries such as finance, retail, and manufacturing.
Because we apply the This being a Machine Learning model, it gets better with more data! Ideally we need 1-2 years data at least the forecasted values get better as more data becomes available for calculation and analysis. Ideally, data from one to two years is sufficient to achieve an acceptable level of accuracy and error margin. Autoregressive models
What forecasts are
...
available in the MSP Finance Financial Team Forecasting app?
...
- Gross Margin Forecast

Gross Margin is calculated as (Total Revenue - Total COGS) / Total Revenue. Although Revenue and COGS (cost of goods sold) can be modeled separately, we take use the calculated value and run it using our model. As of posting, we see an average 93% accuracy as measured by the variance (yellow line) between forecast and actual for the 3 months using sample data.
...
Overview
Content Tools