 N O T I C E
MSPbots WIKI is moving to a new home at support.mspbots.ai![]() to give you the best experience in browsing our Knowledge Base resources and addressing your concerns. Click here
to give you the best experience in browsing our Knowledge Base resources and addressing your concerns. Click here![]() for more info!
for more info!
Page History
...
- Navigate to Widgets on the MSPbots app menu.
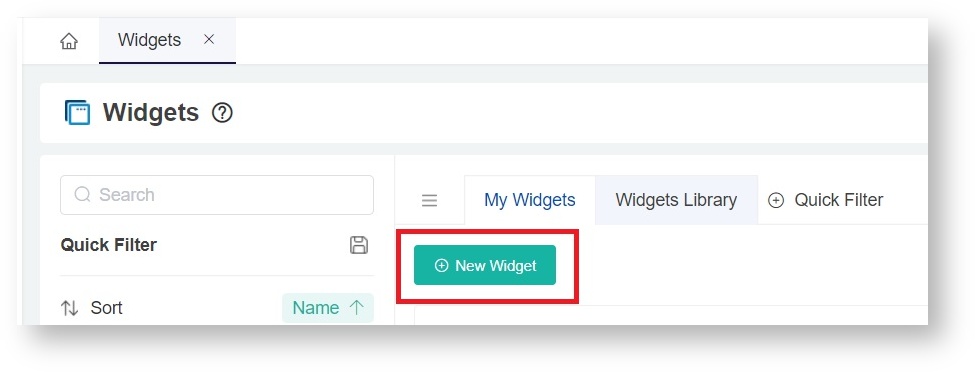
- Under My Widgets, click New Widget.
- Select the Gantt widget type on the New Widget window.

- When the Widget Builder window opens, go to the Basic Setting tab. Provide the following and click Apply:
- Name - Give the widget a name.
- Description - Give the widget a short description.
- Role - Select the roles you want to give access to.

- Next, go to the Dataset tab. Click the
 button and select New Layer.

- On the Dataset window,
- Select the Dataset containing the information you want to use.
- Give the data source a name and enter it in the Show datasource name as field (optional).

- For Columns Display
- On the Column Name drop-down, select the fields you want to include in the Gantt Chart. Click the button to add more rows.
- Give each row an Alias and select a Business Type for each.

- On the Column Name drop-down, select the fields you want to include in the Gantt Chart. Click the
- For Filter
- Click the button and choose Add Condition or Add Group.
- Add all the fields you want to filter.
- Set a condition or logic for each field using the next two drop-downs. For a guide on each option, refer to: What Conditions are Available for Creating Widgets?
- Select a logical operator for the filter group (AND or OR).

- Click the
- Click Save.
- Next, go to the Config tab.
- Under Column, you can choose which of the columns below to display in the gantt chart and the data source field to be used for each one.
- Group - will group the task name based on the field selected
- Task Name
- Resources
- Start Date
- End Date
- Duration - Adds "days" as a unit by default. If field selected is in hours, please divide the field by 24hrs using the
 button in the dataset window (step 6.c)
 - Progress

- Under Timeline, you can configure how the dates will be shown. By default, it will show the dates weekly for Top tier and daily for Bottom tier.
- Format - choose among the available date formats

- Under Column, you can choose which of the columns below to display in the gantt chart and the data source field to be used for each one.
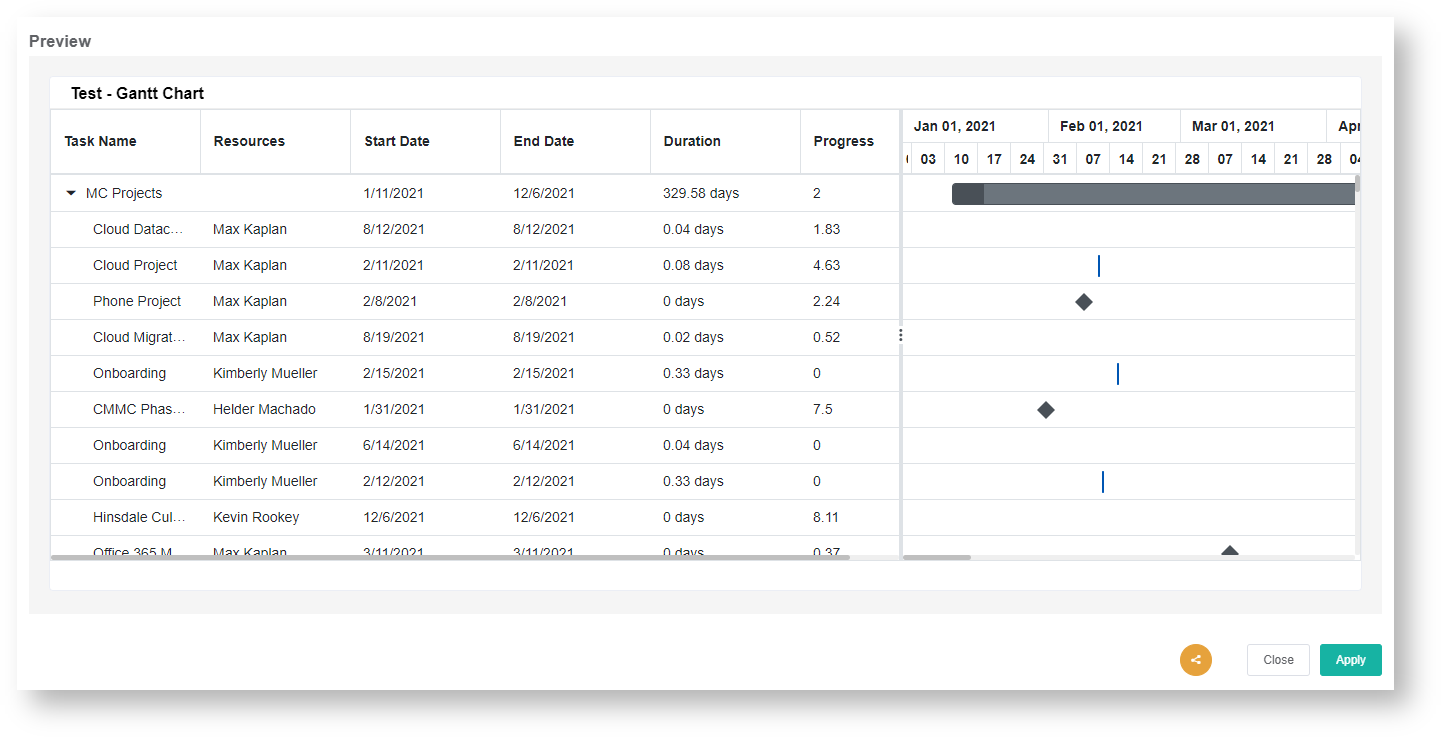
- Click Apply. This will show a preview of the created Gantt Chart widget.
...
Overview
Content Tools