 N O T I C E
MSPbots WIKI is moving to a new home at support.mspbots.ai![]() to give you the best experience in browsing our Knowledge Base resources and addressing your concerns. Click here
to give you the best experience in browsing our Knowledge Base resources and addressing your concerns. Click here![]() for more info!
for more info!
Page History
...
This dashboard can be filtered by Date Range. Users can drill through most widgets to view more details and/or breakdowns.


...
MSPF Benchmark - Gross Margin generated per $1 Sales
A card number showing the overall Gross Margin generated per $1 of Sales & Marketing Expenses for the selected date range.
Formula: (Total Revenue - Total COGS) / Total Sales & Marketing Expenses
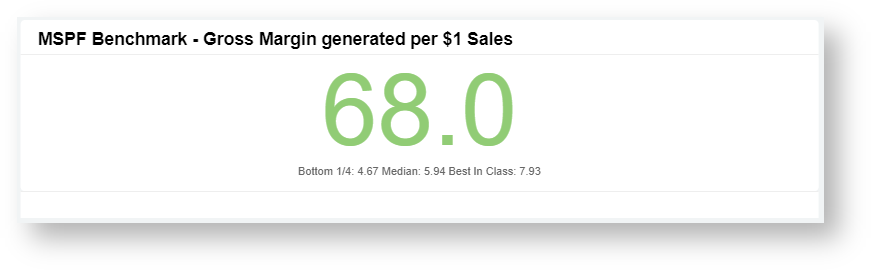
Data source: Xero P&L (SLI-Mapped)
...
- for Revenue, COGS, Sales & Marketing Expenses
MSPF Benchmark - Blended Gross Margin %
A bar graph providing a benchmark for Gross Margin. Data is shown per month for the selected date range.
Formula: (Total Revenue - Total COGS) / Total Revenue
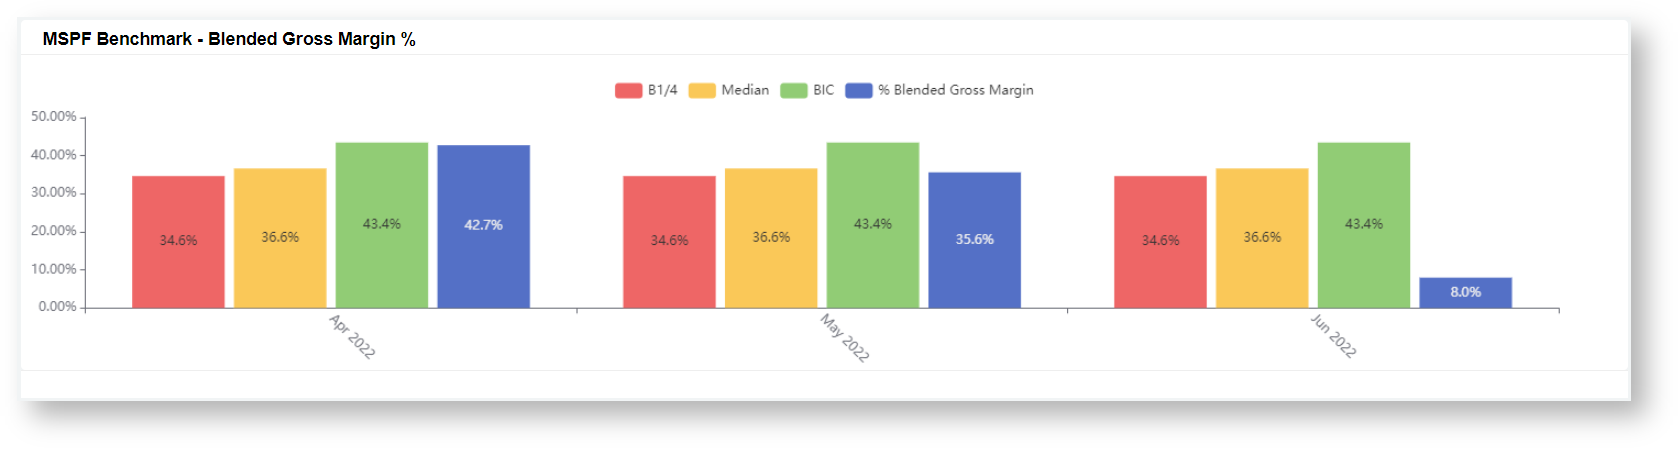
Data source: Xero P&L (SLI-Mapped)
...
- for Revenue, COGS
MSPF Benchmark - Service Gross Margin %
A bar graph providing a benchmark for Service Gross Margin. Data is shown per month for the selected date range.
Formula: (Service Revenue - Services COGS) / Service Revenue
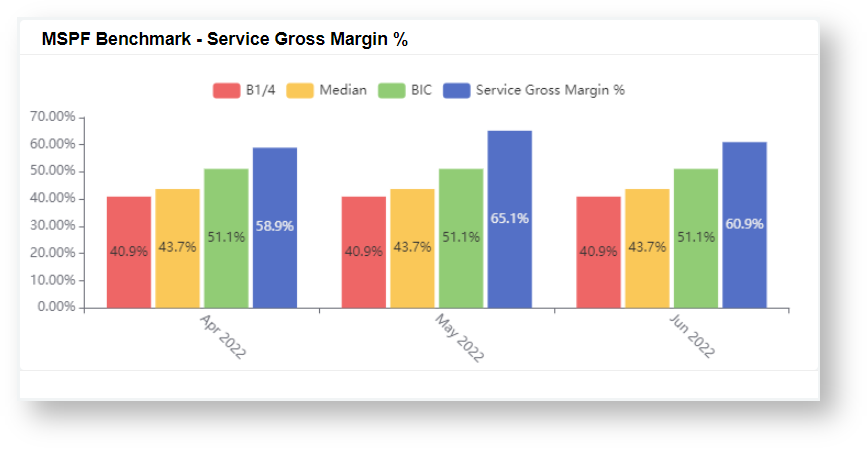
Data source: Xero P&L (SLI-Mapped)
...
- for Service Revenue, Service COGS
MSPF Benchmark - Product Gross Margin %
A bar graph providing a benchmark for Product Gross Margin. Data is shown per month for the selected date range.
Formula: (Product Revenue - Product COGS) / Product Revenue
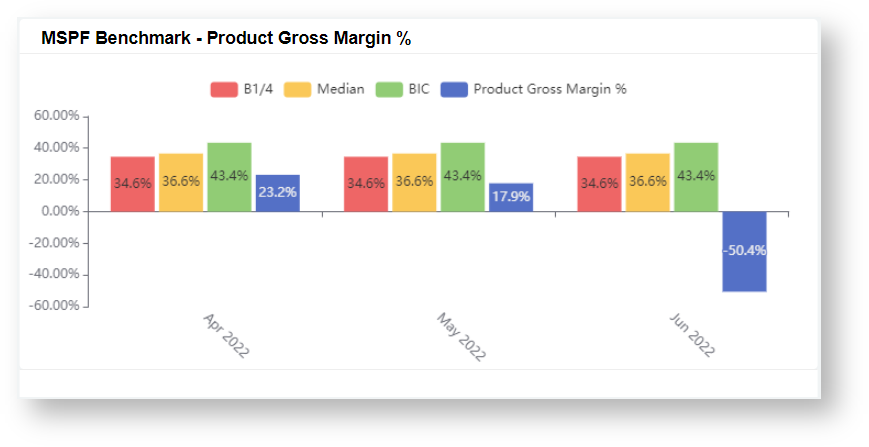
Data source: Xero P&L (SLI-Mapped)
...
- for Product Revenue, Product COGS
MSPF Benchmark - SG&A %
A bar graph providing a benchmark for Selling, General and Administrative Expense (SG&A) as a % of Total Expenses. Data is shown per month for the selected date range.
Formula: SG&A Expenses/ Total Expenses
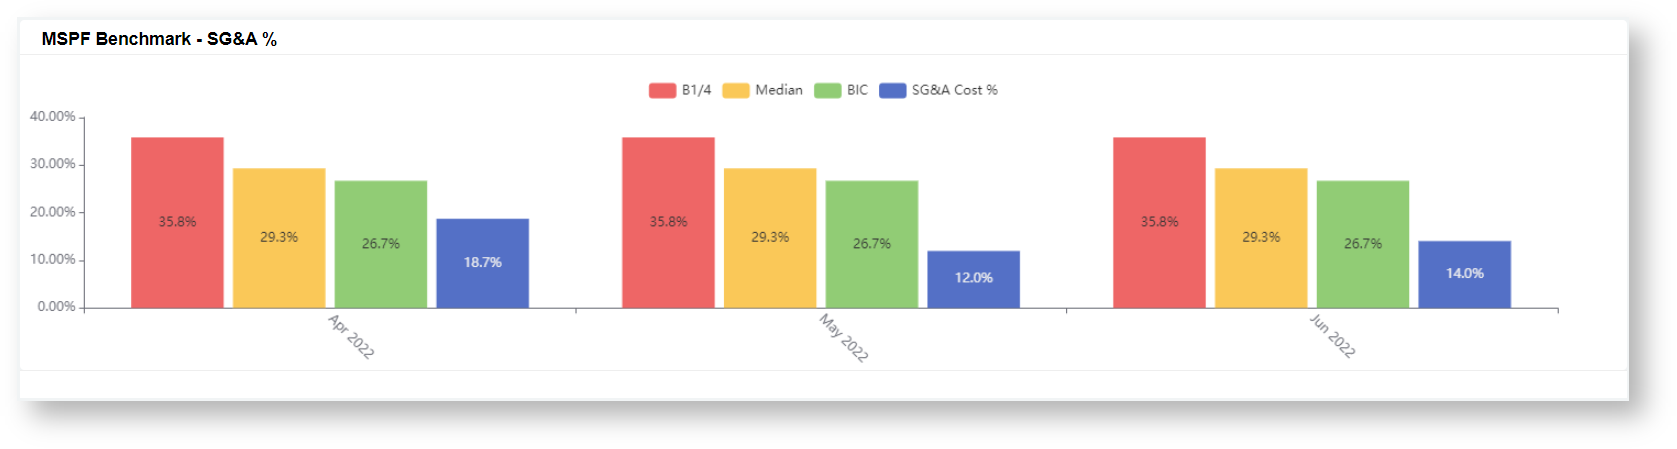
Data source: Xero P&L (SLI-Mapped)
...
- for SG&A Expenses, Total Expenses
MSPF Benchmark - Sales Cost %
A bar graph providing a benchmark for Sales Expenses as a % of Total Expenses. Data is shown per month for the selected date range.
Formula: Sales Expenses / Total Expenses
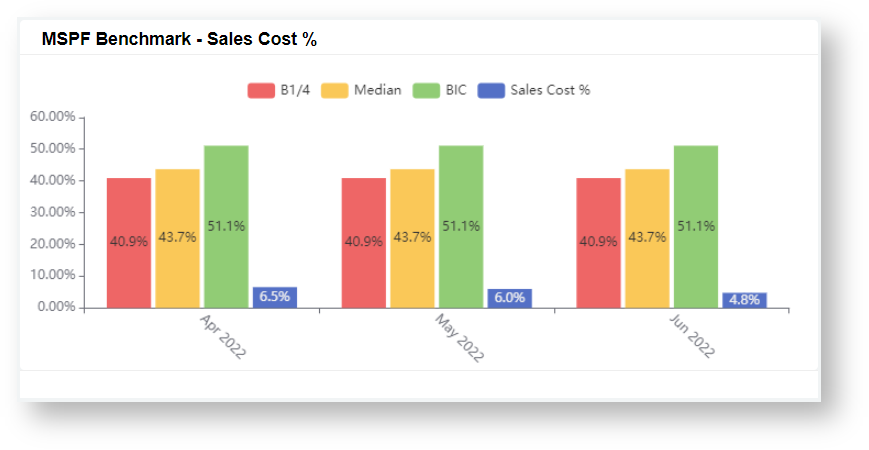
Data source: Xero P&L (SLI-Mapped)
...
- for Sales Expenses, Total Expenses
MSPF Benchmark - G&A Cost%
A bar graph providing a benchmark for General and Admin Expenses as a % of Total Expenses. Data is shown per month for the selected date range.
Formula: General and Admin Expenses / Total Expenses
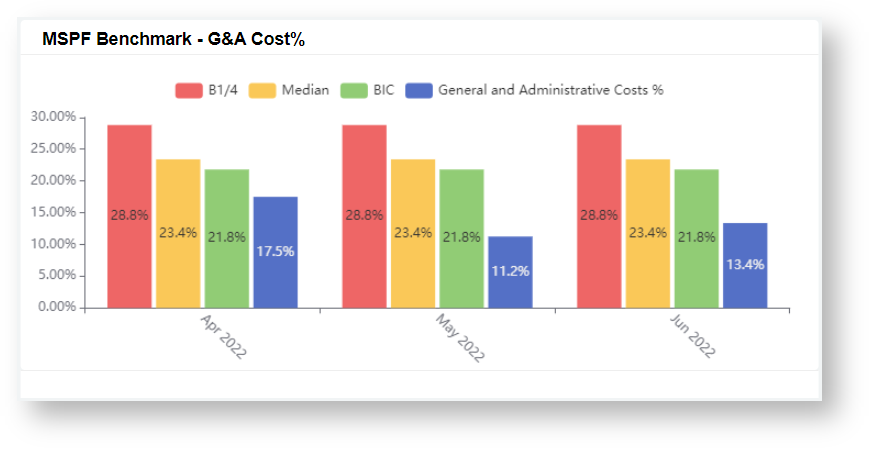
Data source: Xero P&L (SLI-Mapped)
...
- for General and Admin Expenses, Total Expenses
MSPF Benchmark - EBITDA %
A bar graph providing a benchmark for Earnings Before Interest, Taxes, Depreciation, and Amortization (EBITDA) as a % of Total Revenue. Data is shown per month for the selected date range.
Formula: (Revenue - Expense) / Total Revenue
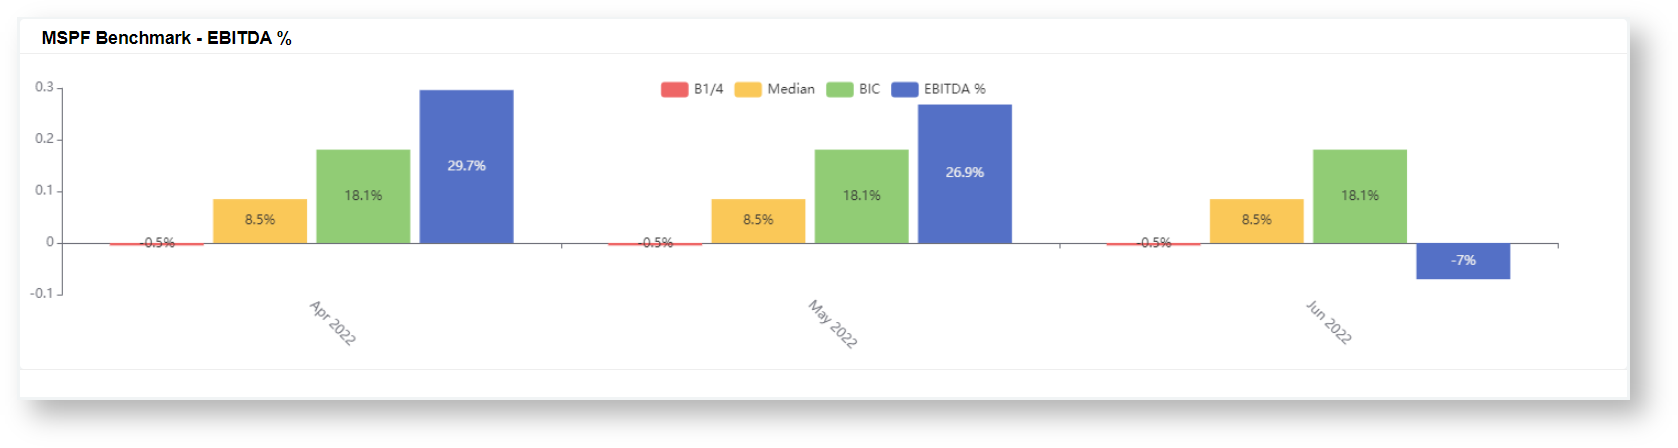
Data source: Xero P&L (SLI-Mapped)
...
- for Expenses, Revenue
Overview
Content Tools