 N O T I C E
MSPbots WIKI is moving to a new home at support.mspbots.ai![]() to give you the best experience in browsing our Knowledge Base resources and addressing your concerns. Click here
to give you the best experience in browsing our Knowledge Base resources and addressing your concerns. Click here![]() for more info!
for more info!
N O T I C E
MSPbots WIKI is moving to a new home at support.mspbots.ai![]() to give you the best experience in browsing our Knowledge Base resources and addressing your concerns. Click here
to give you the best experience in browsing our Knowledge Base resources and addressing your concerns. Click here![]() for more info!
for more info!
This app contains dashboards that use data from time entries to calculate the Utilization, Realization, and Billable Utilization of a team. The different widgets included in this suite will help Business Owners and Service Managers reach their target utilization and answer questions such as:
- Are your team members recording their time entries correctly?
- Is your team working on too many internal or non-billable tickets?
- Is your team's workload managed effectively?
This page contains the following information:
1. List of Dashboards and Descriptions
Dashboard Name | Description |
|---|---|
| Team Utilization - Summary | This dashboard shows key team metrics and highlights the Utilization, Realization, and Billable Utilization for the selected date range. It also has column charts that show the monthly trend for these metrics over the last 12 months. |
| Team Utilization - Comparison | This dashboard contains a table that shows a breakdown of KPIs on a per-technician level to allow managers to review the performance of specific teams or individuals. It also has graphs that show the top technicians/teams based on utilized and realized hours. |
| Team Utilization - Compare Periods | This dashboard has two similar tables showing the breakdown of KPIs on a per-technician level to allow the comparison of an individual's utilization with other members or across different periods. |
| Team Utilization - Compare Teams | This dashboard has two similar tables showing the breakdown of KPIs on a per-team level to allow the comparison of a team's utilization across different periods or against other teams. |
| Team Utilization - Work Category | This dashboard shows recorded hours for each Work Category and Business Unit on a per-team or technician level. |
| Team Utilization - Non-Billable Time | This dashboard gives a complete breakdown of time entries tagged as Do Not Bill or No Charge on a per-team and technician level. It also shows the proportion of non-billable time recorded against customer and internal teams. |
| Team Utilization - Daily Time Span | This dashboard shows a comparison between the computed Total Daily Span (hours spent by a technician) and Total Labor Hours (hours logged for work by a technician). |
| Team Utilization - Daily Chart | This dashboard shows the daily average and trend for the KPIs Utilization, Realization, Billable Utilization, Do Not Bill, and No Charge. |
| Team Utilization - Weekly Chart | This dashboard shows the weekly average and trend for the KPIs Utilization, Realization, Billable Utilization, Do Not Bill, and No Charge. |
| Team Utilization - Non-Business Hours | This dashboard gives a breakdown of Time Entries under Non-Business Hours on a per-technician and date entry level. |
| (SETTINGS) Autotask Settings for App Packages | This contains settings for dashboards under the Financial and Team Utilization suites for Autotask Integration. For Team Utilization, users can select which among their companies should be tagged as internal and also assign teams to technicians. |
2. Terms and Calculations
Term | Definition/Calculation |
|---|---|
| Available Hours | Daily capacity recorded per member multiplied by the number of weekdays for the selected date range |
| Staff Available Hours | Available Hours less PTO hours |
| Staff Billable Days | Staff Available Hours divided by 8 hours. This is used to compute for utilized/day, realized/day, and billable utilized/day.Utilized Hours |
| Utilized Hours | Actual hours worked based on time entries excluding PTO hours |
| Utilization % | Utilized Hours / Staff Available Hours |
| Realized Hours | Utilized Hours excluding time entries against internal companies |
| Realization % | Realized / Staff Available Hours |
| Billable Utilized Hours | All time entries that are considered Realized and are Billable |
| Billable Utilization % | Billable hours / Staff Available Hours |
| PTO | Total hours of recorded Paid Time Off such as Holiday, Lunch, Vacation, and Personal |
| Invoiceable | Time entries that are Billable but not against an agreement |
| No Charge | Total hours of time entries tagged as No Charge |
| Do Not Bill | Total hours of time entries tagged as Do Not Bill |
| Business Hours | Labor / Actual hours spent working within business hours |
| Non-Business Hours | Labor / Actual hours spent working outside of business hours |
| Daily Span | Latest time entry End Time less the earliest time entry Start Time of each member for each day |
| Labor Hours | Total actual hours worked based on time entries |
3. Team Utilization - Summary Dashboard
The Summary dashboard shows key team metrics and highlights the Utilization, Realization, and Billable Utilization for the selected date range. It also has column charts that show the monthly trend for these metrics over the last 12 months.
The available slicers are Business Group, Team, Technician, and Date Range slicers.


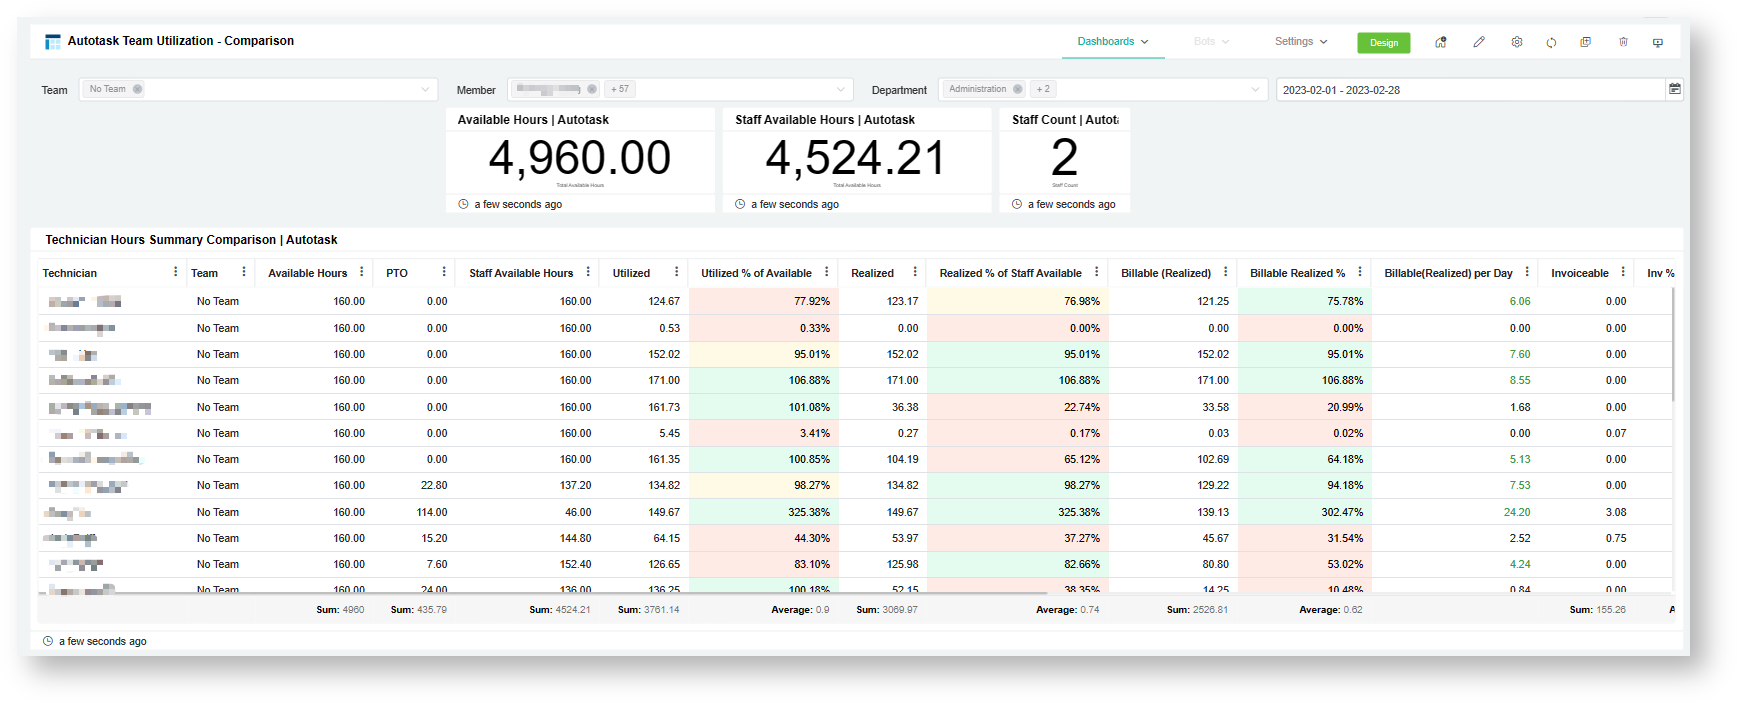
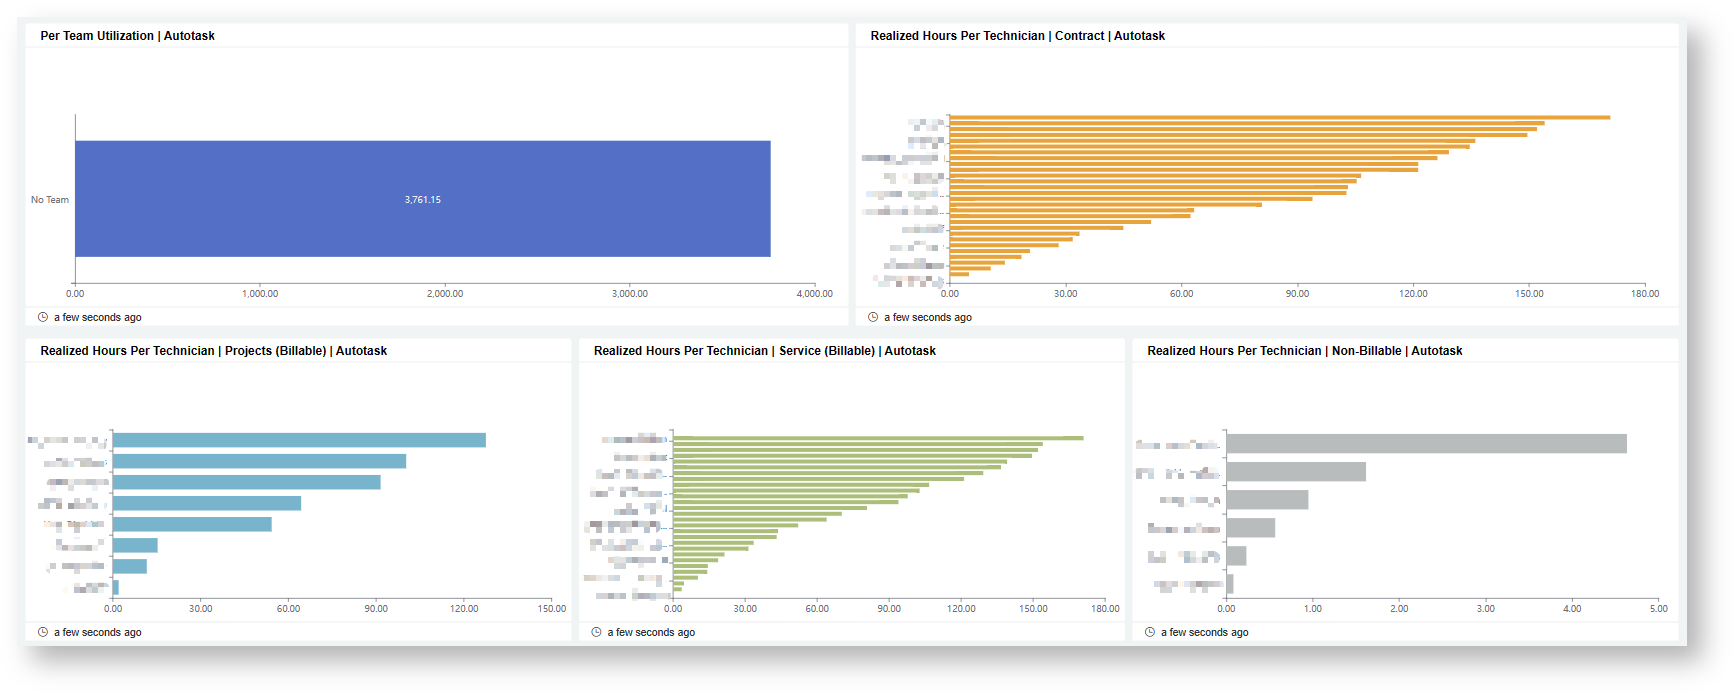
4. Team Utilization - Comparison Dashboard
This dashboard contains a table that shows a breakdown of KPIs on a per-technician level to allow managers to review the performance of specific teams/individuals. It also has graphs showing the top technicians/teams in terms of utilized and realized hours.
The available slicers are Business Group, Team, Technician, and Date Range slicers.
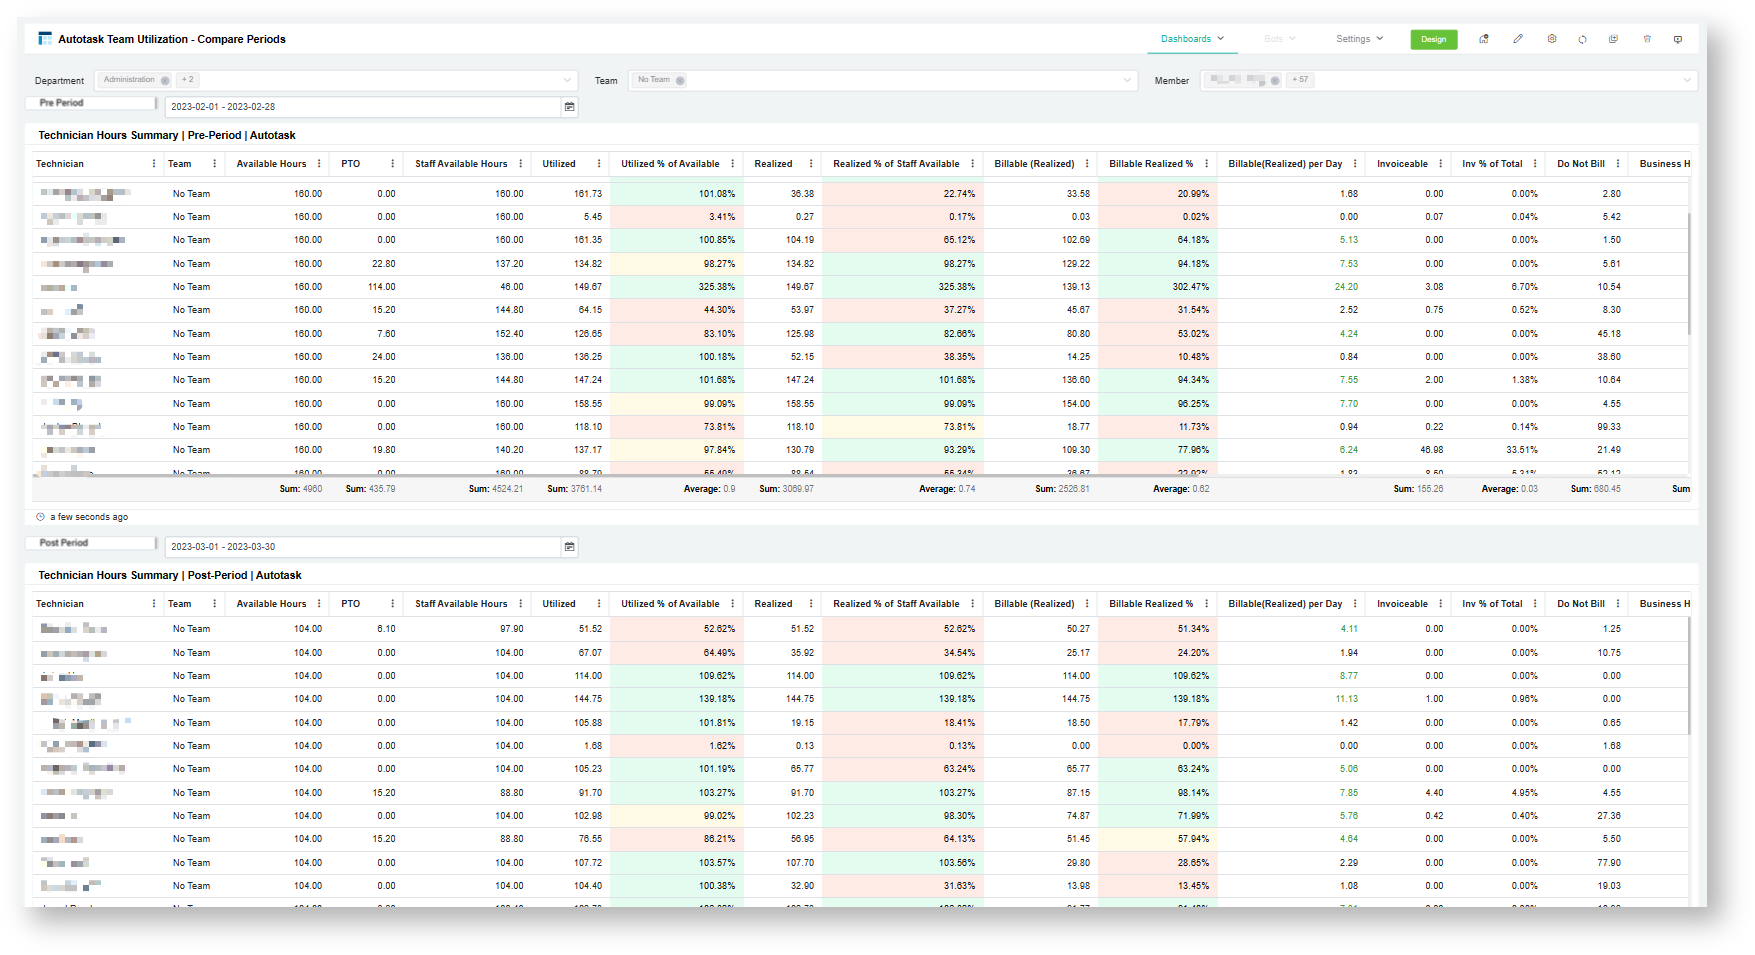
5. Team Utilization - Compare Periods Dashboard
This dashboard has two similar tables showing the breakdown of KPIs on a per-technician level to allow users to compare an individual's utilization across different periods or against other members.
The available slicers are Business Unit, Team, Technician, and Date Range slicers.
6. Team Utilization - Compare Teams Dashboard
This dashboard has two similar tables showing the breakdown of KPIs on a per-team level to allow users to compare a team's utilization across different periods or against other teams.
The available slicers are Business Unit, Team, Technician, and Date Range slicers.

7. Team Utilization - Work Category Dashboard
This dashboard shows recorded hours for each Work Category and Business Unit on a per-team or technician level.
The available slicers are Business Group, Team, Technician, and Date Range slicers.


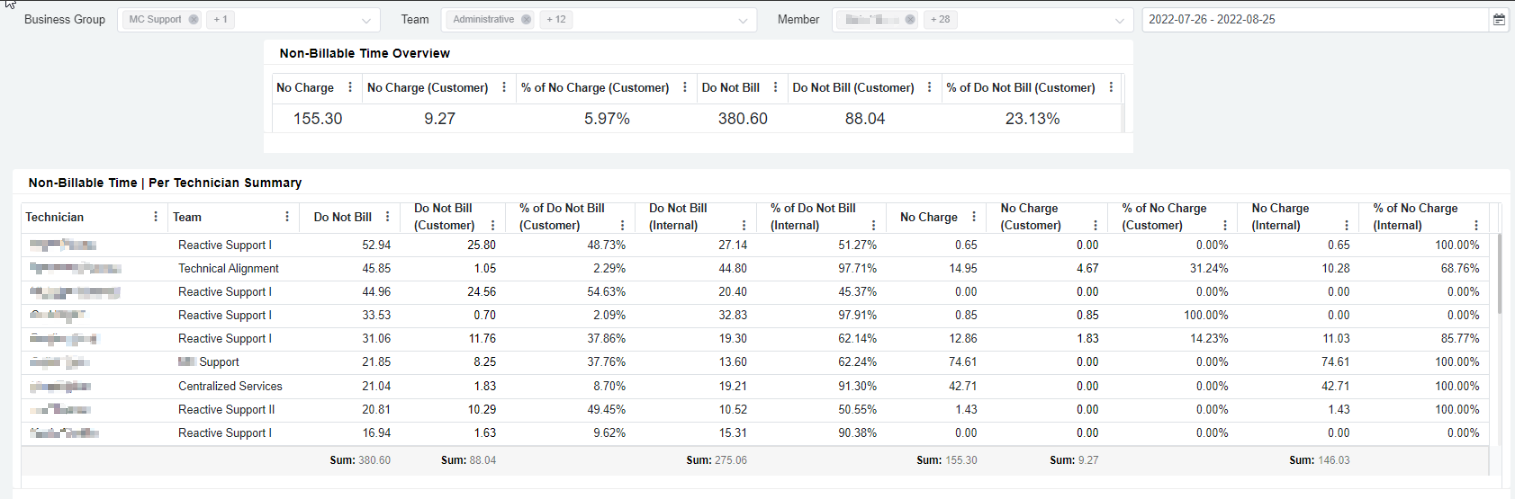
8. Team Utilization - Non-Billable Time Dashboard
This dashboard gives a complete breakdown of time entries tagged as Do Not Bill or No Charge on a per-team and technician level. It also shows the proportion of non-billable time recorded against customer and internal teams.
The available slicers are Business Group, Team, Technician, and Date Range slicers.

9. Team Utilization - Daily Time Span Dashboard
This dashboard shows a comparison between the computed Total Daily Span (hours spent by a technician) and Total Labor Hours (hours logged for work by a technician).
The available slicers are Team, Technician, and Date Range slicers.

10. Team Utilization - Daily Chart Dashboard
This dashboard shows the daily average and trend for the KPIs Utilization, Realization, Billable Utilization, Do Not Bill, and No Charge. The available slicers are Business Unit, Team, Technician, and Date Range slicers.

11. Team Utilization - Weekly Chart Dashboard
This dashboard shows the weekly average and trend for the KPIs Utilization, Realization, Billable Utilization, Do Not Bill, and No Charge.
The available slicers are Business Unit, Team, Technician, and Date Range slicers.

12. Team Utilization - Non-Business Hours Dashboard
This dashboard gives a breakdown of Time Entries under Non-Business Hours on a per-technician and date entry level.
The available slicers are the Business Unit, Team, Technician, and Date Range slicers.

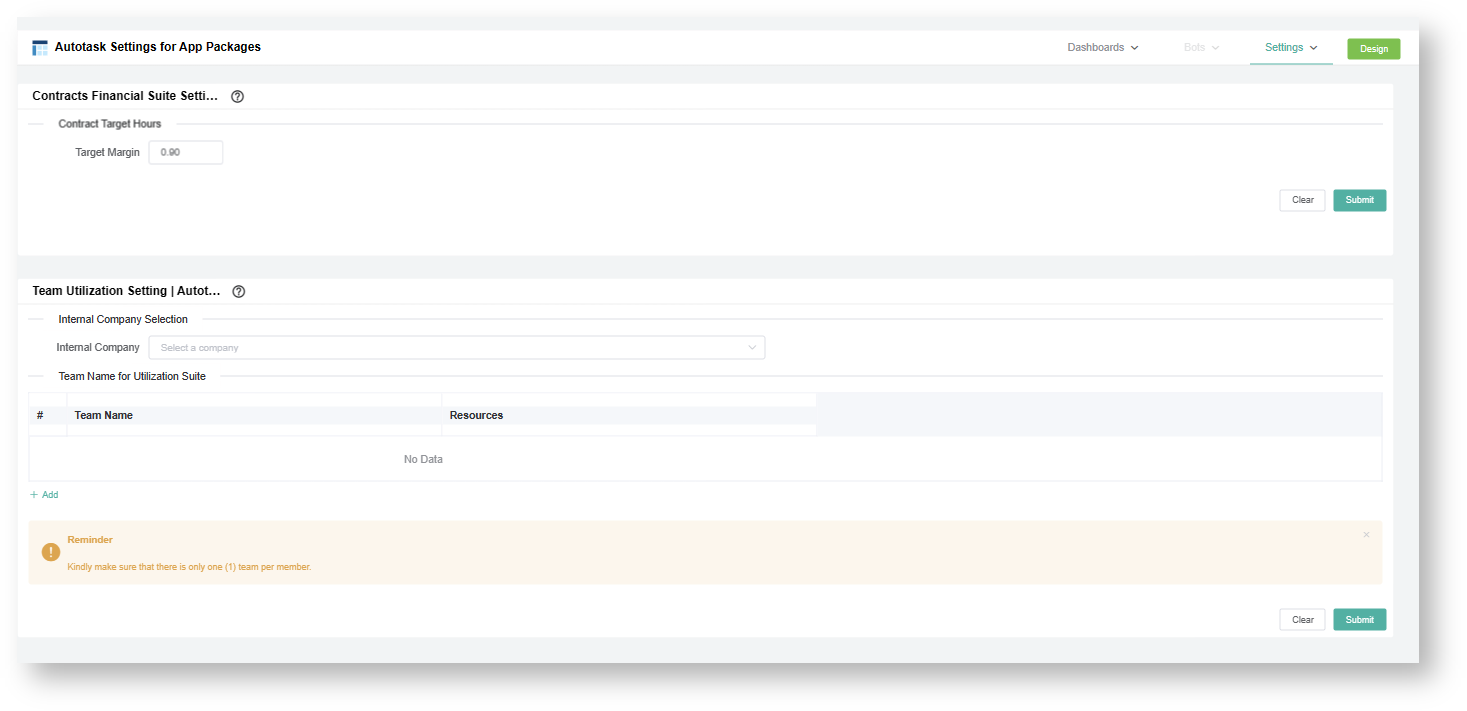
13. Settings for App Packages
- Internal Company Selection: Allows users to select which among their companies should be tagged as internal. These will not be included in the computation of Realized Hours.
- Autotask Team Name Formlist: If the user does not want to utilize the Autotask mapping for Job Title, the user can list down all technicians and assign a team to each one.
13.1. Related Topics
Overview
Content Tools
N O T I C E
MSPbots WIKI is moving to a new home at support.mspbots.ai![]() to give you the best experience in browsing our Knowledge Base resources and addressing your concerns. Click here
to give you the best experience in browsing our Knowledge Base resources and addressing your concerns. Click here![]() for more info!
for more info!