 N O T I C E
MSPbots WIKI is moving to a new home at support.mspbots.ai![]() to give you the best experience in browsing our Knowledge Base resources and addressing your concerns. Click here
to give you the best experience in browsing our Knowledge Base resources and addressing your concerns. Click here![]() for more info!
for more info!
N O T I C E
MSPbots WIKI is moving to a new home at support.mspbots.ai![]() to give you the best experience in browsing our Knowledge Base resources and addressing your concerns. Click here
to give you the best experience in browsing our Knowledge Base resources and addressing your concerns. Click here![]() for more info!
for more info!
The Eureka Process in MSPbots is a tool for Managed Service Providers (MSPs) and companies to gain insight into their business and processes. It has real-time gauges and dashboards so you can look into finance and service delivery measurables like accounts receivables, outstanding sales, response time, and vendor analysis.
What's in this article:
What are the advantages of using the Eureka Process app?
With the Eureka Process, you can:
- measure the organization's financial health and service performance
- visualize expenditures and cost patterns; identify cost-saving opportunities
- make data-driven decisions in allocating resources effectively, reducing costs, and increasing overall productivity
- highlight bottlenecks or inefficiencies in the service process and allow prompt corrective action
- monitor your company's EBITDA (Earnings Before Interest, Taxes, Depreciation, and Amortization)
Who can use this app?
The Eureka Process in MSPbots is available to users of Autotask, ConnectWise Manage, QuickBooks Online, QuickBooks On-Premise, and Kaseya BMS. To use this app, you must first set up your software's connection to MSPbots. Click the hyperlinks to your software for guided instructions on setting up an integration with MSPbots.
What are the Eureka Process dashboards and widgets?
Eureka Process Template - Finance Dashboard

This dashboard shows how your company measures against metrics like the EBIDTA and daily sales outstanding. The widgets on this dashboard are:- MSP Coverage Ratio - This widget calculates the MSP Coverage Ratio using the formula: MRR/Expenses.
- EBIDTA Last Month - This widget calculates and displays the EBITDA from the previous month.
- AR > 30 Days - This widget shows the account receiveable from more than 30 days.
- DSO Last Month - This widget shows the Days Sales Outstanding from the last month.
- DSO Current Year - This widget shows the Days Sales Outstanding for the current year.
- Cash Generation Last Month - This widget shows the cash generation for the last month.
- Vendors Analysis - This table analyzes the vendors according to the amount in the current month and the average in the last five months, then compares the current to the average in the last five months.
Eureka Process Template - Service Delivery Dashboard

This dashboard shows how your company scores on metrics like response and resolution times. The widgets on this dashboard are:- Avg Resolution Time - This is the average time in resolving a ticket minus the time it was waiting. The average response time is in minutes.
- Avg Response Time - This is the average time in responding to a ticket. The average response time is in minutes.
- Number of tickets greater than resolution time SLA but less than 7 days
- Number of tickets greater than response time SLA but less than 7 days
- Number of tickets with over 2 labor hours spent
Which settings are customizable in the Eureka Process app?
You can include boards and queues and exclude companies from the data shown in the dashboards.
To configure these settings:
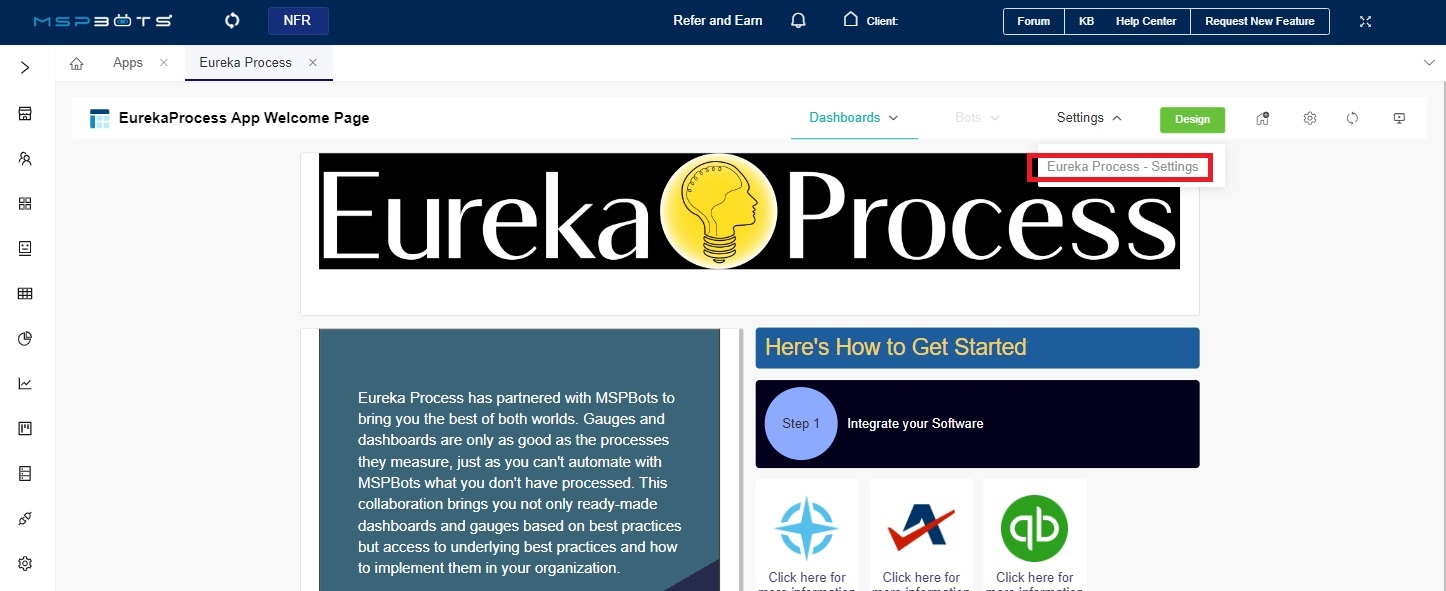
- On the Eureka Process Welcome Page, click Settings > Eureka Process Settings.
- Click the Board | Queue dropdown and select the board or queue you want to include in the data.

- Click the Excluded Company Name dropdown and select the company that needs to be excluded from the data.
- Click Submit when done.
Overview
Content Tools
N O T I C E
MSPbots WIKI is moving to a new home at support.mspbots.ai![]() to give you the best experience in browsing our Knowledge Base resources and addressing your concerns. Click here
to give you the best experience in browsing our Knowledge Base resources and addressing your concerns. Click here![]() for more info!
for more info!