 N O T I C E
MSPbots WIKI is moving to a new home at support.mspbots.ai![]() to give you the best experience in browsing our Knowledge Base resources and addressing your concerns. Click here
to give you the best experience in browsing our Knowledge Base resources and addressing your concerns. Click here![]() for more info!
for more info!
 N O T I C E
MSPbots WIKI is moving to a new home at support.mspbots.ai![]() to give you the best experience in browsing our Knowledge Base resources and addressing your concerns. Click here
to give you the best experience in browsing our Knowledge Base resources and addressing your concerns. Click here![]() for more info!
for more info!
The CrushBank App monitors time utilization and ensures your teams meet their allocated budget hours. The app's comprehensive and user-friendly dashboard provides easy visualization of crucial data, allowing you to identify insights into resource utilization and potential budget overruns. With the CrushBank App, you have a tool to check if human resources, time, and budget are efficiently utilized to achieve high productivity and accomplish goals.
The CrushBank App is available to ConnectWise Manage users and sends notifications to MS Teams. Before using this app, ensure you have ConnecWise Manage and MS Teams.
What's in this article
CrushBank Dashboard
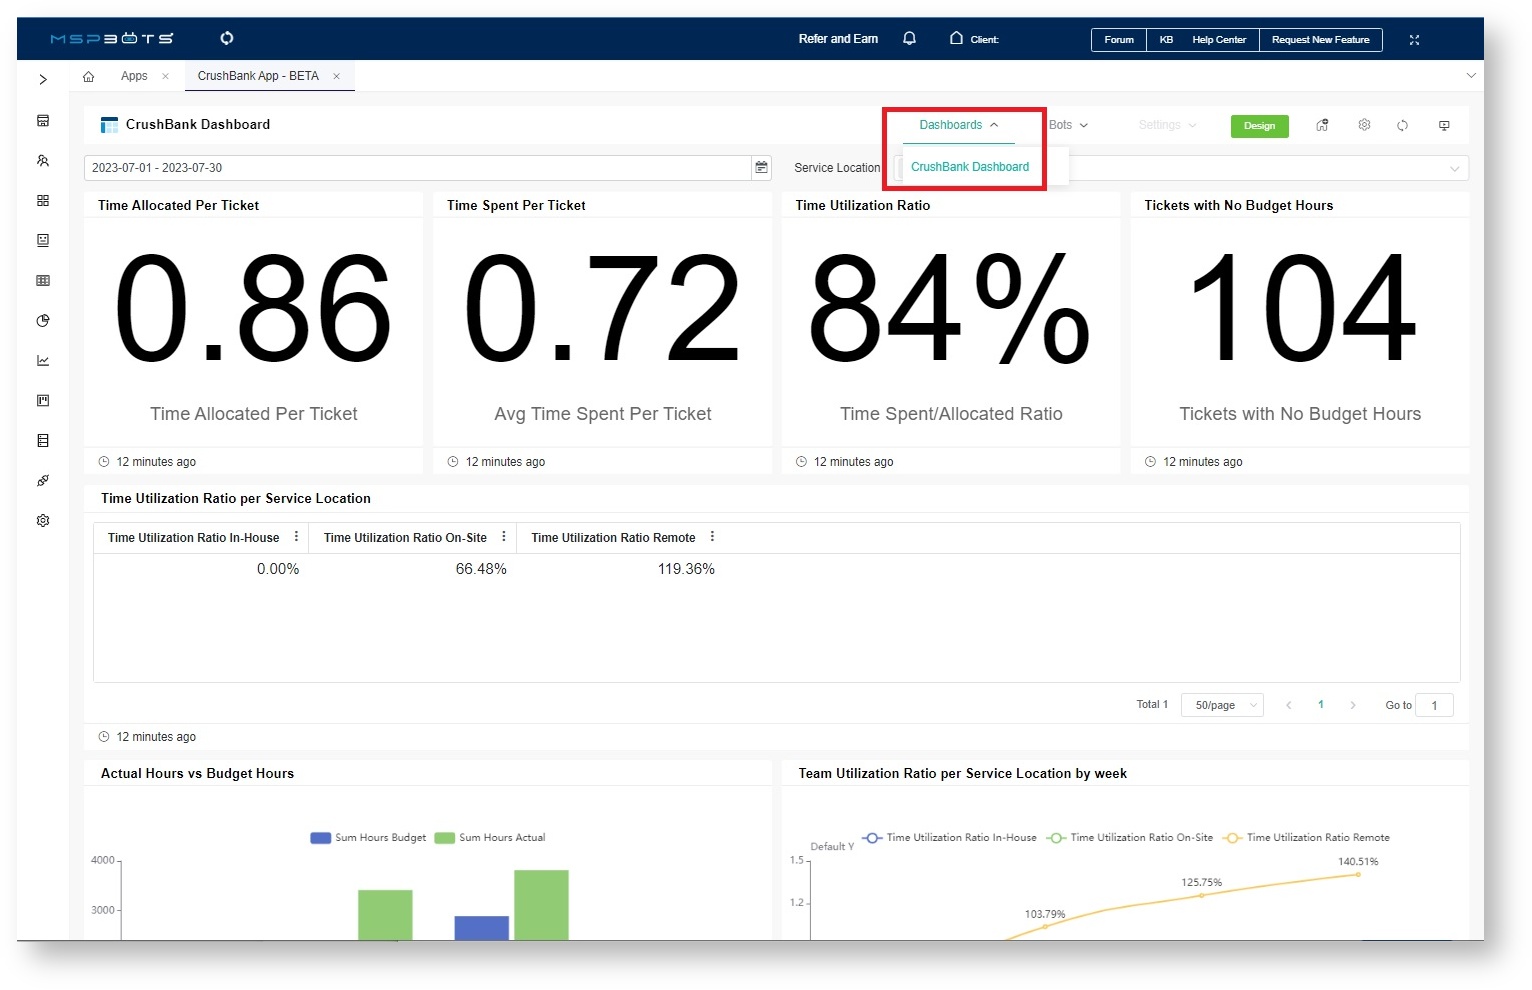
The CrushBank Dashboard has widgets that highlight real-time data for time allocation, utilization, and budget hours. You can filter the data by Date Range and Service Location.
How to access the dashboard
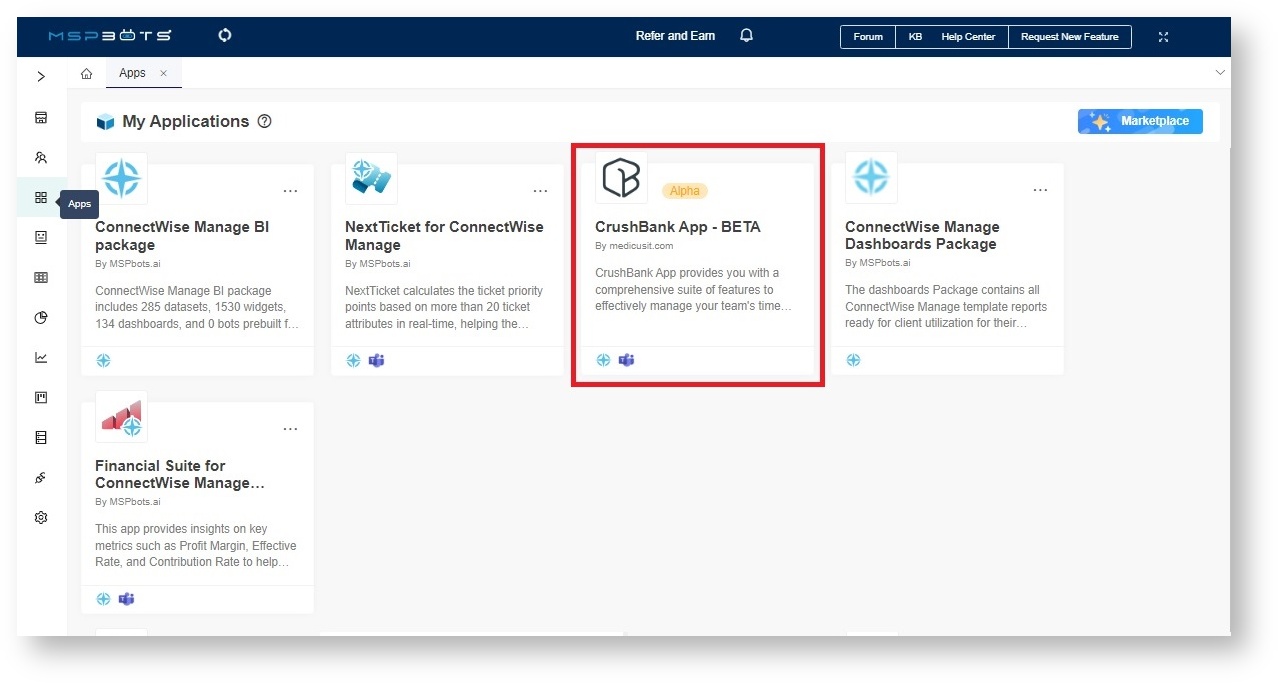
- Go to Apps on the MSPbots app and select CrushBank App - BETA.
- When the CrushBank App - BETA window opens, hover over Dashboards and select CrushBank Dashboard.
What are the widgets on the dashboard?
These are the data that is available from the CrushBank Dashboard:
- Time Allocated Per Ticket - This card number widget calculates and displays the average budget hours allocated per ticket.
- Time Spent Per Ticket - This card number widget calculates and displays the average actual hours spent per ticket.
- Time Utilization Ratio - This card number widget calculates and displays the average utilization ratio per ticket. The formula used to calculate is average actual hours / average budget hours.
- Tickets with No Budget Hours - This is also a card number displaying the count of service tickets with no budget hours.
- Time Utilization per Service Location - This grid widget calculates and displays the average utilization ratio per ticket per service location. The formula used to calculate is average actual hours / average budget hours.
- Active Hours vs. Budget Hours - This bar chart calculates and displays the sum of actual hours and budget hours per week.
- Team Utilization Ratio per Service Location by Week - This line chart shows the team utilization ratio per service location grouped by week.
- All Tickets - Grid - This is a grid widget that displays all service tickets and their corresponding details.
What are the options for filtering data?
The CrushBank Dashboards has two slicers to help you filter data:
- Date Range - Select the date or date range to generate data specific to your chosen time.
- Service Location - Select In-house, On-site, or Remote to compare utilization and budget hours for the different locations.
What are the CrushBank bots?
The CrushBank Bots notify ticket owners when a technician or team works under or over budget hours and when teams or locations meet specific budget hours.
Ticket Percentage Budget Monitoring
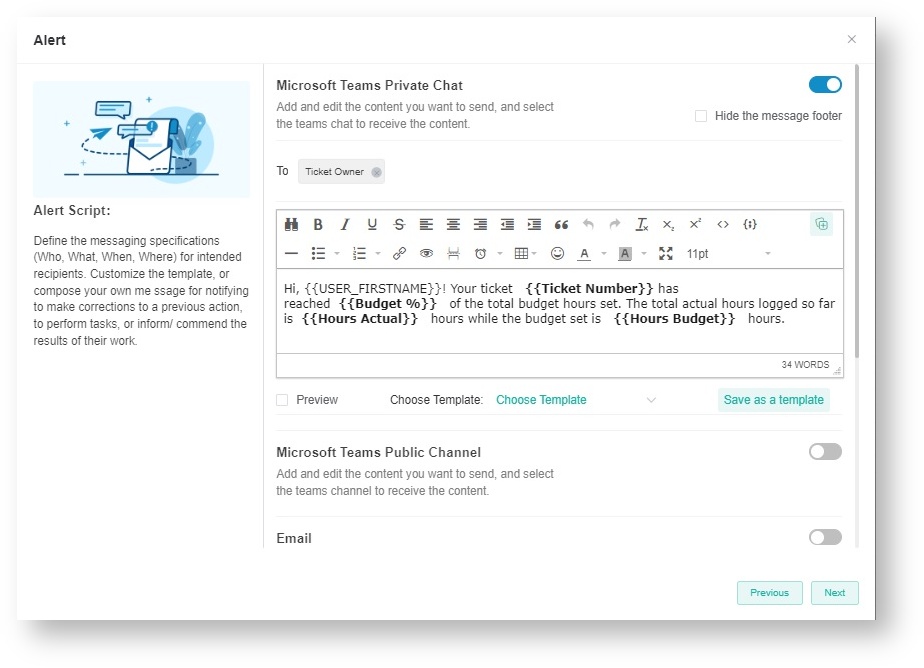
This bot monitors the budget allocated per ticket and notifies the ticket owner if the actual hours reach a specific % of the budget hours. Below is the notification template for this bot.
Ticket Closing Below Budget
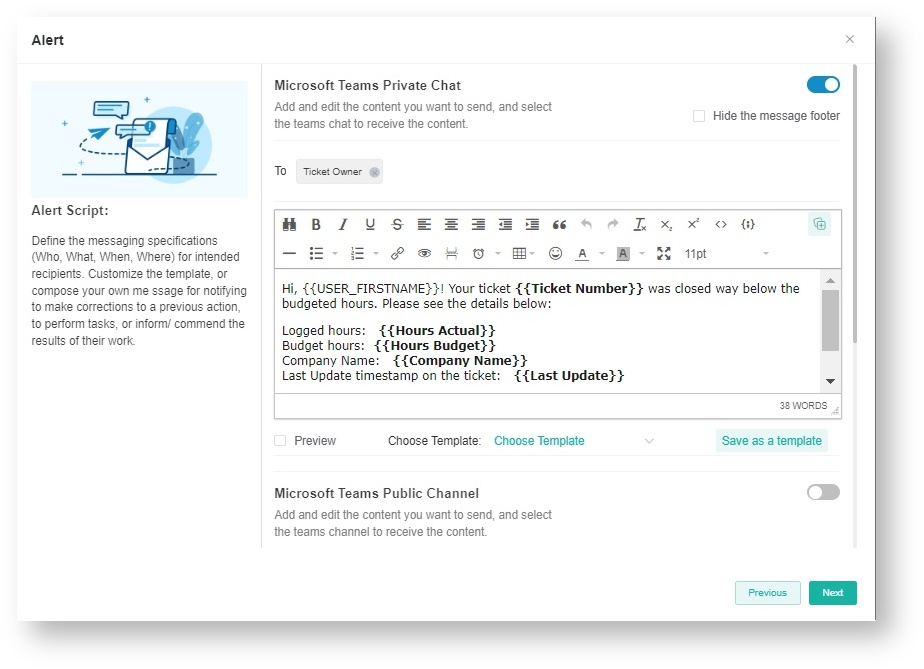
This bot monitors tickets that are closed even if the target budget hours are not met. Below is the notification template for this bot.
The CrushBank bots are set to send escalation messages to the ticket owner by default. To modify the escalation settings, refer to Set the escalation script section of the article How to Create a Bot.
The CrushBank app is currently in the Beta phase. To install, send your request to product@mspbots.ai.


