 N O T I C E
MSPbots WIKI is moving to a new home at support.mspbots.ai![]() to give you the best experience in browsing our Knowledge Base resources and addressing your concerns. Click here
to give you the best experience in browsing our Knowledge Base resources and addressing your concerns. Click here![]() for more info!
for more info!
N O T I C E
MSPbots WIKI is moving to a new home at support.mspbots.ai![]() to give you the best experience in browsing our Knowledge Base resources and addressing your concerns. Click here
to give you the best experience in browsing our Knowledge Base resources and addressing your concerns. Click here![]() for more info!
for more info!
The Agree
List of Dashboards
Dashboard Name | Description |
|---|---|
| Active Tickets Summary | This dashboard shows the count of active tickets per board, per status, and per date created. In addition, it gives full visibility of ageing tickets with respect to creation date and date of last update. |
| Ticket KPIs | This dashboard shows the monthly trend of relevant KPIs for open and closed tickets such as Ave. Time to Respond and Ave. Time to Resolve. All of these are also shown per customer for easy investigation. |
| Tickets Resolved - Technician Efficiency | This dashboard gives an overview on count and daily rate of Tickets Resolved for the selected date range. Also shows the % of tickets resolved by First Line Response. |
| Tickets Opened-Closed Same Day | This dashboard shows the count and percentage of tickets that were opened and closed on the same day as well as their weekly trend for the selected date range. |
| Ticket Labor Analysis | This dashboard compares the total ticket count with the total labor hours on a per company, board, and subtype level. It also shows their monthly trend for the selected date range. |
Terms and Calculations
Terms | Definition/Calculation |
|---|---|
| Active Tickets | |
| Ticket Age | For active tickets, current date - date opened |
| Tickets Resolved | Count of all tickets with a date resolved or date completed (if date resolved is not available) |
| Average Labor Entries | |
| % Closed First Contact | |
| First Line Response | |
| Single Technician on Ticket | |
| Multiple Technician on Ticket | |
| Reopened Tickets | |
| Avg. Time to First Time Entry | |
| Avg. Time to Respond | |
| Avg. Time to Plan | |
| Avg. Time to Resolve | |
| Opened/Closed Same Day | Tickets with same date opened and date closed |
Active Tickets Summary
This dashboard shows the count of active tickets per board, per status, and per date created. In addition, it gives full visibility of ageing tickets with respect to creation date and date of last update.
Available slicers are: Board, Team, Technician, and Date Range


Ticket KPIs
This dashboard shows the monthly trend of relevant KPIs for open and closed tickets such as Ave. Time to Respond and Ave. Time to Resolve. All of these are also shown per customer for easy investigation.
Available slicers are: Board, Team, and Date Range
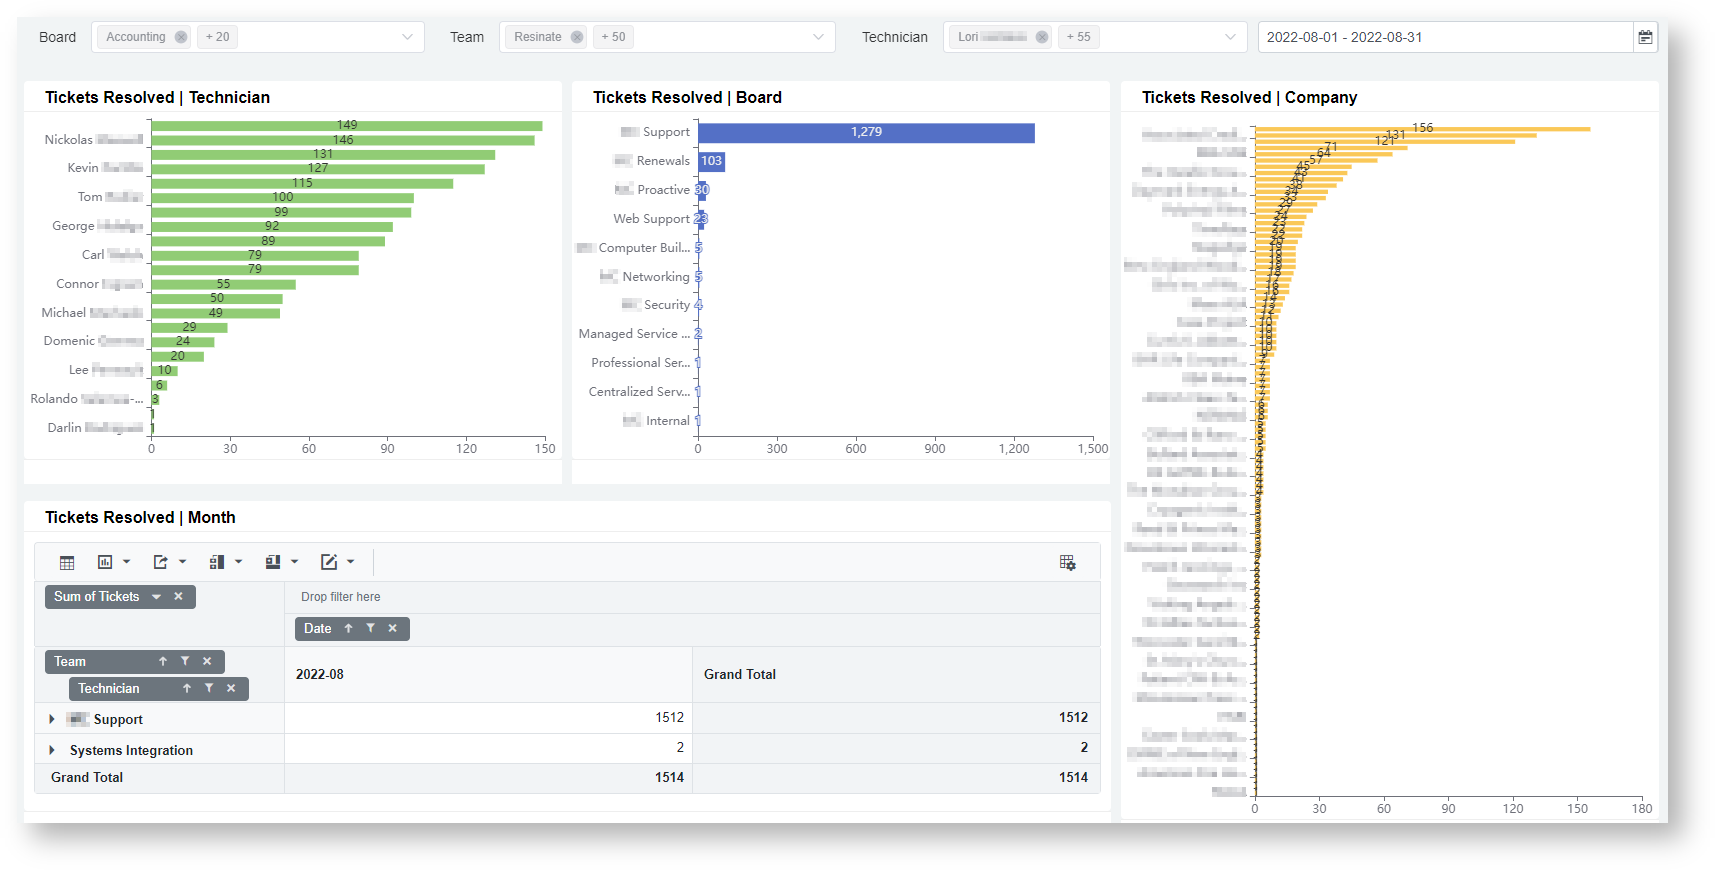
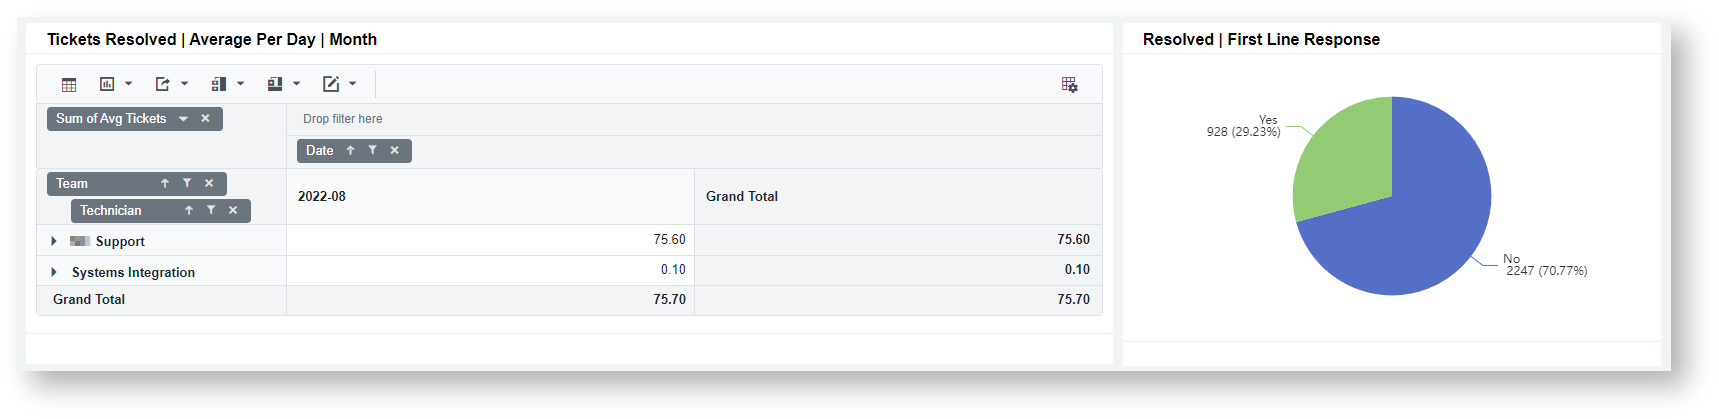
Tickets Resolved - Technician Efficiency
This dashboard gives an overview on count and daily rate of Tickets Resolved for the selected date range. Also shows the % of tickets resolved by First Line Response.
Available slicers are: Board, Team, Technician, and Date Range
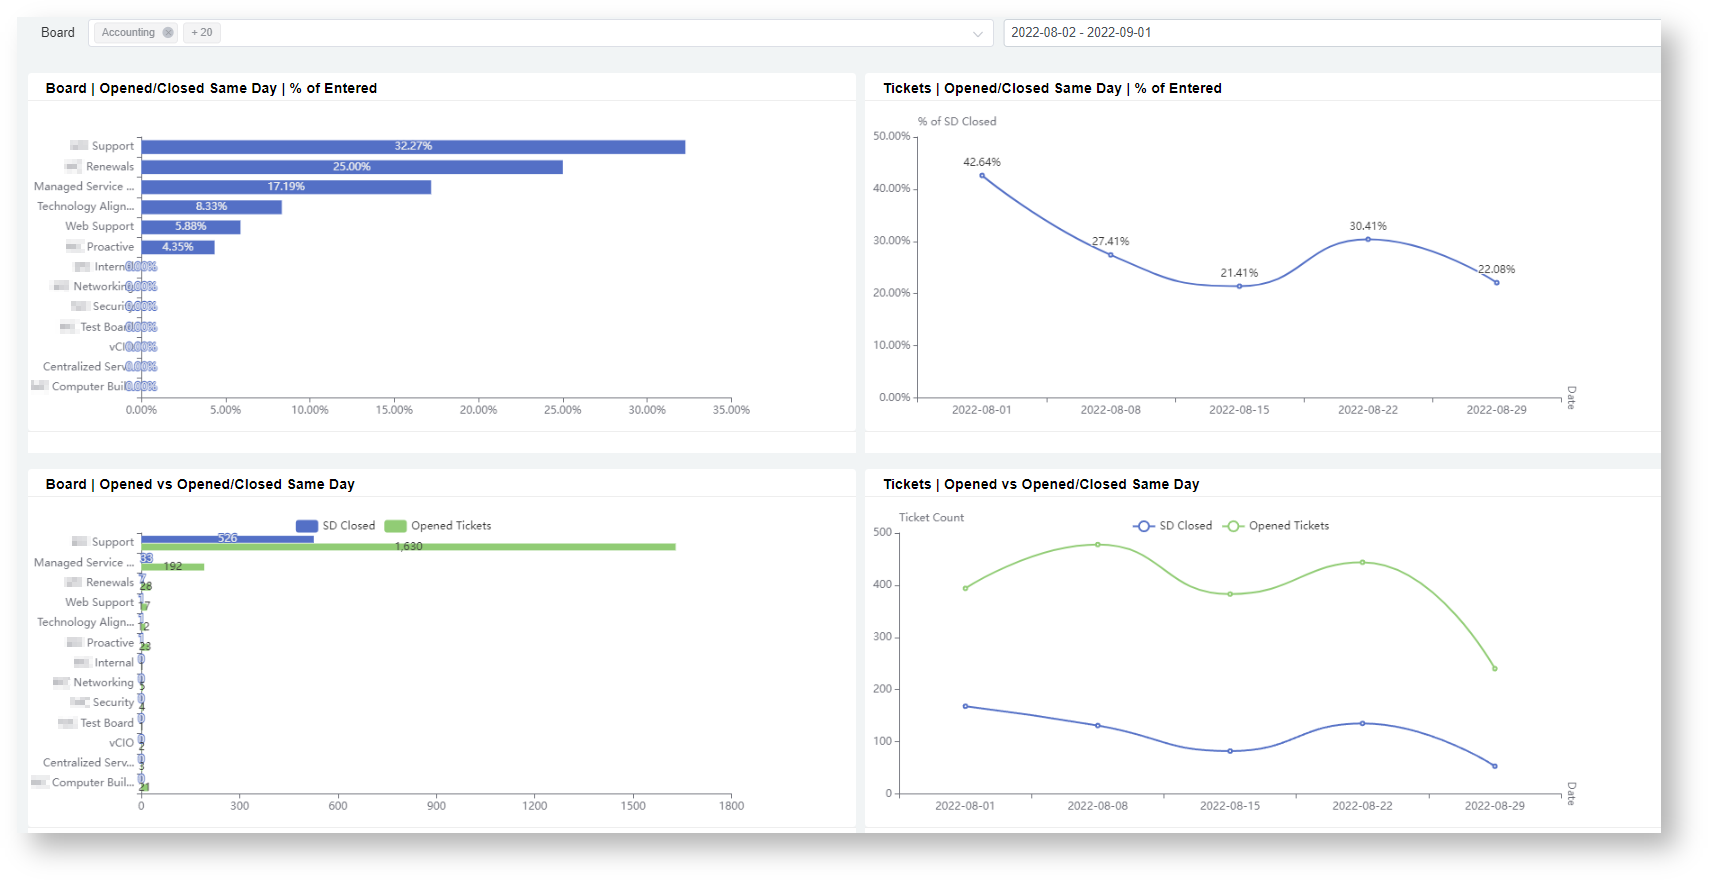
Tickets Opened-Closed Same Day
This dashboard shows the count and percentage of tickets that were opened and closed on the same day as well as their weekly trend for the selected date range.
Available slicers are: Board and Date Range
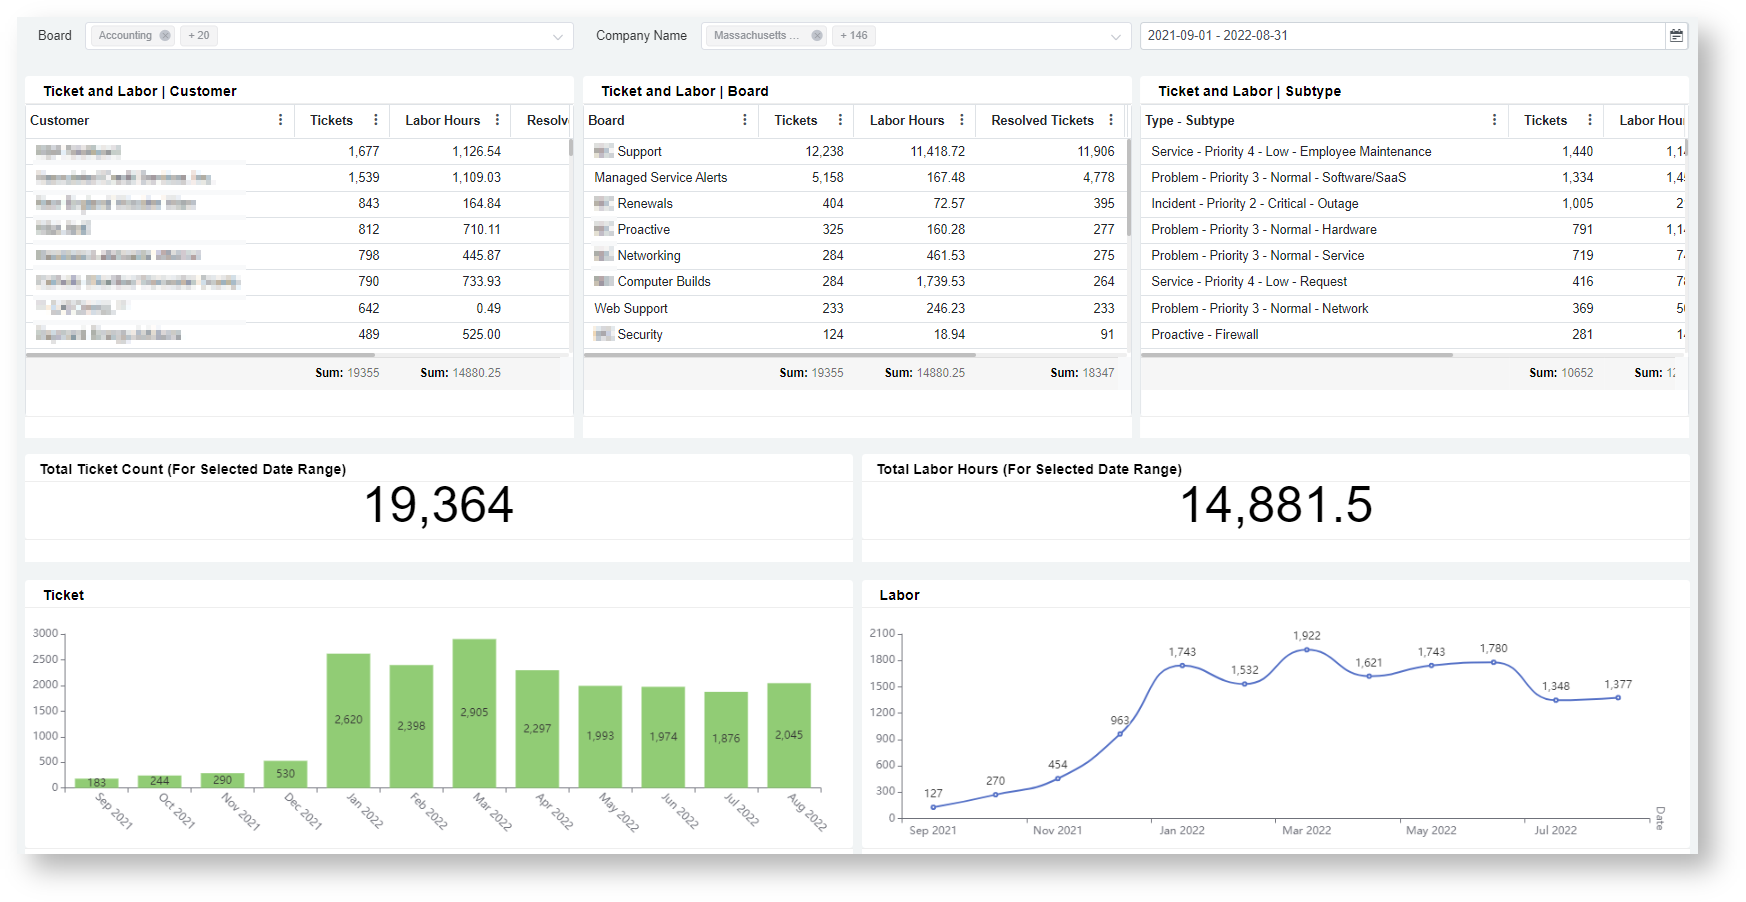
Ticket Labor Analysis
This dashboard compares the total ticket count with the total labor hours on a per company, board, and subtype level. It also shows their monthly trend for the selected date range.
Available slicers are: Board, Company, and Date Range
Overview
Content Tools
N O T I C E
MSPbots WIKI is moving to a new home at support.mspbots.ai![]() to give you the best experience in browsing our Knowledge Base resources and addressing your concerns. Click here
to give you the best experience in browsing our Knowledge Base resources and addressing your concerns. Click here![]() for more info!
for more info!