This article shows how to create a pie chart widget that shows the total number of tickets per issue type in the last 7 days. It applies to MSPbots users with an Autotask integration.
How to Create a Pie Chart Widget
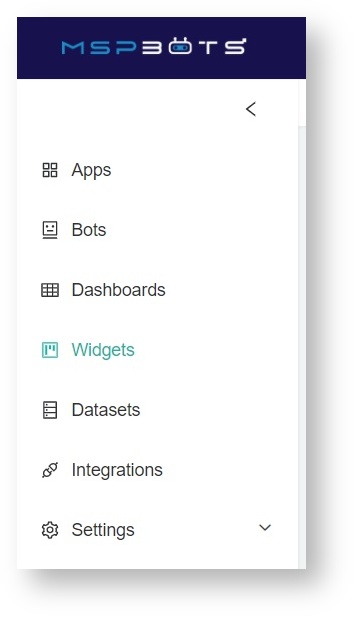
- Navigate to Widgets on the MSPbots app menu.
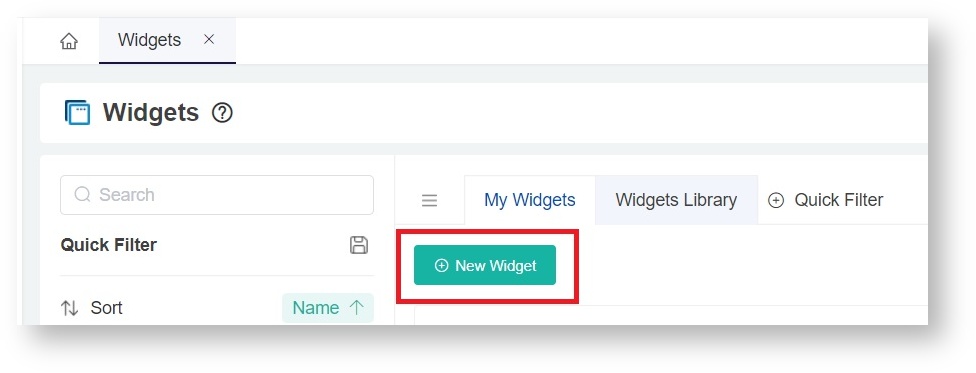
- Under My Widgets, click New Widget.
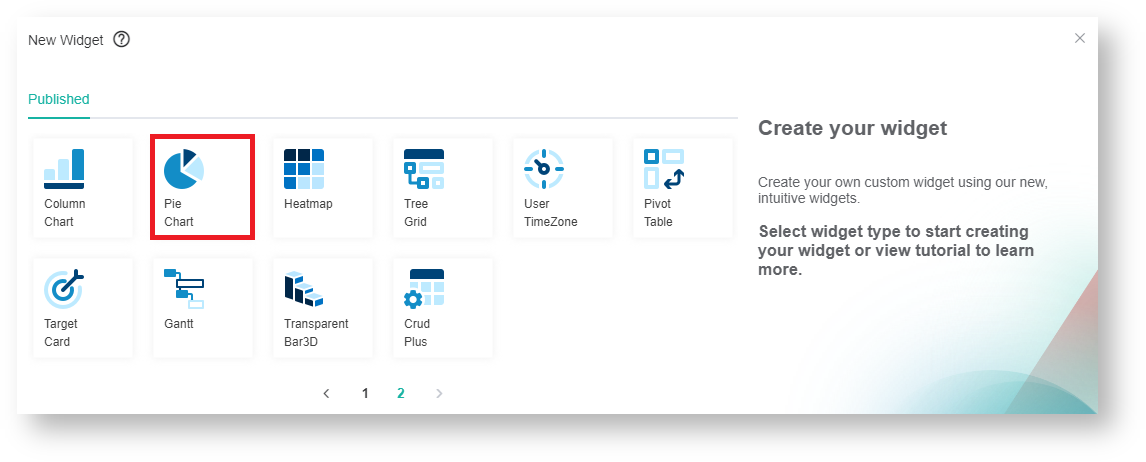
- Select the Pie Chart widget type on the New Widget window.
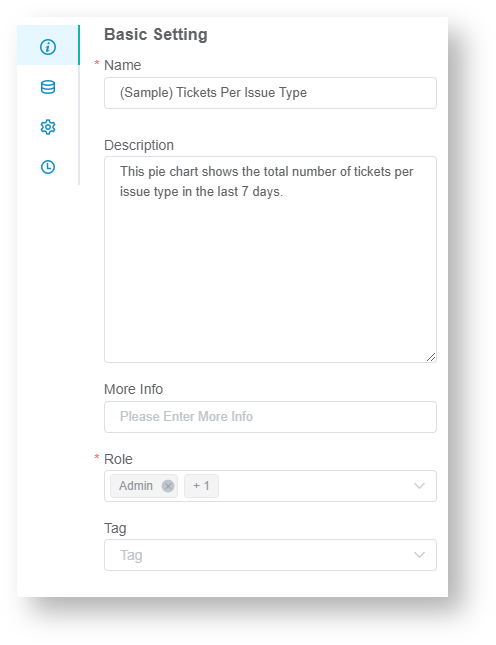
- When the Widget Builder window opens, go to the Basic Setting tab. Provide the following and click Apply:
- Name - Give the widget a name.
- Description - Give the widget a short description.
- Role - Select the roles you want to give access to.
- Go to the Dataset tab. Click the
 button and select New Layer.

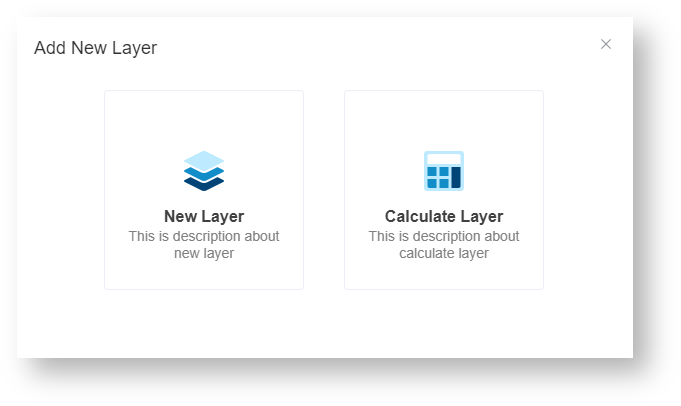
- On the Dataset window,
- Select the Dataset containing the information you want to use.
- Give a Name for the Datasource (optional).

- For Columns Display,
- Using the Column Name dropdown, select the field you want to show in the drill through. Click the
 button to add more rows.
 - Give an Alias and select a Business Type for each.
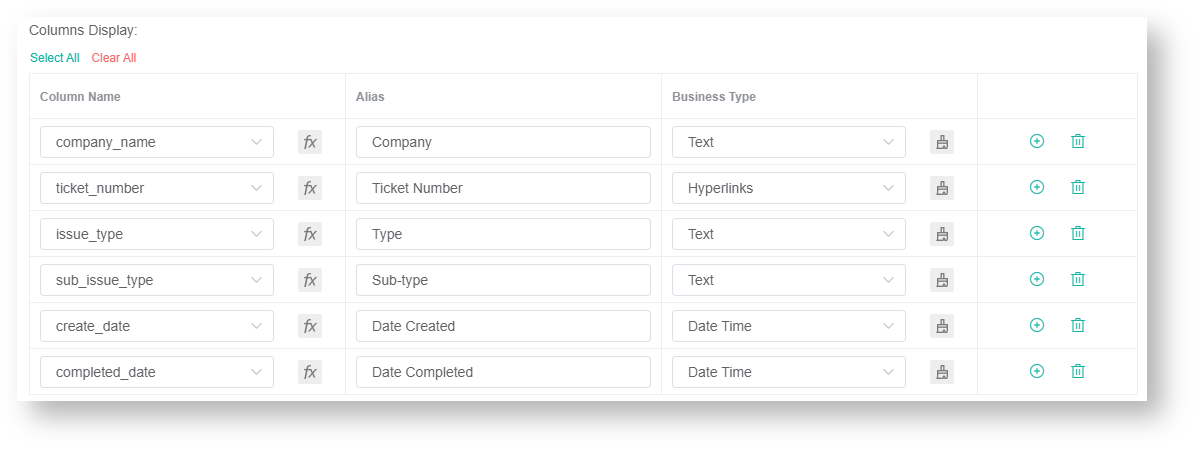
- For Filter,
- Click the
 button and choose between Add Condition and Add Group.
 - Add all the fields you want to be filtered.
- Set a condition/logic for each field using the next 2 dropdowns. For a guide on each options, refer to: What Conditions are Available for Creating Widgets?
- Select a logical operator for the filter group (AND or OR).

- For Measure,
- Click the
 button to show the Measure window.
 - Select a Summary Type.
- Select a Field to use in the computation.
- Give an Alias for the measure..
- Select a Format Type
- Click Add.
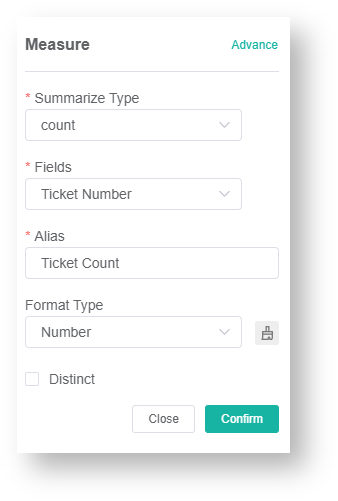
- For Dimensions,
- Select a field to be used for grouping the data.
- Give an Alias for the measure.
- Select a Format Type.
- Click Add.
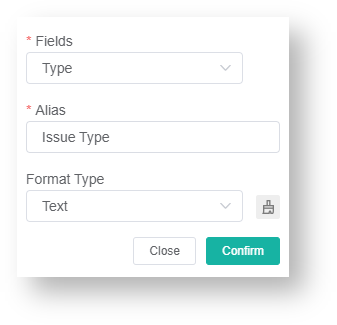
- Other optional settings are:
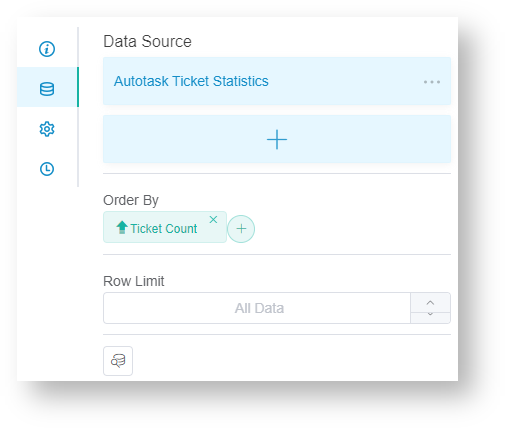
- Order By - Sorts the data based on the selected field.
- Row Limit - Sets a limit on how many rows of data will be shown.
- The same 2 options are available on the dataset tab, the difference is that they apply to the pie chart shown instead of the drill-down.
- Click Save.
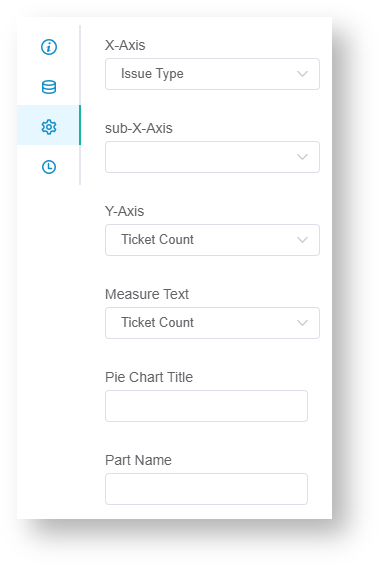
- Go to Config tab.
- Select the Dimension for X-axis. This will determine the grouping used to partition the pie.
- Set the Measure for Y-axis. This will be used for the values of each partition.
- (optional) For Sub X-axis, another measure can be added to further divide the pie chart.
- For Measure Text, select the same Measure used for Y-axis.
- (optional) Add a Pie Chart Title.
- (optional) Add a Part Name.
- Click Apply. This will show a preview of the pie chart created.
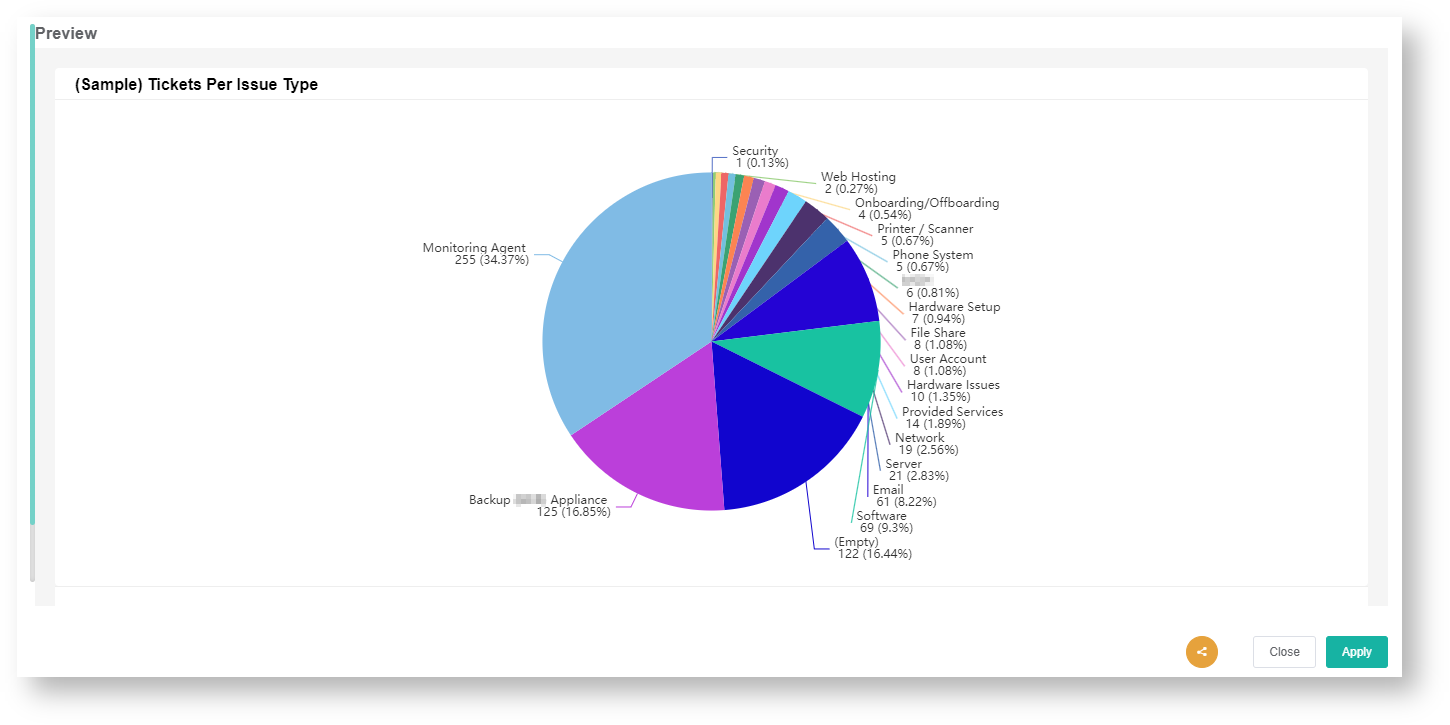
Example: How to Create a Pie Chart Widget that shows the total number of tickets per issue type in the last 7 days
- Navigate to Widgets on the MSPbots app menu.

- Under My Widgets, click New Widget.

- Select the Pie Chart widget type on the New Widget window.
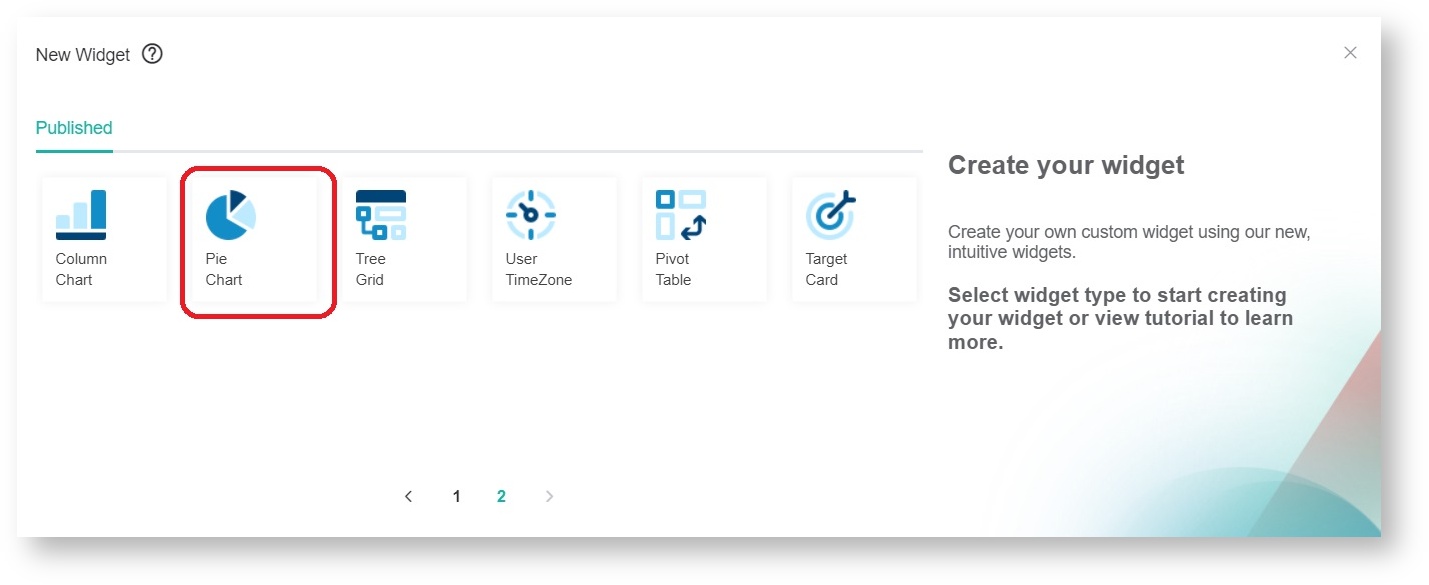
- When the Widget Builder window opens, go to Basic Setting tab. Provide the following and click Apply:
- Name - Tickets Per Issue Type
- Description - This pie chart shows the total number of tickets per issue type in the last 7 days.
- Role - Admin and User

- Go to Dataset tab. Click the
 button and select New Layer.


- On the Dataset window,
- Select the Dataset: Autotask Ticket Statistics
- Give a Name for the Datasource (optional).

- For Columns Display, add the fields below (format: Column Name - Alias - Business Type
- company_name - Company - Text
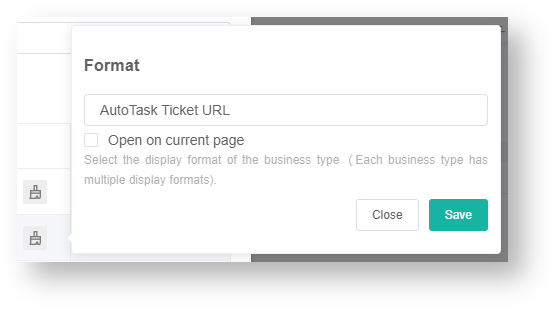
- ticket_number - Ticket Number - Hyperlinks (Additional Steps: Click the paintbrush icon > select Autotask Ticket URL as Format > Click Save)
- issue_type - Type - Text
- sub_issue_type - Sub-type -Text
- create_date - Date Created - Date Time
- completed_date - Date Completed - Date Time

- For Filter,
- Click the
 button and choose Add Condition.
 - Select the field create_date for the first dropdown then In for the second one.
- For the third dropdown, select Previous > 1 > Weeks (Mon-Sun)

- For Measure,
- Click the
 button to show the Measure window.
 - Select Count for Summary Type.
- Select Ticket Number for Fields.
- Type Ticket Count as an Alias.
- Select Number for Format Type.
- Click Confirm

- For Dimensions,
- Select Type for the field.
- Type Issue Type as an Alias.
- Select Text for Format Type.
- Click Confirm

- Click Save.
- On the Dataset tab, for Order By, click the
 button and select Ticket Count.

- Go to Config tab.
- Select Issue Type for X-axis.
- Select Ticket Count for Y-axis.
- Select Ticket Count for Measure Text.

- Click Apply. This will show a preview of the pie chart created.


button to add more rows.

button and choose between Add Condition and Add Group.

button to show the Measure window.


