You can create dashboards with specific, real-time data to highlight action items and metrics that help achieve and measure business goals. Once created, you can stream your dashboard on a screen, use the snapshot function, and send the data as a report based on a schedule, among others.
What's on this page:

What are MSPbots dashboards?
The MSPbots dashboards are centralized and visual representations of real-time metrics, data, and performance indicators for your company, allowing managers and stakeholders to gain insights, make informed decisions, and take appropriate actions. These dashboards have widgets for quick views of actionable data and filters for interactively selecting and viewing specific subsets of data based on predefined criteria or parameters. Start using these dashboards by viewing the available templates or creating your dashboards for your specific business needs.
Why should I create a dashboard?
Creating dashboards helps in the analysis, communications, and monitoring of data that aid in decision-making and reaching targets across different areas of your business.
Service Delivery - Dashboards help track response times, service availability, and customer satisfaction allowing service teams to identify bottlenecks, address issues promptly, and ensure service level agreements are met.
Support Service - Dashboards display real-time incident data, response times, and customer feedback to help support teams identify and prioritize critical issues, prioritize tickets, effectively manage resources, and address recurring issues.
Leadership - Dashboards facilitate data-driven decision-making, performance evaluation, and organizational strategies.
Project Management - Dashboards are essential in tracking and communicating project progress, milestones, and deliverables. These also help identify potential risks, allocate resources, and ensure projects are on schedule.
Remote Management and Security Monitoring - Dashboards give real-time visibility of the overall health of your IT assets and ensure systems remain compliant with security policies, vulnerabilities are mitigated, and automated tasks are done without issues. These also help in security management, like threat detection and response, data policy, access control and authentication, and security incident response.
Peer Groups - Dashboards are helpful in trend analysis, benchmarking, goal tracking, and knowledge-sharing.
Relevant applications and permissions
You can set up dashboards for all MSPbots apps, BI packages, and applicable integrations. Only users with admin permissions can create dashboards and reports. If you don't have enough permissions, contact your administrator for help.
How to set up a dashboard
Do the following to make your dashboard:
- Open the MSPbots app as administrator.
- Navigate to Dashboards on the menu and click the New Dashboard button.
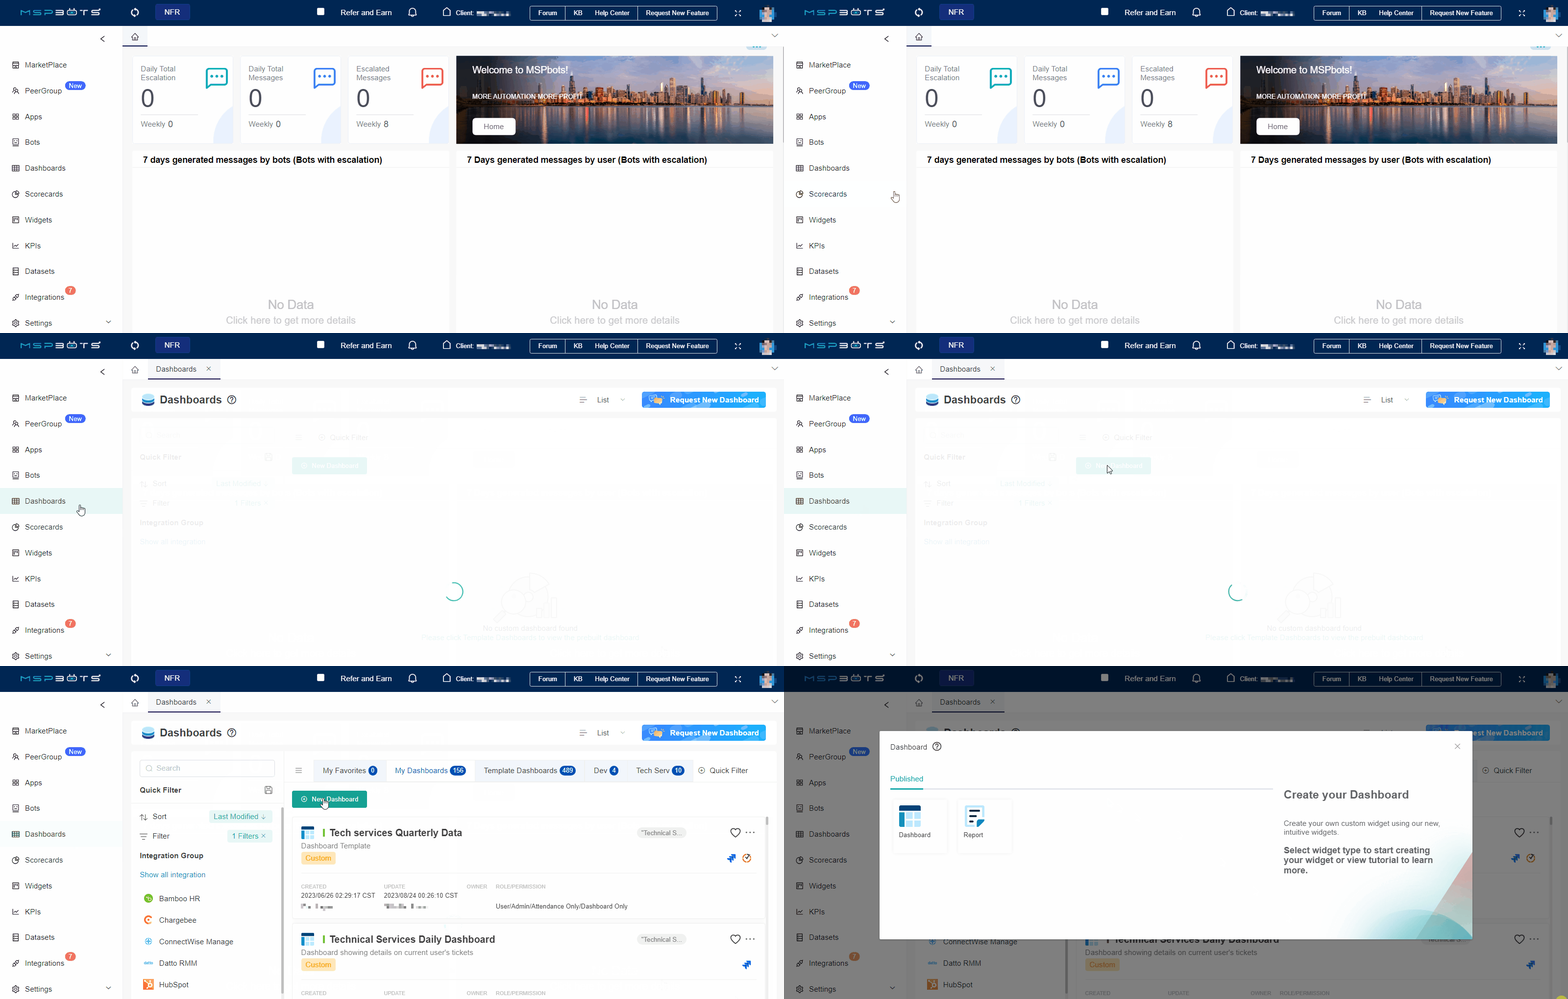
- In the Dashboard window, select Dashboard.
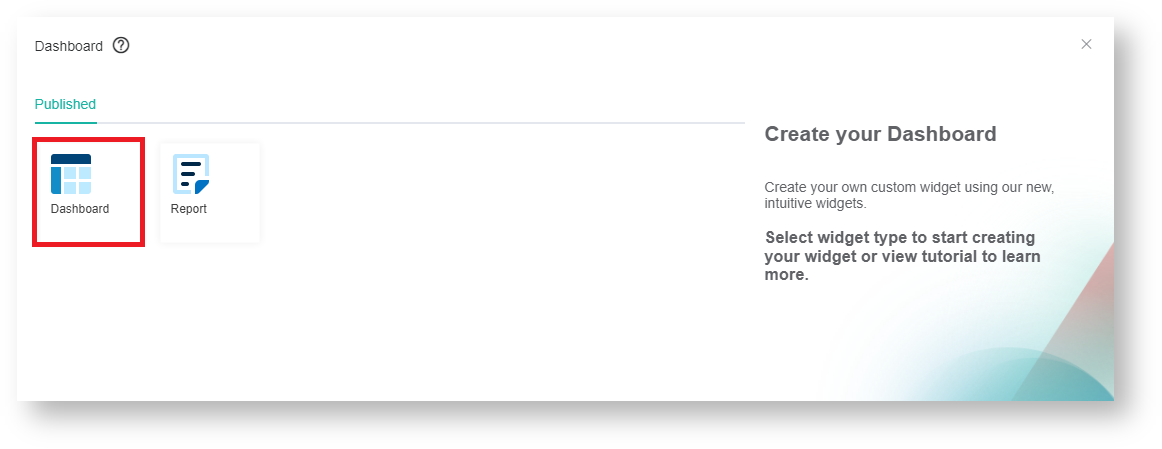 -
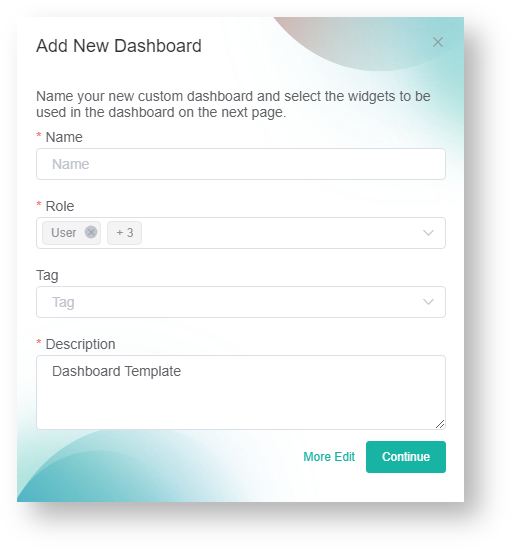
- - When the Add New Dashboard window opens, do the following:
- Enter your dashboard's name in the Name field.
- Click the Role dropdown menu and select the roles that will have access to the dashboard.
- Click the Tag dropdown menu and select one or multiple tags to label your new dashboard.
- Next, provide a Description for your dashboard.
- Click Continue. This opens the tab for your new dashboard.

- The window for your dashboard opens with a message saying, "Your dashboard is empty!" Click the Add Widgets button.
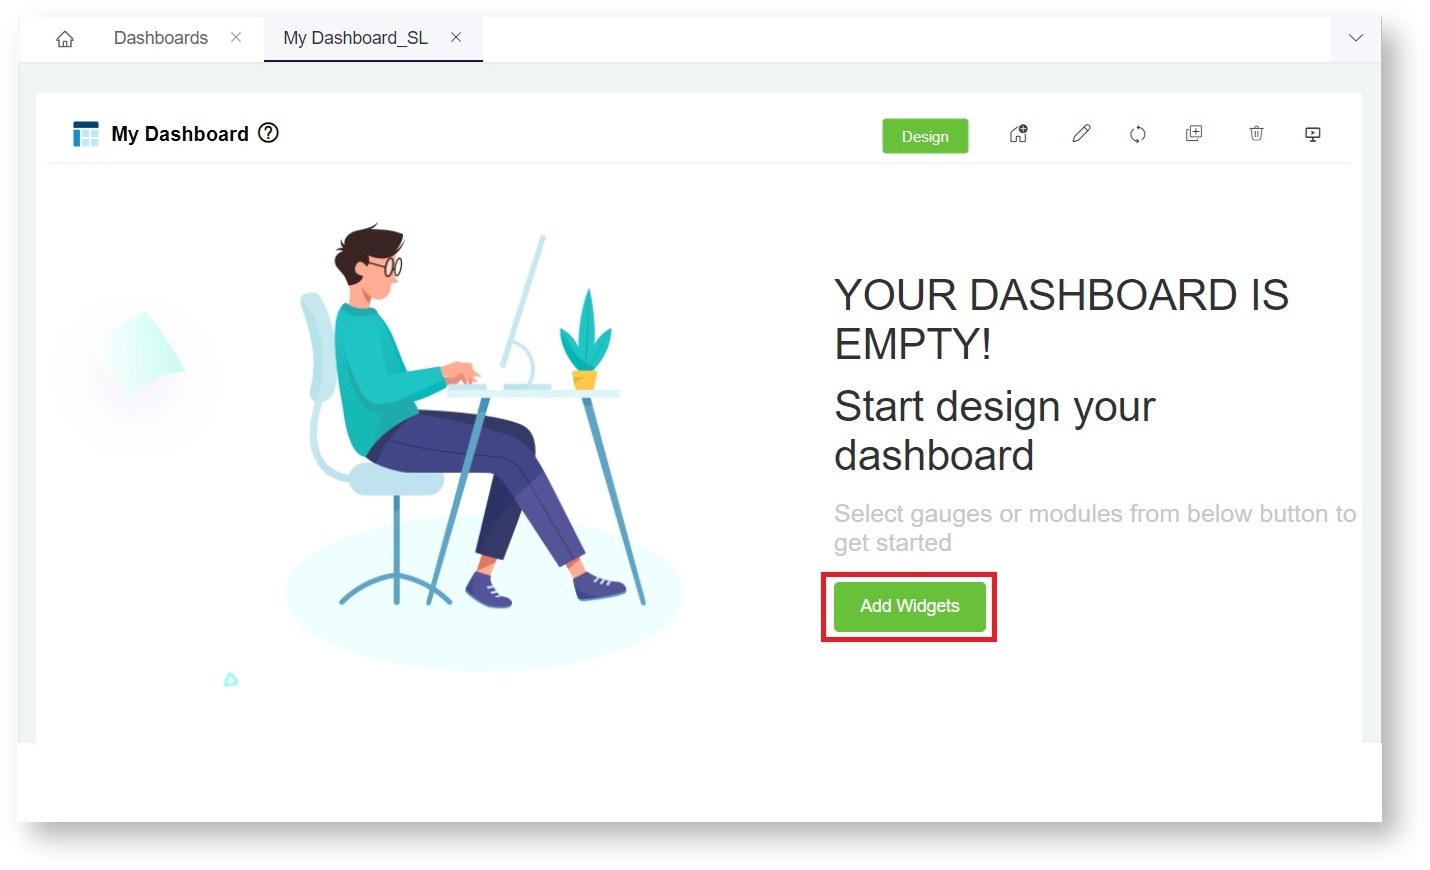
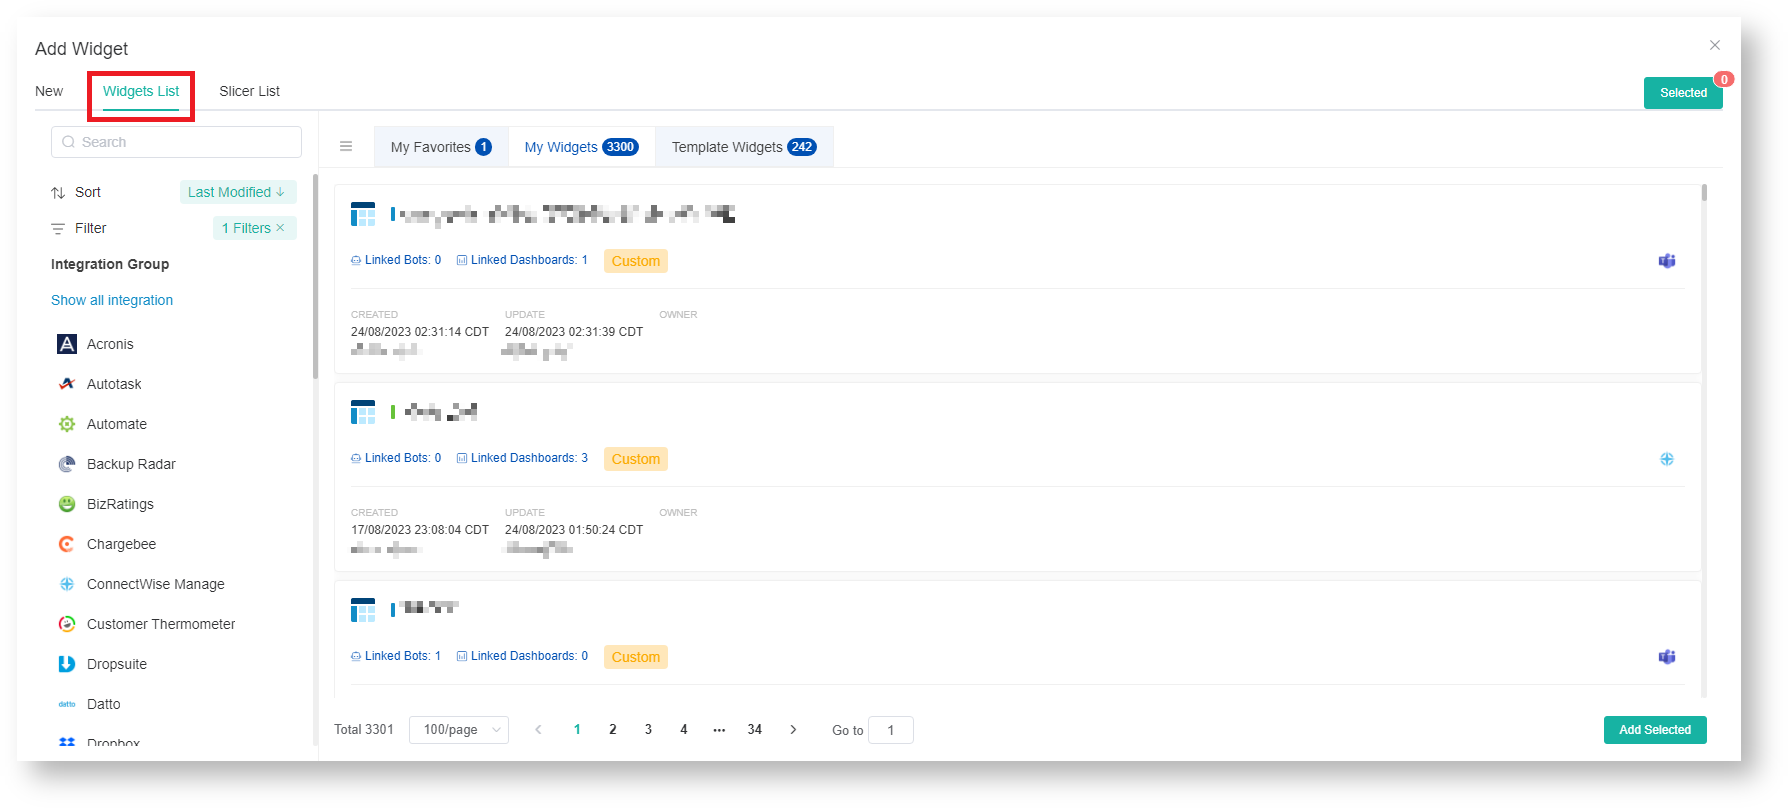
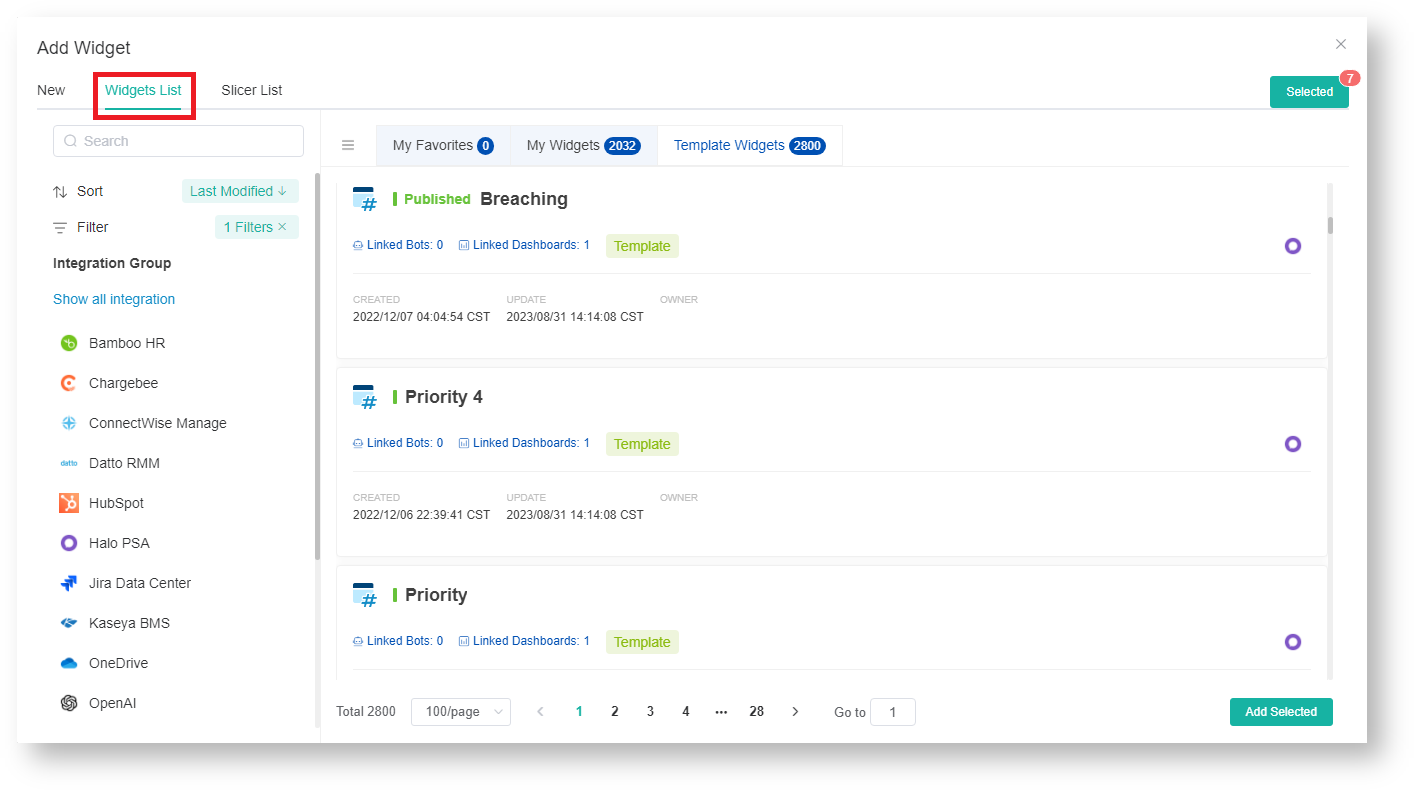
- When the Add Widget window appears, click Widgets List.

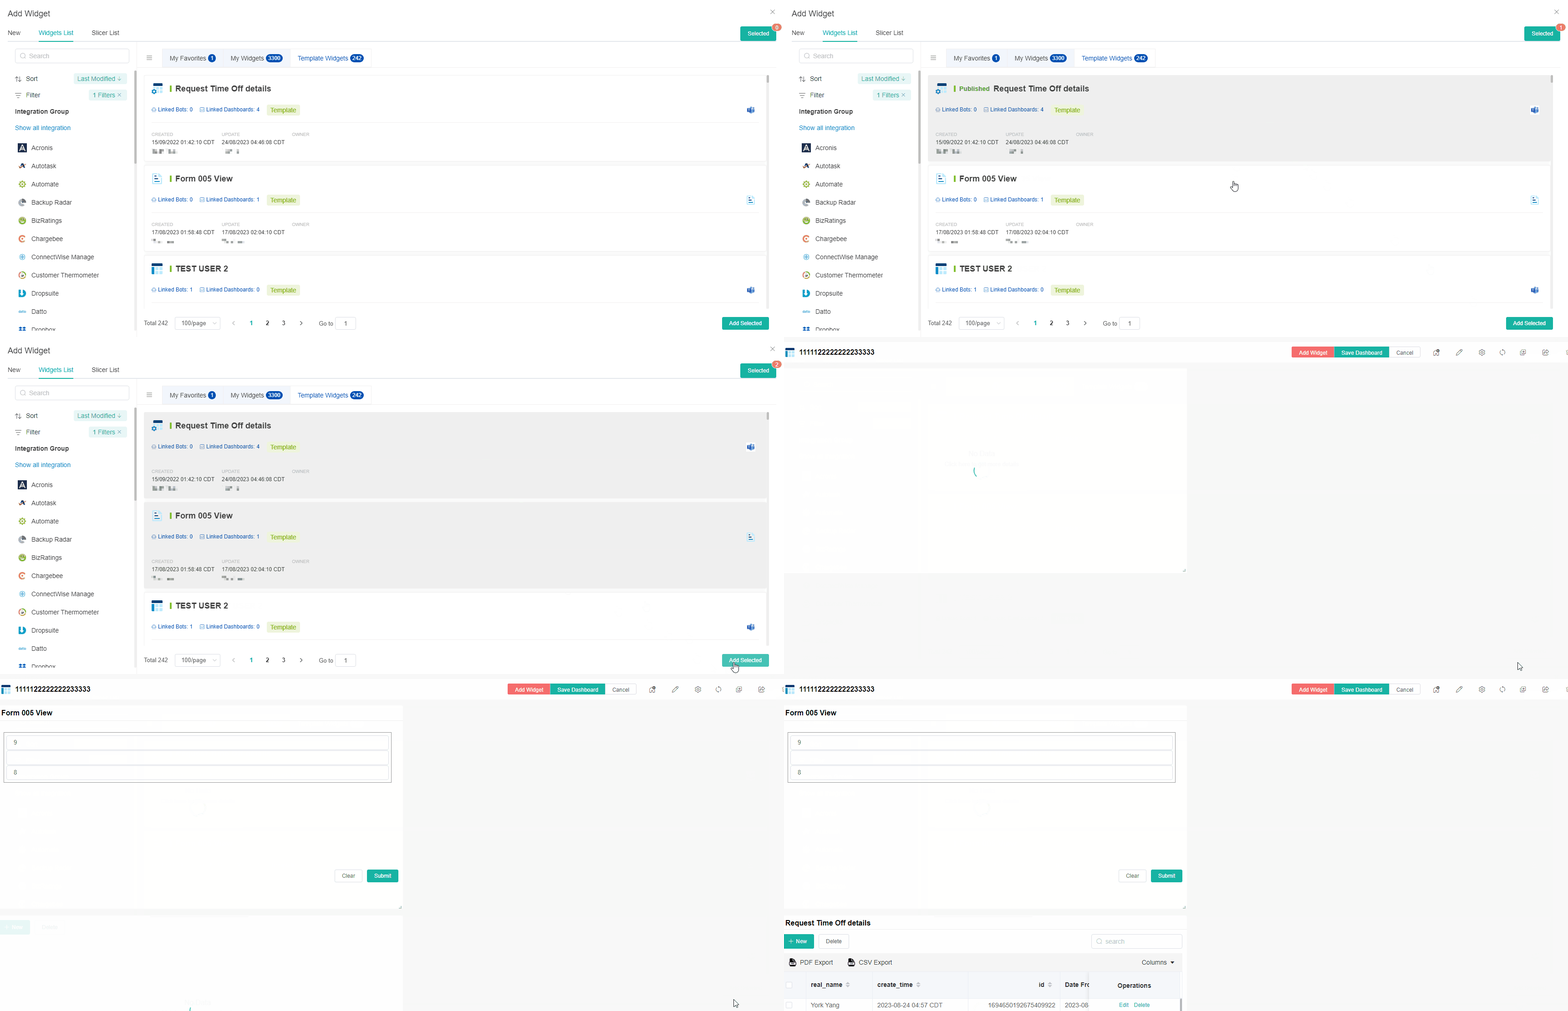
- Select widgets for your dashboard and click the Add Selected button. The widgets you selected should appear in the dashboard you have just created.

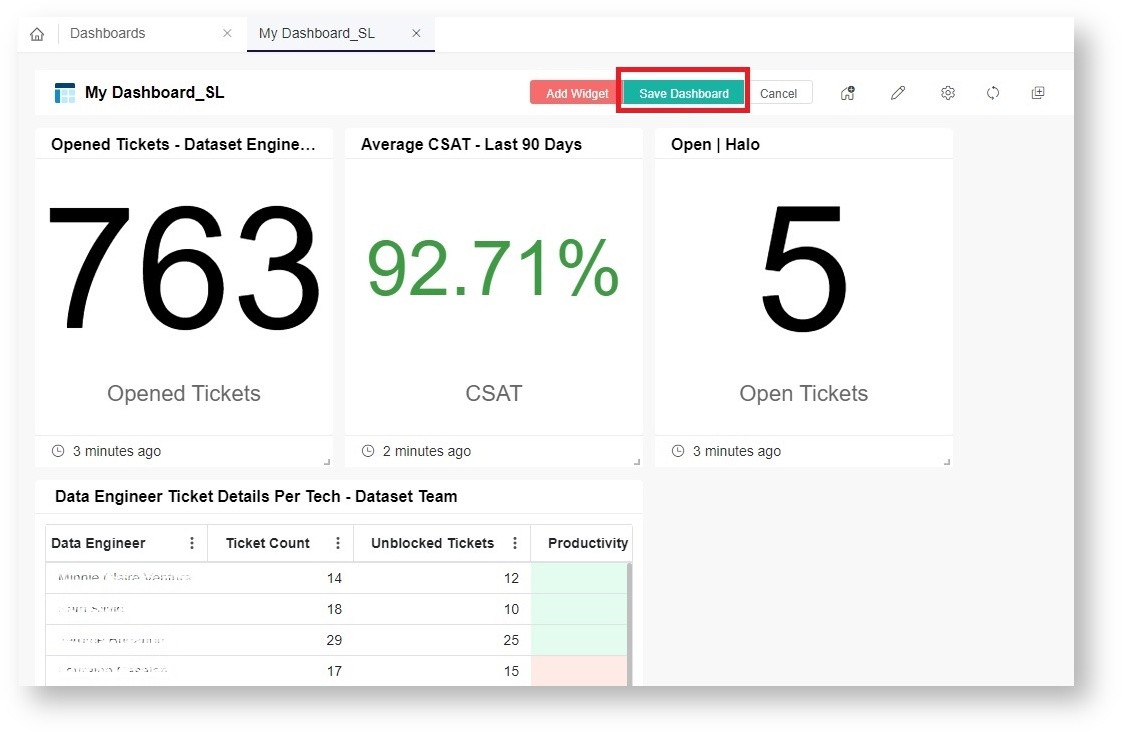
- Click the Save Dashboard button when done.

*The asset in the image is for demonstration only.
If you do not want to save this dashboard, click Cancel.
 How to modify the widgets in my dashboard
Do the following steps to add, edit, remove, or move the widgets in your dashboard:
Adding more widgets to the dashboard
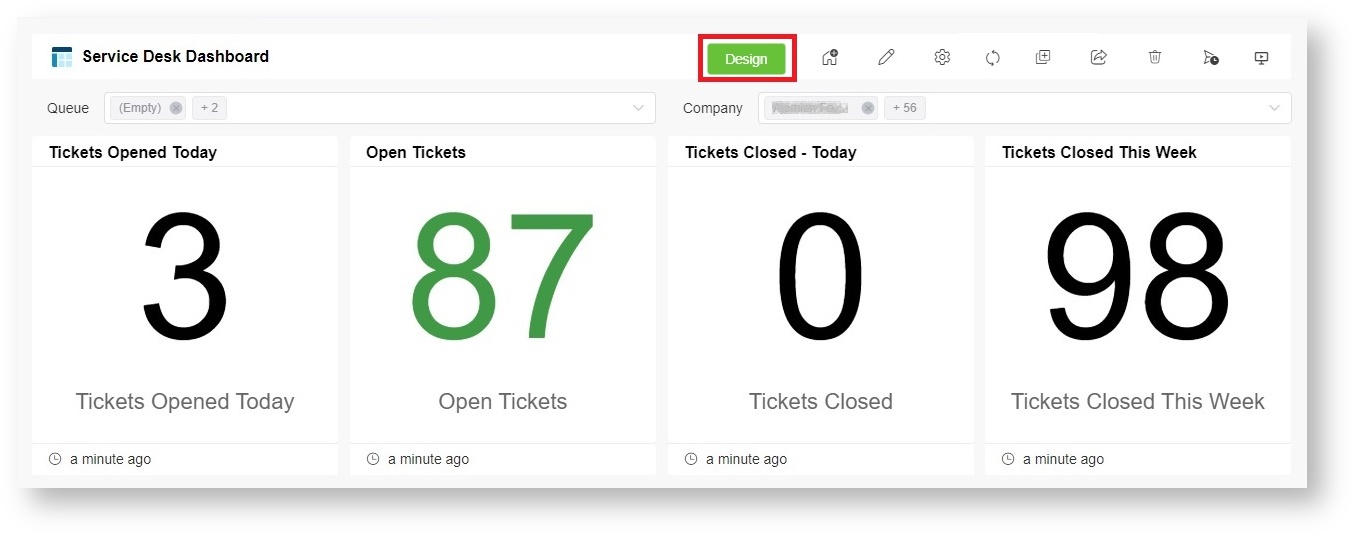
- Open the dashboard you want to configure and click the Design button.

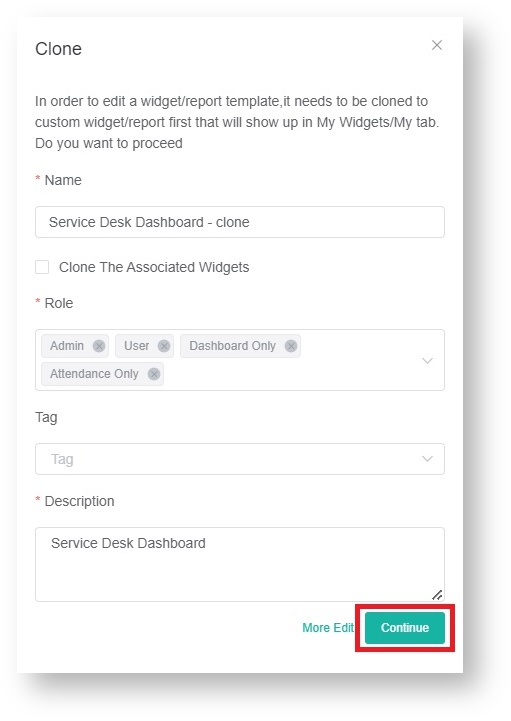
*The asset in the image is for demonstration only. - When the Clone window opens, review the required details and click Continue to open your dashboard.

You need to clone dashboards and widgets before you can edit and customize these assets. |
- Click the Add Widget button.
- Go to the Widgets List and select the widgets for adding.
- Click Add Selected.

- Click Save Dashboard to save the settings. If you do not want to save the changes you made, click Cancel.

Moving widgets in the dashboard
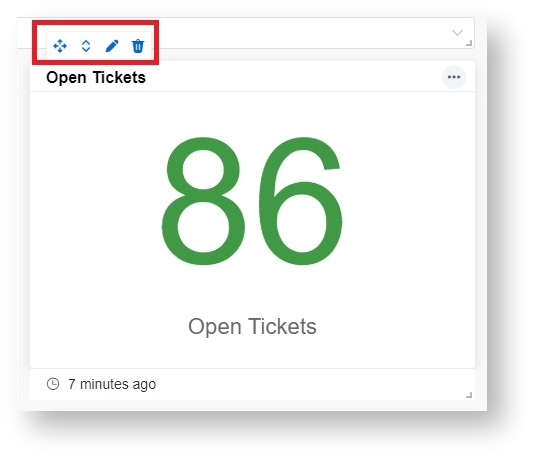
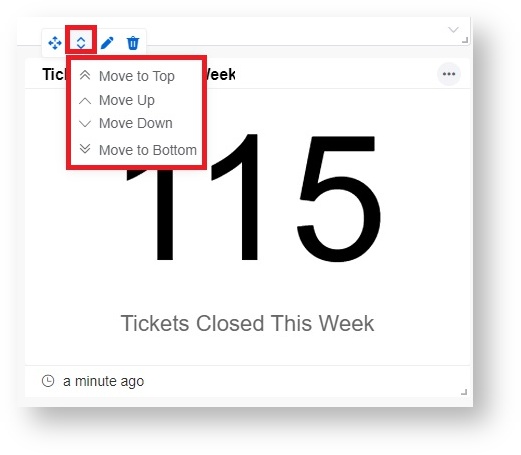
- Hover the cursor over a widget to show the move, edit, and delete icons.

- Click
 and drag the widget to another place in the dashboard.
 - You can also hover the mouse over
 and select Move to Top, Move Up, Move Down, or Move to Bottom.
- Click Save Dashboard to save the settings. If you do not want to save the changes you made, click Cancel.

Editing a widget in the dashboard
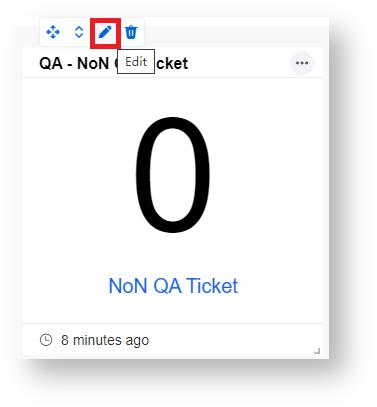
- Hover over a widget to show the move, edit, and delete icons.

- Click
 .
.

- Edit the widget settings in the Widget Builder.
- Click Apply > Close when done editing.
- When back in your dashboard's window, click Save Dashboard to save the settings.

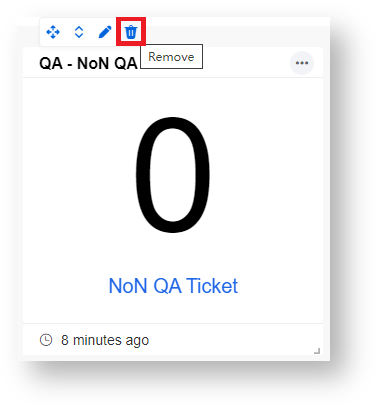
Removing a widget from the dashboard
- Click
 and Confirm.

- When back in your dashboard's window, click Save Dashboard.

Other options in widgets
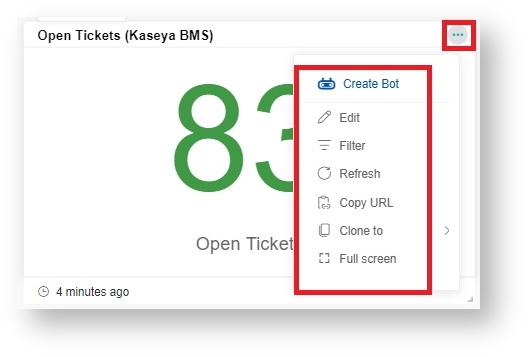
- Hover the cursor over
 and select Edit, Filter, Refresh, Copy URL, Clone to, or Full screen.
 - Edit - Edits the widget
Filter - Adds filtering conditions to the widget
Refresh - Refreshes the data on the widget
Copy URL - Copies the URL address of the widget
Clone to - Clones the widget and has options to Clone to "My widgets", Clone to existing dashboards, and Clone to new dashboard.
- Full screen - Displays the widget in full screen

- After you have finished configuring, click Save Dashboard to save the settings.

What other actions can I do in the dashboard?
You can also do the following configurations from the dashboard:
- Configure widgets - Click the Design button to configure the widgets in the dashboard. For detailed design instructions, refer to the section on How to modify the widgets in my dashboard.

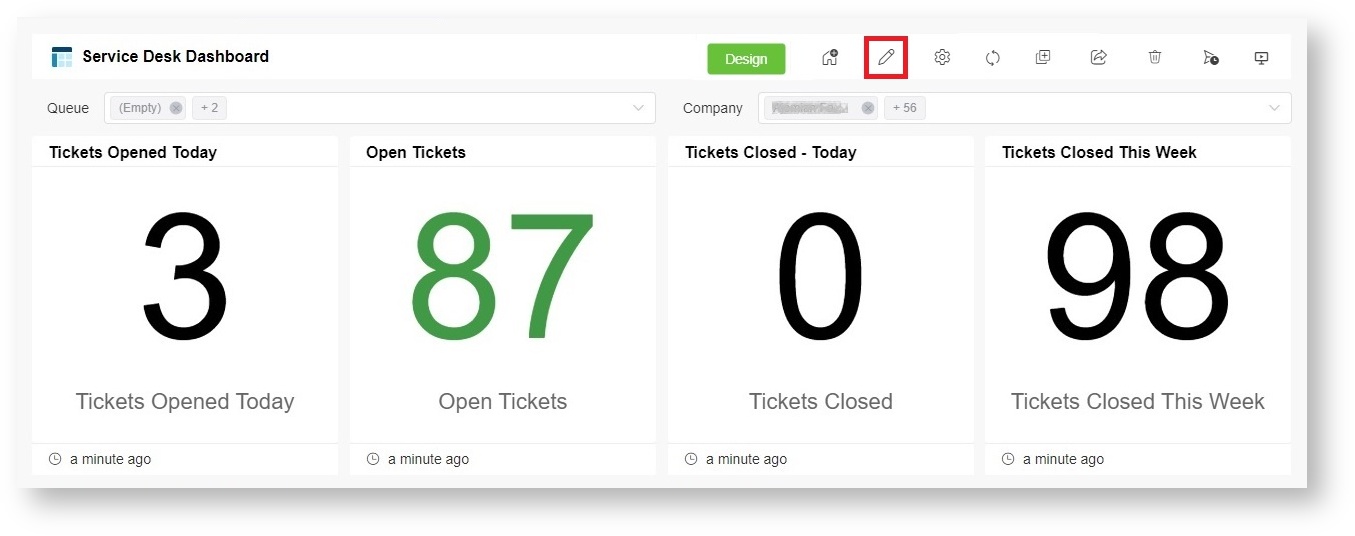
- Edit the dashboard's basic information - Click
 to edit the basic information of the dashboard.

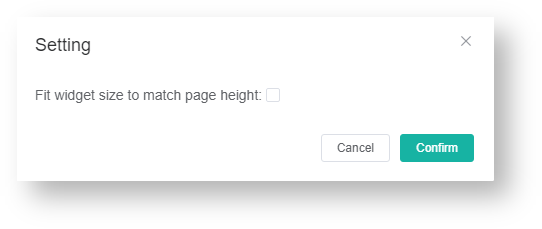
- Adjust the widget size - Click
 and the Confirm button to fit the widget size to match the page height.

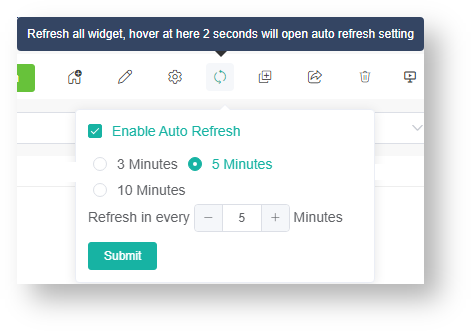
- Refresh all widgets - Click
 to refresh all widgets. Hovering over the icon for two seconds opens the auto-refresh settings where you can set your preferred refresh interval. Once set, the dashboard will automatically refresh according to your chosen interval. This setting is applied when presenting a single dashboard or rotating multiple dashboards in Presentation mode, streaming dashboards to TV, sharing the dashboard with others, and opening dashboards in the Client Portal. The dashboards will continue to apply the refresh settings even when the tabs are minimized.

The following rules apply once the auto-refresh feature is enabled and the refresh interval is set: - If the current time when you open the dashboard is equal to or later than the last refresh time plus the auto-refresh interval, then the page will refresh automatically. A new countdown will start from the current time.
Example: The last refresh time is 9:00 and the auto-refresh interval is set to 5 minutes.
If you access the dashboard at 9:08, it will automatically refresh once and start a new auto-refresh timer at 9:08.
- If you open the dashboard before the last refresh time plus the auto-refresh interval, the dashboard will not refresh. It will refresh automatically when the set interval is reached.
Example: The last refresh time is 9:00 and the auto-refresh interval is set to 5 minutes.
Using the same example, the dashboard will not refresh if you access it at 9:02, which is earlier than 9:00 and the set refresh at 5 minutes. If you stay on the page until 9:05, the dashboard will automatically refresh at 9:05. However, if you leave the page before 9:05, the last refresh time will remain at 9:00.
- The dashboard will follow the set auto-refresh interval while it is open, and the automatic page refresh will stop when the dashboard is closed.
|
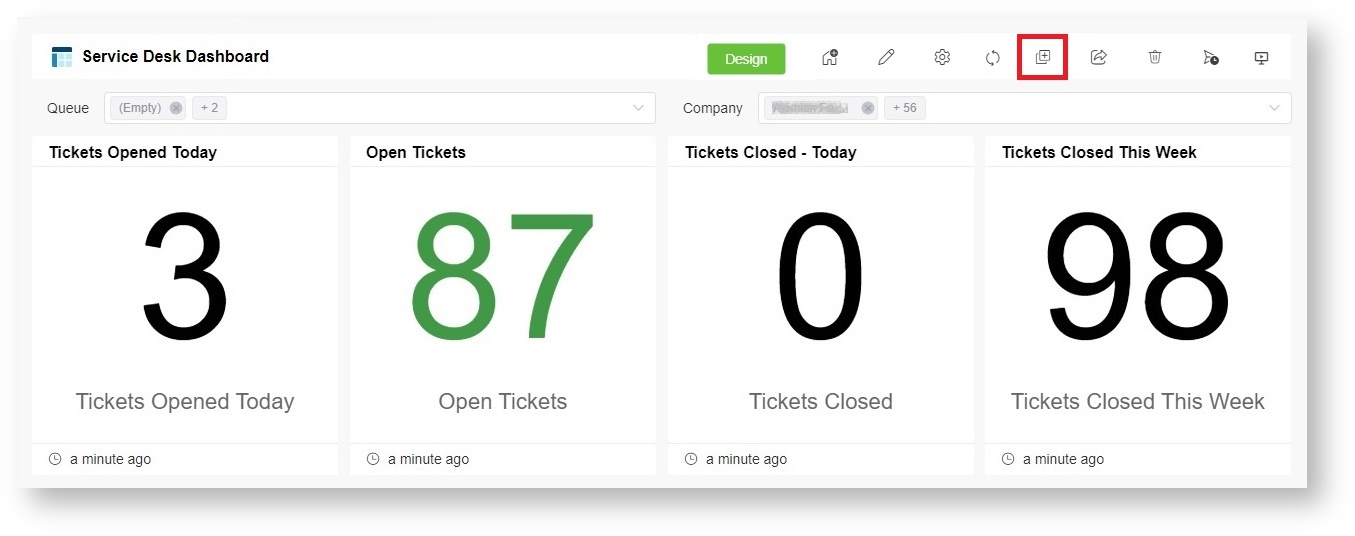
- Clone the dashboard - Click
 to clone the dashboard. For detailed instructions, refer to How to Clone a Dashboard.

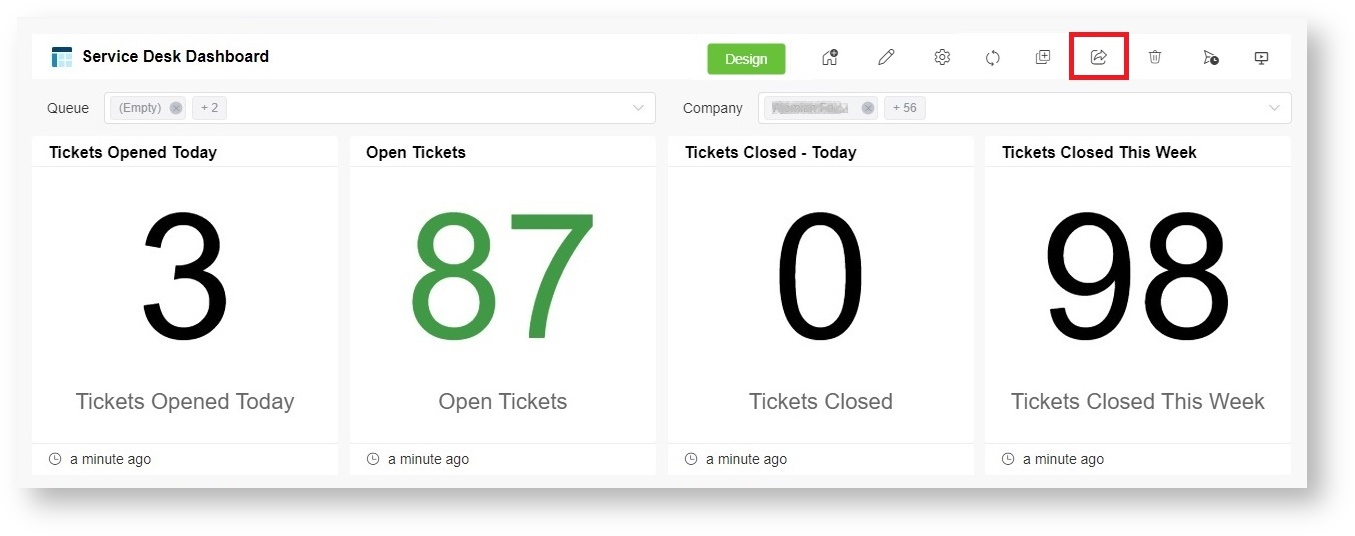
- Share your dashboard - Click
 to share the dashboard.

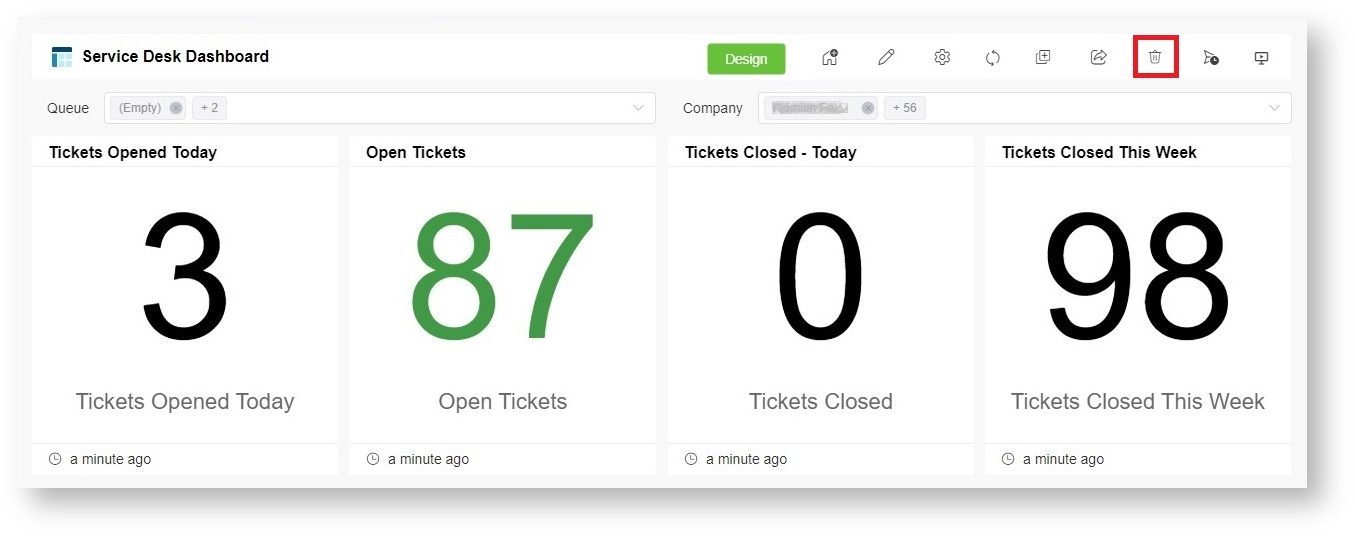
This feature supports sharing through a shareable link, Embed and Stream to TV. Please refer to the following links for more information: - Delete your dashboard - Click
 to delete the dashboard.

- Create Scheduled Report - Click
 to configure dashboards or reports to be sent as scheduled reports to email recipients according to a predefined schedule.
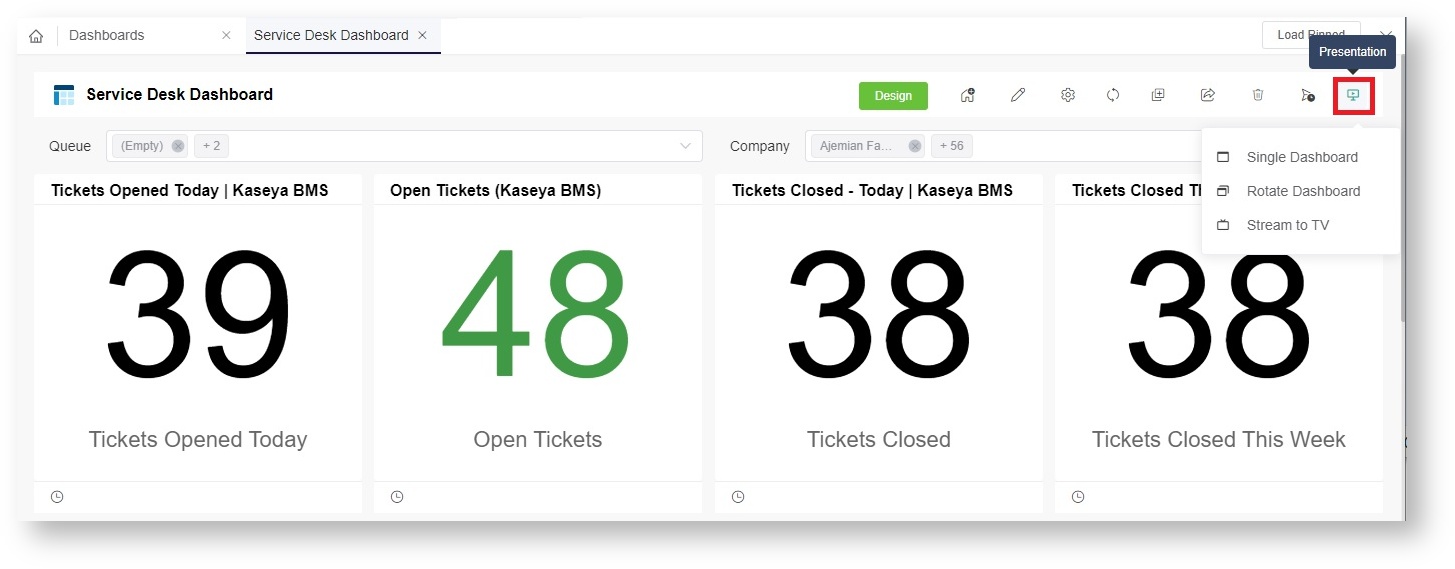
 - Display your dashboard - Click
 and select any of the following options for presenting your dashboard:
Related Topics


 -
-