 N O T I C E
MSPbots WIKI is moving to a new home at support.mspbots.ai![]() to give you the best experience in browsing our Knowledge Base resources and addressing your concerns. Click here
to give you the best experience in browsing our Knowledge Base resources and addressing your concerns. Click here![]() for more info!
for more info!
N O T I C E
MSPbots WIKI is moving to a new home at support.mspbots.ai![]() to give you the best experience in browsing our Knowledge Base resources and addressing your concerns. Click here
to give you the best experience in browsing our Knowledge Base resources and addressing your concerns. Click here![]() for more info!
for more info!
The MSPbots Profit Insights App offers a comprehensive view of your company's financial performance by providing detailed analytics and data-driven insights. It examines financial data such as total billed, gross revenue, effective rate, and contribution rate to give you a clear understanding of your company's profitability, efficiency, and fiscal health. With real-time data presented through dashboards and widgets, business owners, service managers, and key stakeholders can make informed decisions, evaluate performance comprehensively, and take timely action.
What's on this page:
What are the benefits of using the MSPbots Profit Insights App?
The MSPbots Profit Insights App is a valuable tool for analyzing the different aspects of your business like the following:
- Client profitability and service performance - Identify profitable services or clients and costs that impact margins negatively by tracking revenue, expenses, and profitability trends over time.
- Cost analysis - Determine areas where costs can be optimized or reduced.
- Forecasting and planning - Utilize historical data to plan strategically and create forecasts and projections for future revenues, expenses, and overall profitability.
- Identifying growth opportunities - Scale profitable areas and services and explore new avenues for growth from data that helps you understand what's working well financially.
- Risk management - Analyze data to identify and proactively mitigate potential risks before they become significant issues.
Who can use the app?
The MSPbots Profits Insights App dashboards are available to ConnecWise Manage users. Only users with the admin role can modify the settings.
What are the dashboards available in the MSPbots Profit Insights App?
Each of the MSPbots Profits App dashboards offers unique insights into your financial landscape. Below are the dashboard overviews.
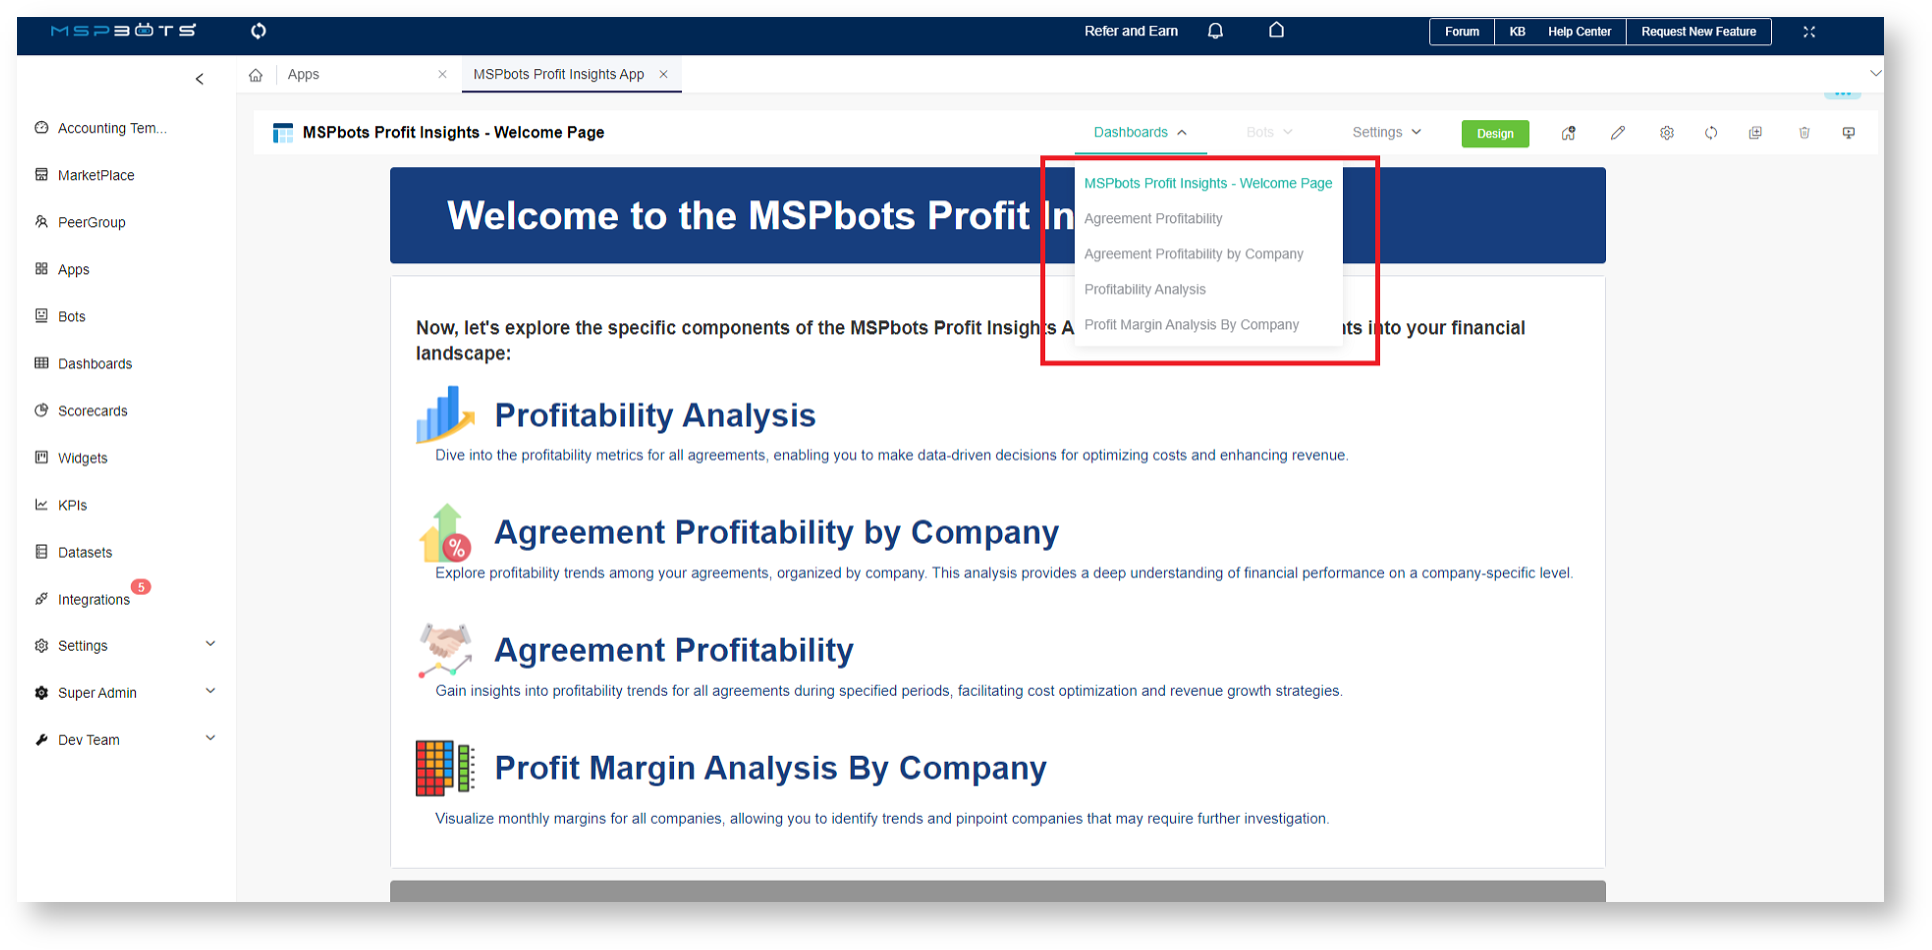
Profitability Analysis Dashboard
The Profitability Analysis dashboard provides a comprehensive overview of the profitability of all agreements within a specified period and enables businesses to assess their revenue, expenses, and profitability across different types of agreements. Use the data in the widgets to make data-driven decisions for optimizing costs and enhancing revenue. 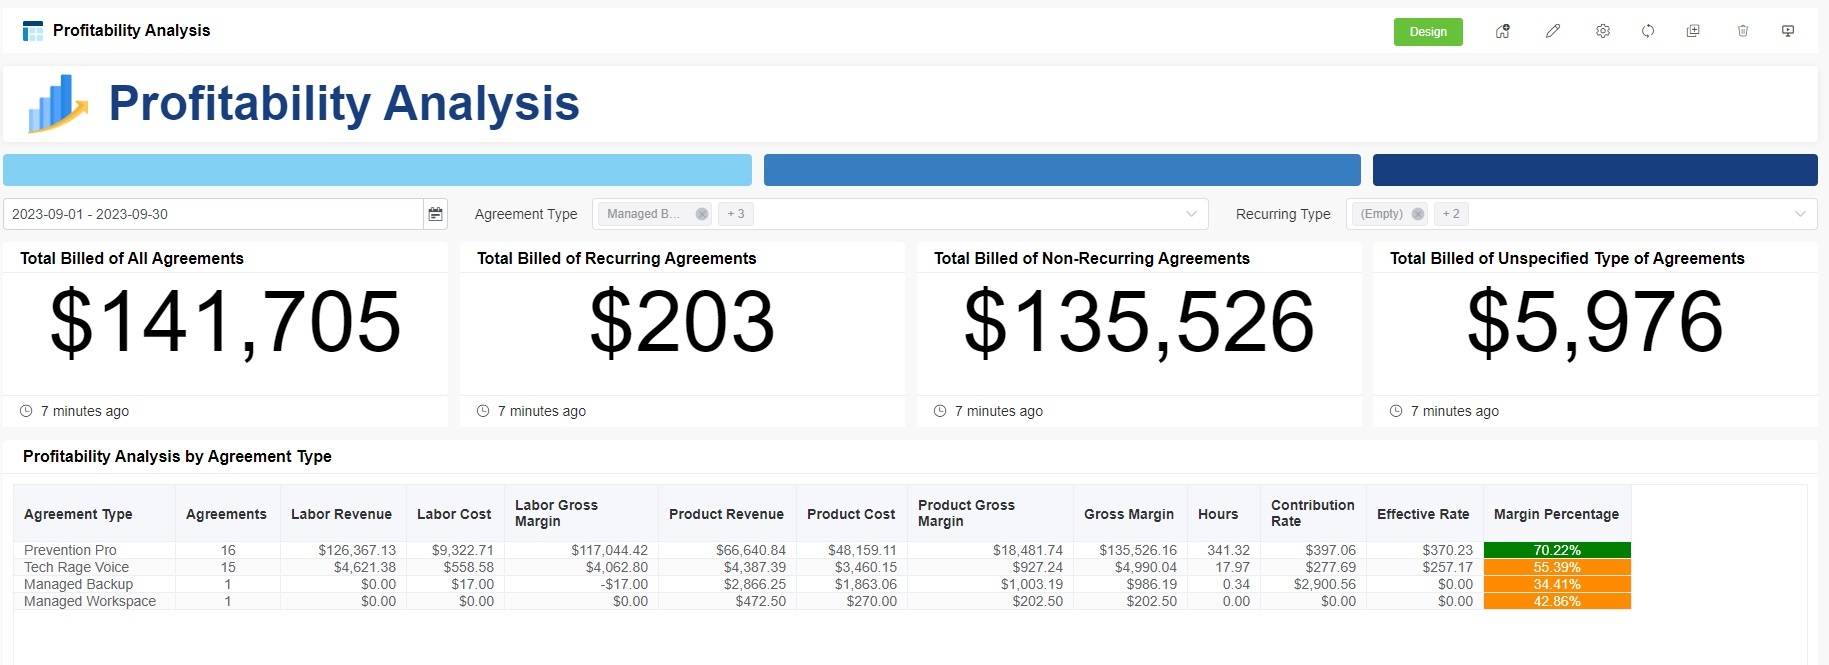
Dashboard Name | Description | Overview |
|---|---|---|
| Profitability Analysis Dashboard | Dive into the profitability metrics for all agreements, enabling you to make data-driven decisions for optimizing costs and enhancing revenue. The Profitability Analysis dashboard provides a comprehensive overview of the profitability of all agreements within a specified time period. This tool enables businesses to assess their revenue, expenses, and profitability across different types of agreements. By utilizing various widgets, users can gain valuable insights into their financial performance and make data-driven decisions to optimize their business strategies. |
|
| Agreement Profitability by Company | Explore profitability trends among your agreements, organized by company. This analysis provides a deep understanding of financial performance on a company-specific level. The Agreement Profitability by Company dashboard offers a detailed analysis of the profitability of all agreements organized by company during a specified time period. This powerful tool not only provides insights into financial performance but also includes crucial trends related to Margin Percentage, Contribution Rate, Total Billed by Recurring Type, and Total Actual Hours by Recurring Type. By examining these key profitability metrics, businesses can gain a comprehensive understanding of their financial health, enabling them to make informed decisions, optimize costs, and formulate strategies for revenue growth and enhanced profitability. |
|
| Agreement Profitability | Gain insights into profitability trends for all agreements during specified periods, facilitating cost optimization and revenue growth strategies. This dashboard offers a comprehensive view of your business's financial performance, with a focus on key metrics such as monthly trends in total billed, gross revenue, and margin. In addition to tracking these critical indicators, the dashboard also provides leader boards highlighting the top 10 companies with the highest and lowest gross revenue. This valuable information empowers businesses to monitor their financial health, make informed decisions, and identify areas for improvement. |
|
| Profit Margin Analysis By Company | Visualize monthly margins for all companies, allowing you to identify trends and pinpoint companies that may require further investigation. This dashboard features a heatmap showcasing monthly margins for all companies, enabling users to visualize trends and identify companies worthy of further investigation. |
|
| (SETTINGS) ConnectWise Manage Agreement Type | This contains settings for dashboards under the MSPbots Profit Insights App for ConnectWise Manage Integration. Users can set the Addition Calculation and Agreement Category settings. |


What are the key financial terms, metrics and calculations featured in the MSPbots Profit Insights App?
Within our widgets, you'll find a comprehensive set of financial metrics designed to provide valuable insights into your business's financial performance. These metrics, along with their calculations, include:
Term/ Metric | Definition/Calculation |
|---|---|
| Product Gross Margin | Product Revenue - Product Cost |
| Labor Gross Margin | Labor Revenue - Labor Cost |
| Gross Margin | Total Revenue - (Labor Cost + Product Cost) |
| Margin % or Margin Percentage | (Gross Margin ÷ Total Revenue) * 100 |
| Effective Rate | Labor Revenue ÷ Total Actual Hours |
| Contribution Rate | (Total Billed - (Labor Cost + Product Cost)) ÷ Total Actual Hours |
| Margin | Profit ÷ Billed |
| Actual Hours | Total recorded hours for an agreement |
These metrics offer a comprehensive view of your financial health, efficiency, and profitability. Understanding and utilizing these calculations within your widgets can help guide data-driven decisions, optimize costs, and strategize for revenue growth.
How to start using the app
Here are the steps for setting up the MSPbots Profit Insights App:
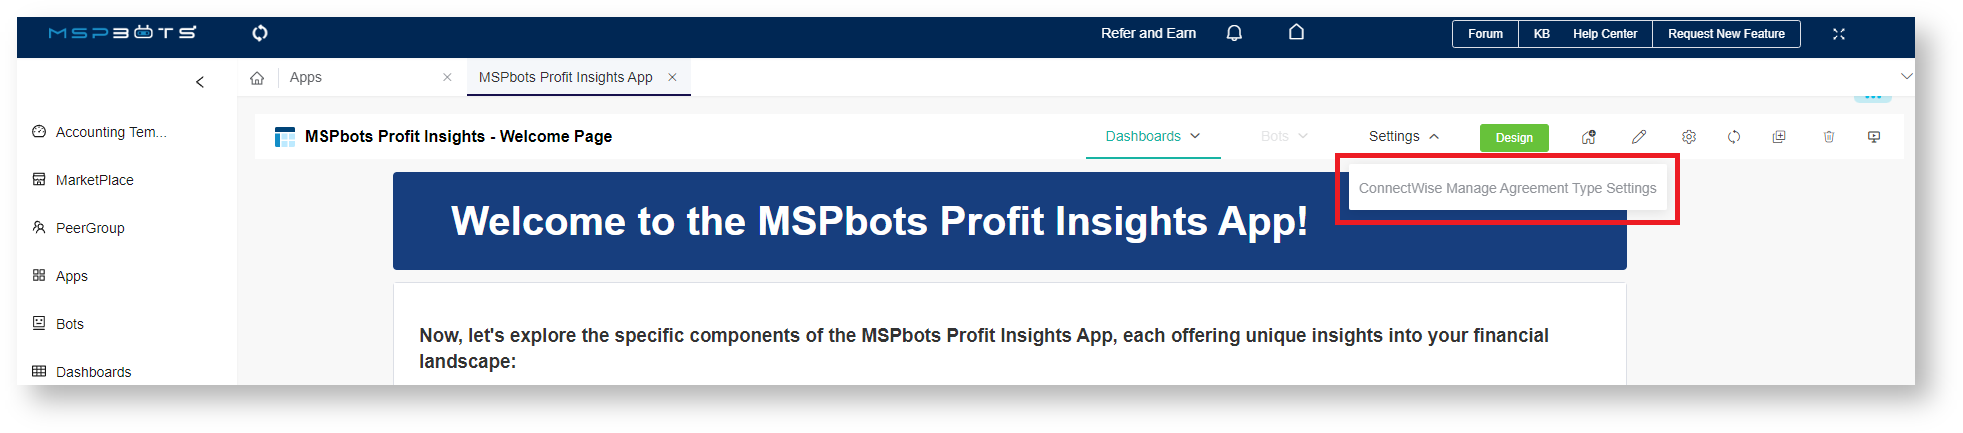
- Navigate to Apps, find the MSPbots Profit Insights App, and click it.
- Hover over Settings and select ConnectWise Manage Agreement Type Settings.
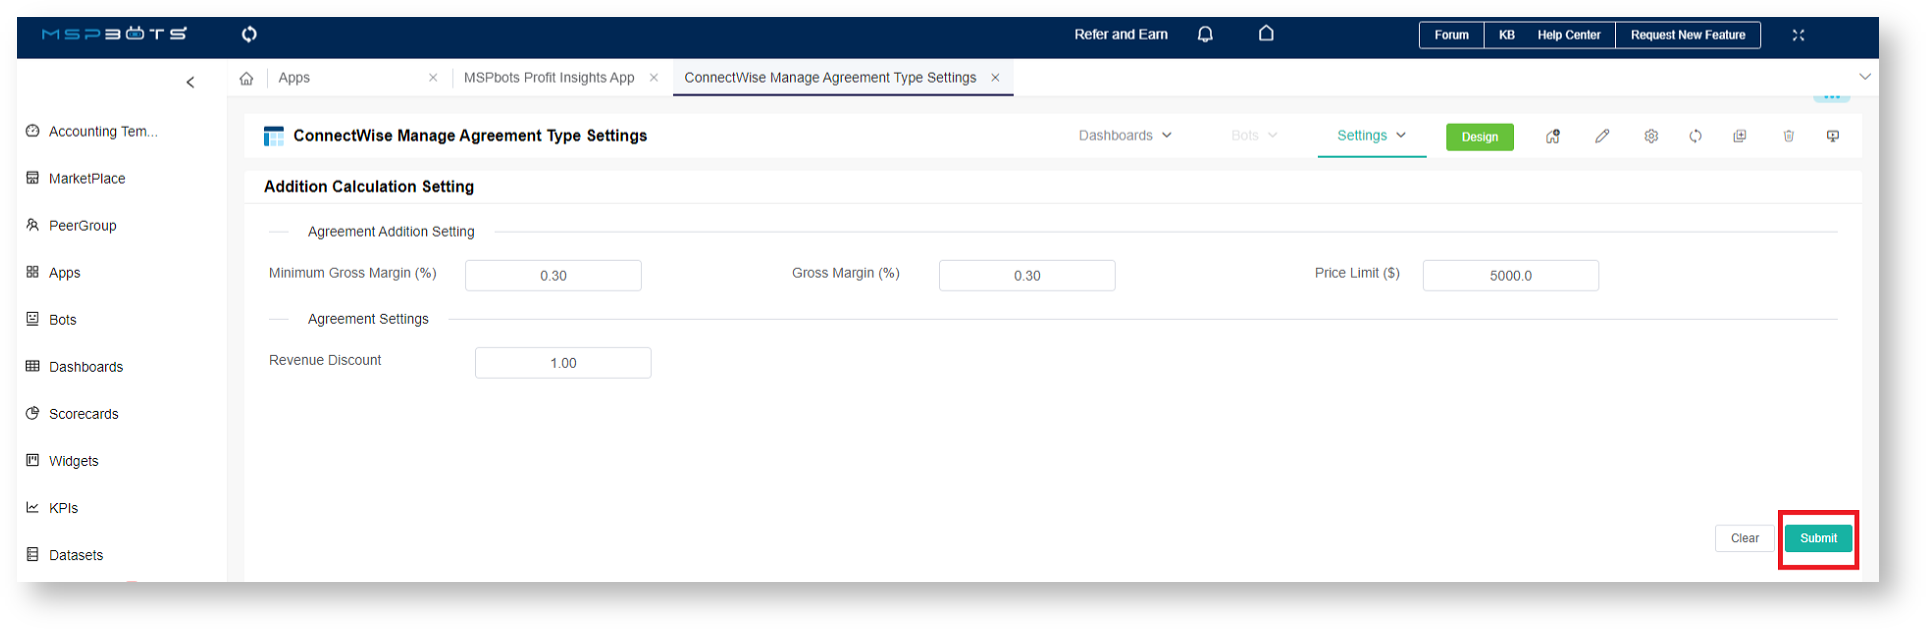
3. When the ConnectWise Manage Agreement Type Settings tab opens, go to the Addition Calculation Setting section and input your company's Agreement Addition Settings and Agreement Settings.
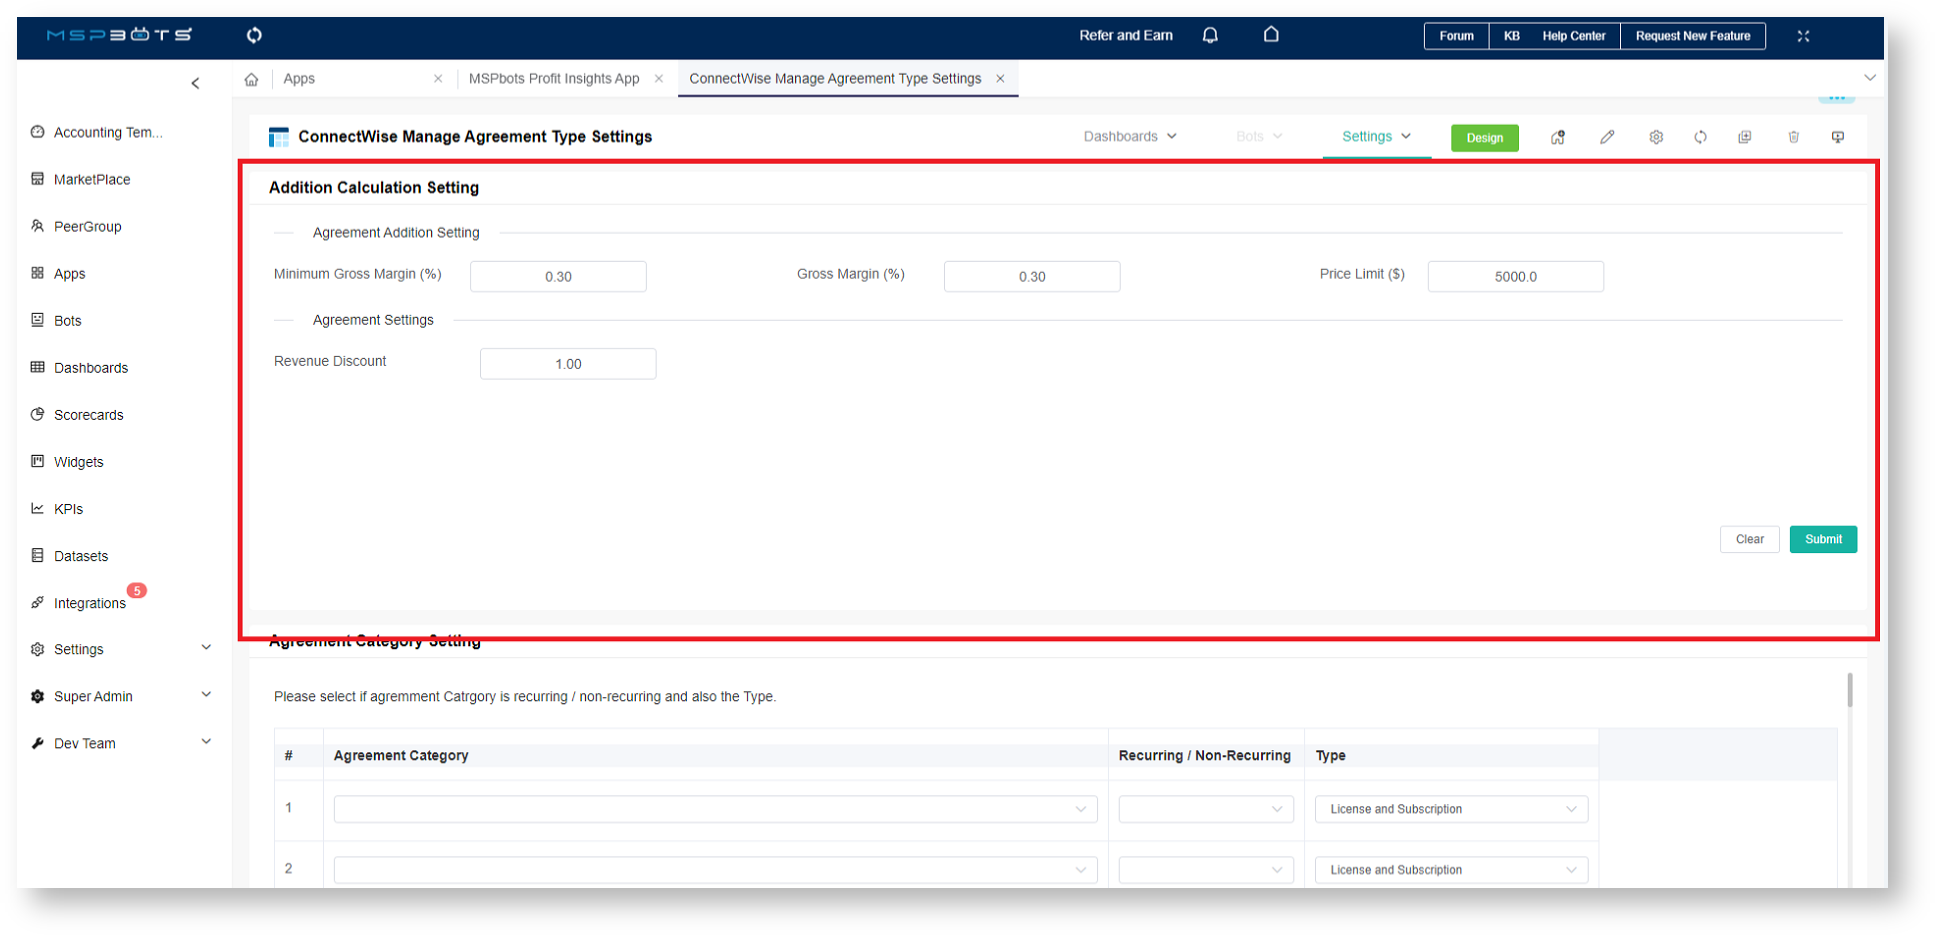
4. Click Submit to save.
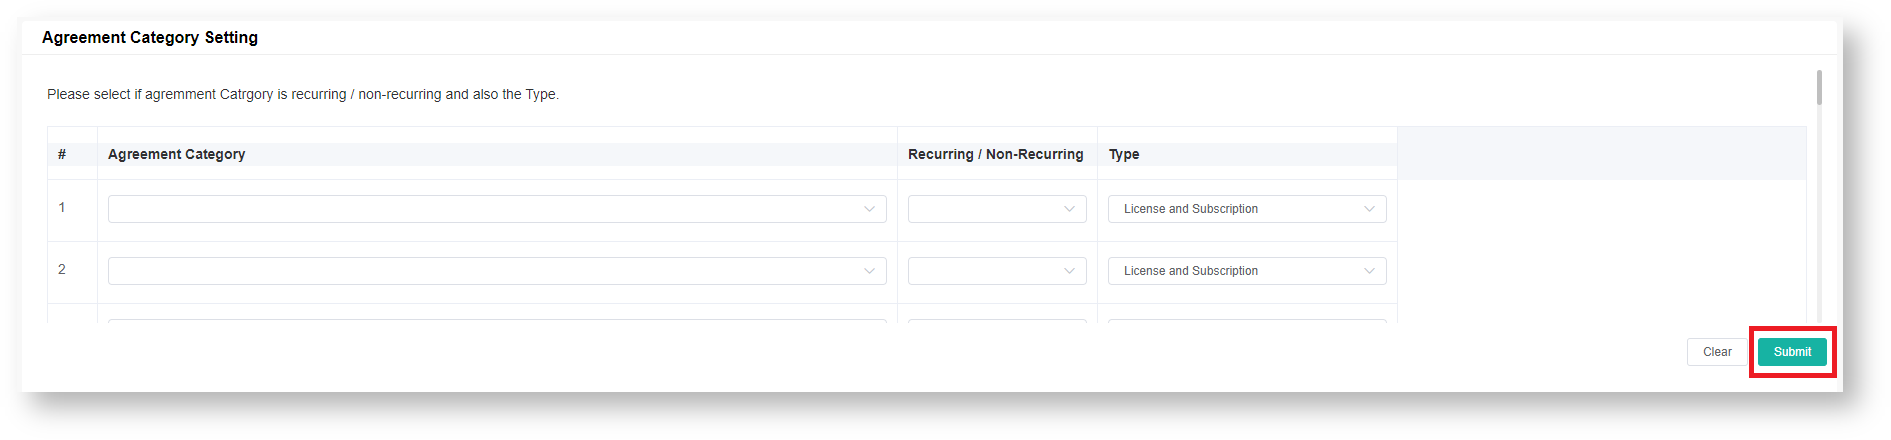
5. Then enter your Agreement Category Settings as well.
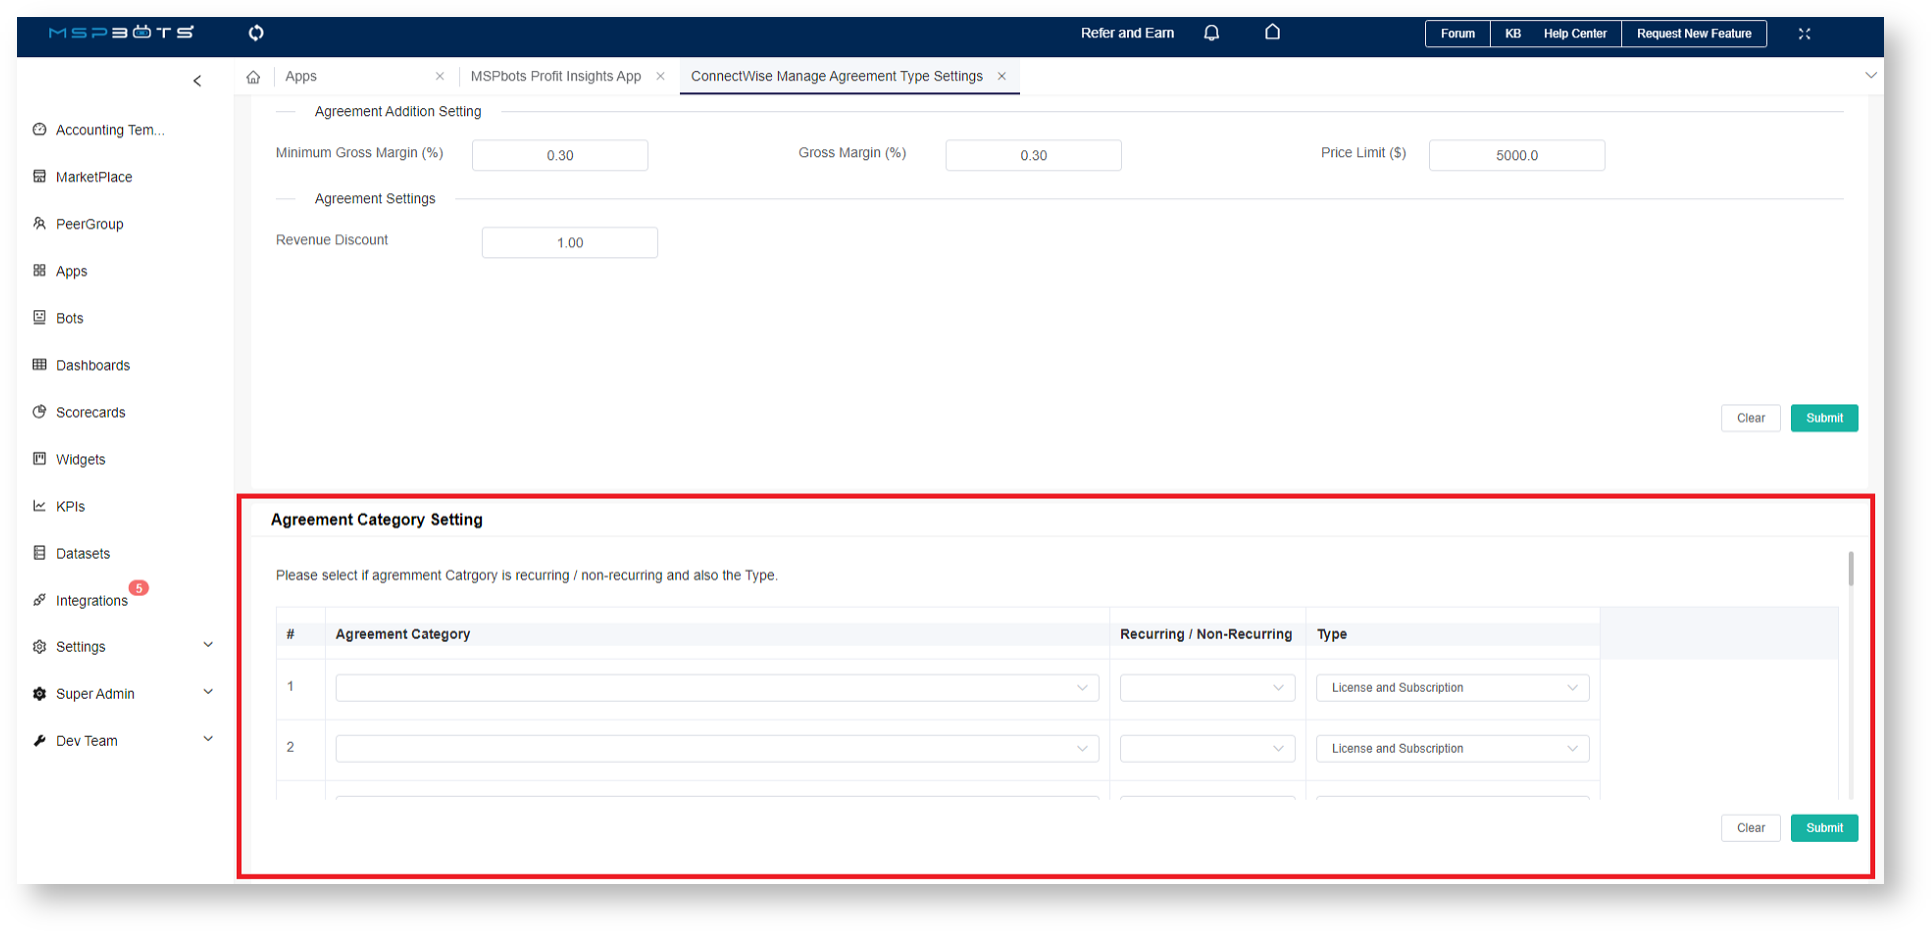
6. Click Submit to save.
7. When done with settings, you are ready to view the data in the dashboards. Hover over the Dashboards and click any of the following to view the results:
Overview
Content Tools
N O T I C E
MSPbots WIKI is moving to a new home at support.mspbots.ai![]() to give you the best experience in browsing our Knowledge Base resources and addressing your concerns. Click here
to give you the best experience in browsing our Knowledge Base resources and addressing your concerns. Click here![]() for more info!
for more info!