 N O T I C E
MSPbots WIKI is moving to a new home at support.mspbots.ai![]() to give you the best experience in browsing our Knowledge Base resources and addressing your concerns. Click here
to give you the best experience in browsing our Knowledge Base resources and addressing your concerns. Click here![]() for more info!
for more info!
Page History
...
| Widgets | Description | When to Use |
|---|---|---|
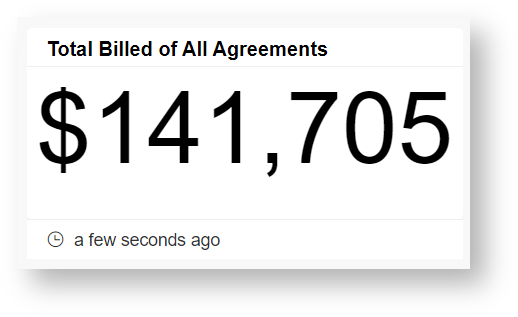
Total Billed of All Agreements | This widget displays the total amount billed across all agreements within the selected time frame. It offers a holistic view of revenue generated from all types of agreements. |
Use the Total Billed of All Agreements widget to quickly assess the total revenue generated by all agreements, providing an overview of your financial performance. |
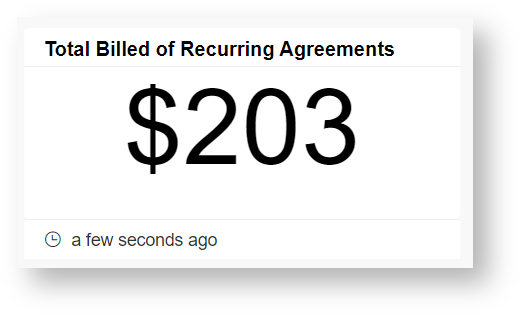
Total Billed of Recurring Agreements | This widget displays the total billed amount for recurring agreements. Recurring agreements typically involve regular payments, such as subscriptions or service contracts. |
The Total Billed of Recurring Agreements widget helps distinguish between ongoing revenue streams and one-time transactions.
|
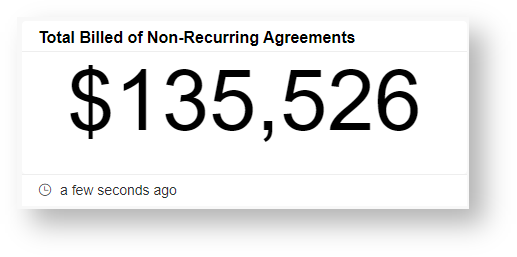
Total Billed of Non-Recurring Agreements | This widget presents the total billed amount for non-recurring agreements. Non-recurring agreements typically involve one-time transactions, such as product sales or project-based services. |
The Total Billed of Non-Recurring Agreements widget also helps distinguish between ongoing revenue streams and one-time transactions. |
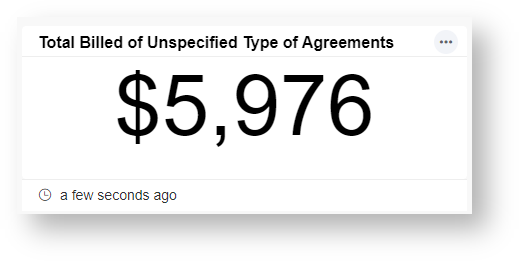
Total Billed of Unspecified Type of Agreements | This widget tracks the total billed amount for agreements with unspecified or undefined types and may include agreements that lack clear classification or labeling. |
The Total Billed of Unspecified Type of Agreements widget can highlight agreements that require further classification or attention.
|
Profitability Analysis by Agreement Type | This widget provides a breakdown of profitability based on different agreement types. It allows users to assess which types of agreements contribute the most to overall profitability. |
The Profitability Analysis by Agreement Type widget identifies the most profitable agreement categories and those that contribute significantly to revenue.
|
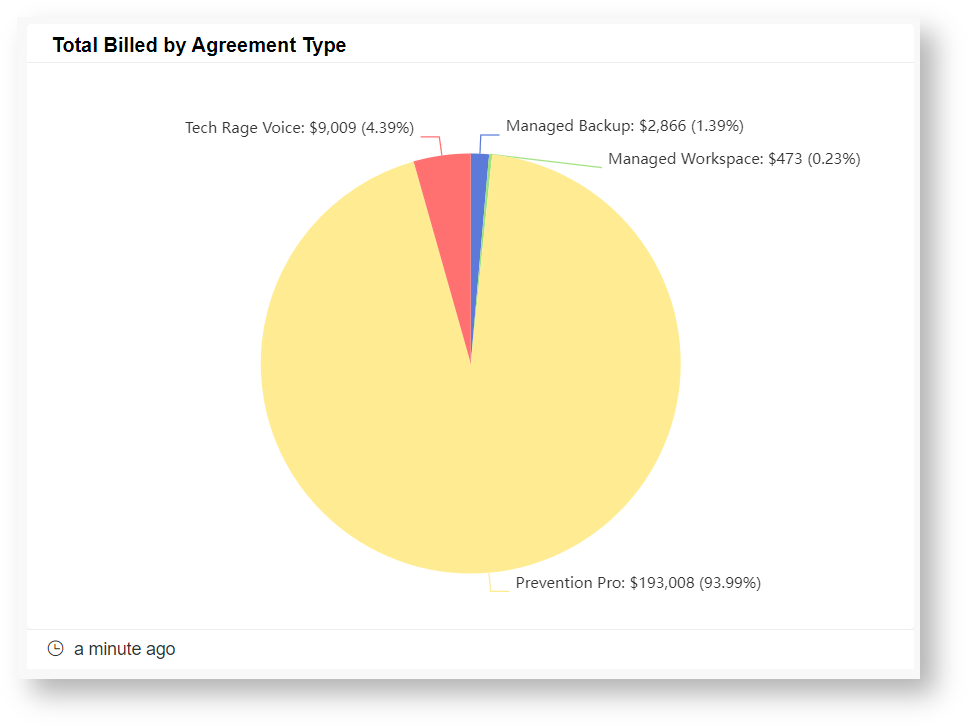
Total Billed by Agreement Type | This widget displays the total billed amount categorized by agreement types. It helps users understand the revenue distribution across various agreement categories. |
The Total Billed by Agreement Type widget also identifies which agreement categories are most profitable and contribute significantly to revenue. |
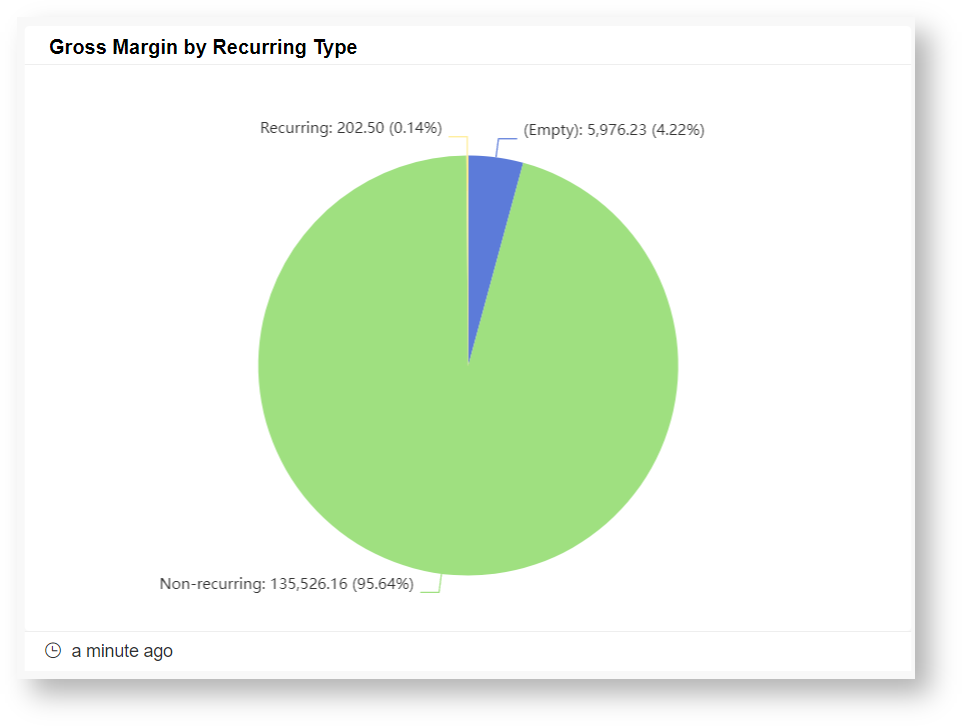
Gross Margin by Recurring Type | This widget focuses on the gross margin of recurring agreements. Gross margin is a critical indicator of profitability, representing the difference between revenue and the cost of goods or services sold. |
Use the Gross Margin by Recurring Type widget to assess the profitability of recurring agreements. |
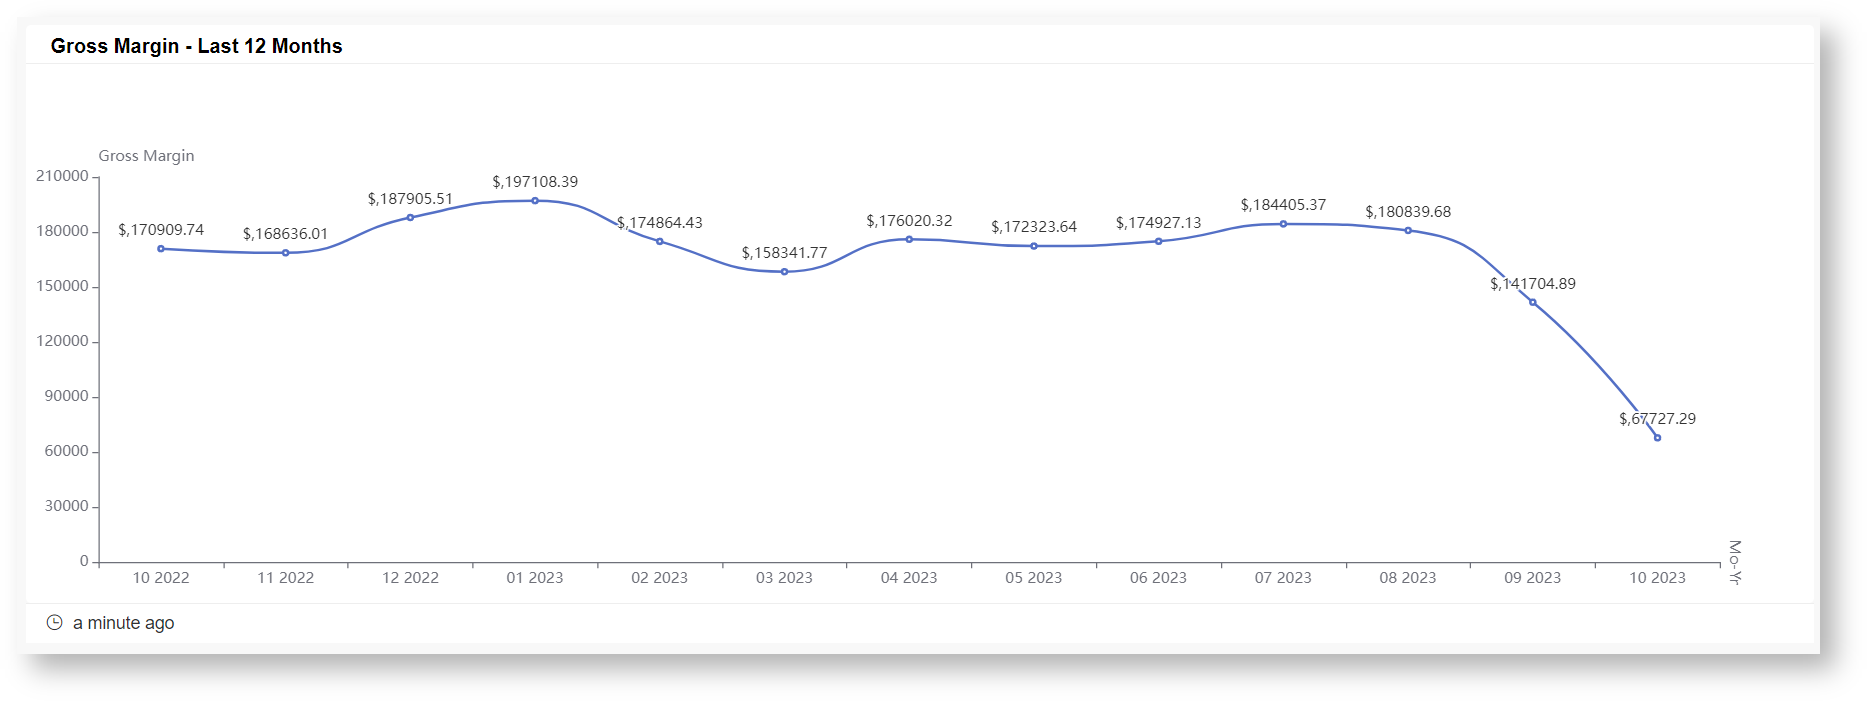
Gross Margin - Last 12 Months | This widget provides an overview of the gross margin for the past 12 months. Monitoring gross margin trends over time can help identify areas for improvement or growth. |
Use the Gross Margin - Last 12 Months widget to track trends over time. |
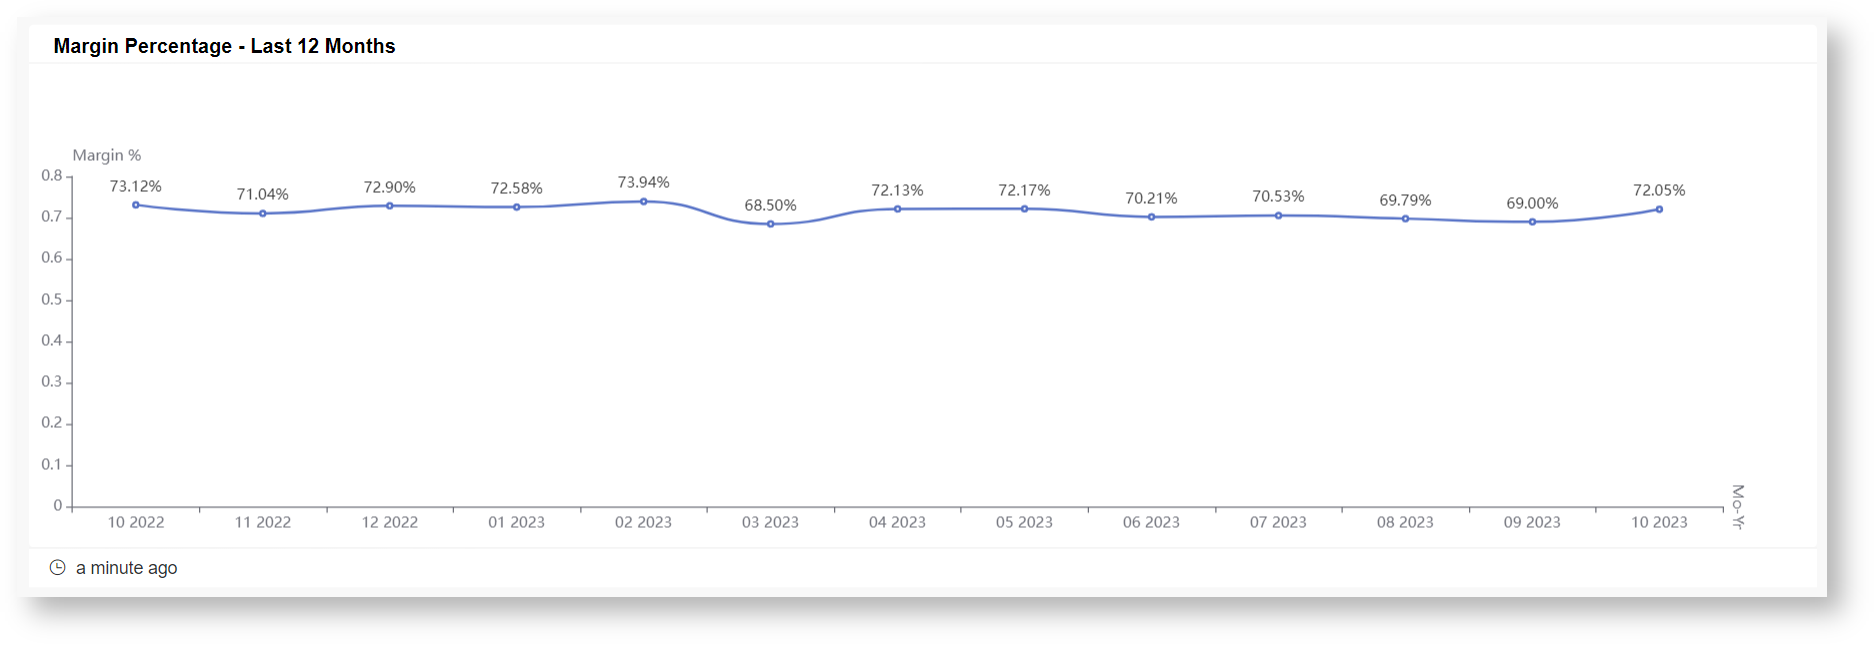
Margin Percentage - Last 12 Months | This widget calculates and displays the margin percentage for the last 12 months. Margin percentage is a key performance metric that reflects the profitability of agreements relative to their costs. |
Use the Margin Percentage - Last 12 Months widget to get insight into the percentage of revenue retained as profit. |
...
The Agreement Profitability Dashboard serves as a powerful tool for monitoring financial performance, identifying trends, and fostering data-driven decision-making. Regularly reviewing these widgets empowers businesses to optimize their profitability and ensure sustainable growth. Below are the widgets in the Agreement Profitability Dashboard.
| Widget | Description | When to use |
|---|---|---|
| Agreement Revenue Trend | This widget displays the monthly trend of total billed amounts, providing insights into the revenue generated by your agreements over time. Analyzing this trend helps you understand the growth or fluctuations in revenue. | Revenue and Margin Trends: Utilize the "Agreement Revenue Trend" and "Agreement Gross Margin Trend" widgets to track the monthly performance of your agreements. Identify patterns, spikes, or dips in revenue and margin to guide strategic decisions. |
| Agreement Gross Margin Trend | The Agreement Gross Margin Trend widget illustrates the monthly trend in gross revenue, which represents the total revenue minus the cost of goods or services sold. Monitoring this trend is essential for assessing your profitability over time. | Revenue and Margin Trends: Utilize the "Agreement Revenue Trend" and "Agreement Gross Margin Trend" widgets to track the monthly performance of your agreements. Identify patterns, spikes, or dips in revenue and margin to guide strategic decisions. |
| Contribution Rate - Last 12 Months | Contribution rate widget shows the monthly trend of contribution rates over the last 12 months. Contribution Rate is computed as: Contribution Rate = (Total Billed - (Labor Cost + Product Cost)) / Total Actual Hours It provides insights into your ability to generate profit from your revenue while accounting for labor and product costs. | Regularly review the "Margin Percentage - Last 12 Months" and "Contribution Rate - Last 12 Months" widgets to assess your overall profitability. These metrics can guide cost control and revenue enhancement efforts while considering labor and product costs. |
| Margin Percentage - Last 12 Months | This widget calculates and displays the margin percentage for the last 12 months. Margin percentage is a key indicator of profitability, showing the percentage of revenue retained as profit after covering costs. Computation: | Regularly review the "Margin Percentage - Last 12 Months" and "Contribution Rate - Last 12 Months" widgets to assess your overall profitability. These metrics can guide cost control and revenue enhancement efforts while considering labor and product costs. |
| Leader Board - Top 10 Highest Gross Revenue | This grid widget presents a leaderboard showcasing the top 10 companies with the highest gross revenue. It allows you to quickly identify your top-performing clients or partners. | Identifying Top Performers: The "Leader Board - Top 10 Highest Gross Revenue" widget enables you to identify and recognize your top-performing clients or partners. This information can inform relationship management and growth strategies |
| Leader Board - Top 10 Lowest Gross Revenue | Similar to the previous leaderboard, this grid widget highlights the top 10 companies with the lowest gross revenue. It can help pinpoint areas where revenue generation may need improvement or where further analysis is required. | Addressing Underperformers: The "Leader Board - Top 10 Lowest Gross Revenue" widget helps identify areas where revenue generation may be falling short. Use this data to investigate and address issues that may be affecting certain agreements. |
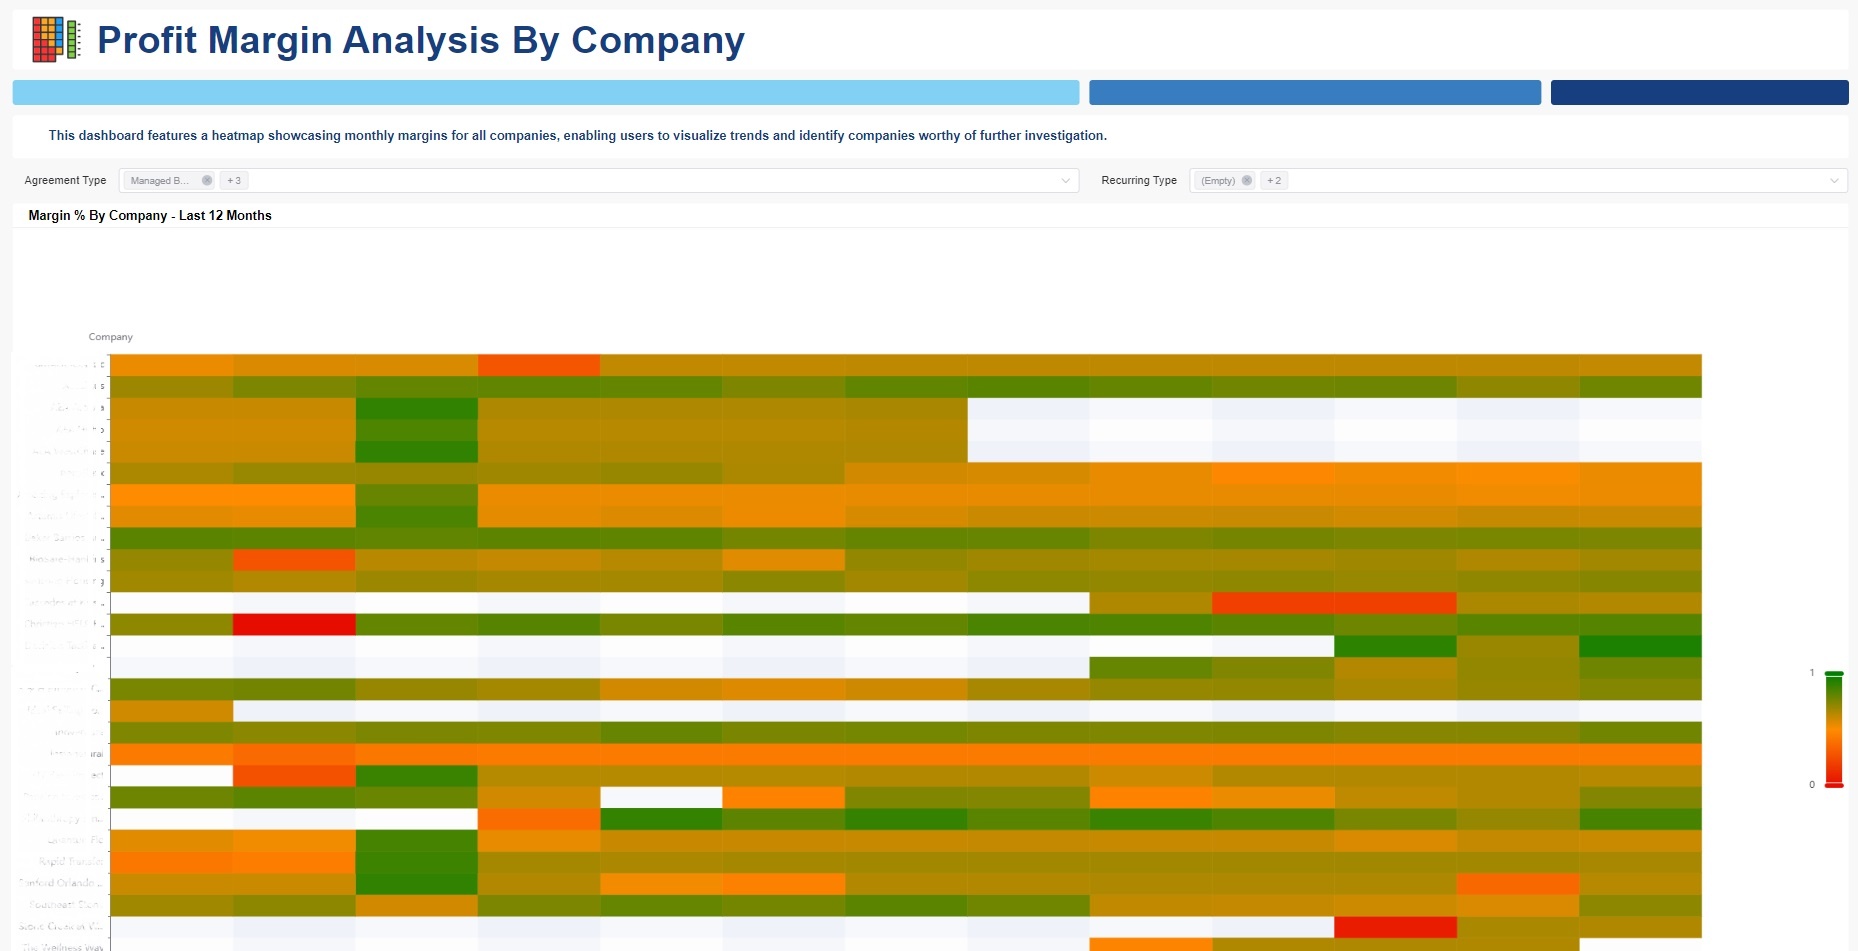
Profit Margin Analysis By Company
...
Below is the widget in the Profit Margin Analysis by Company Dashboard.
| Widget | Description | When to use |
|---|---|---|
| Margin % By Company - Last 12 Months | This heatmap widget presents a graphical representation of monthly margin percentages for all companies over the last 12 months. Each cell in the heatmap corresponds to a specific company and month, with colors indicating the margin percentage. Users can easily discern patterns and variations in profitability across different companies and periods. | Use this widget to get a visual snapshot of how each company's profitability has evolved over the past year and spot trends, such as improving or declining profitability, across your organization. |
What are the key financial terms, metrics, and calculations featured in the MSPbots Profit Insights App?
...
4. Click Submit to save.
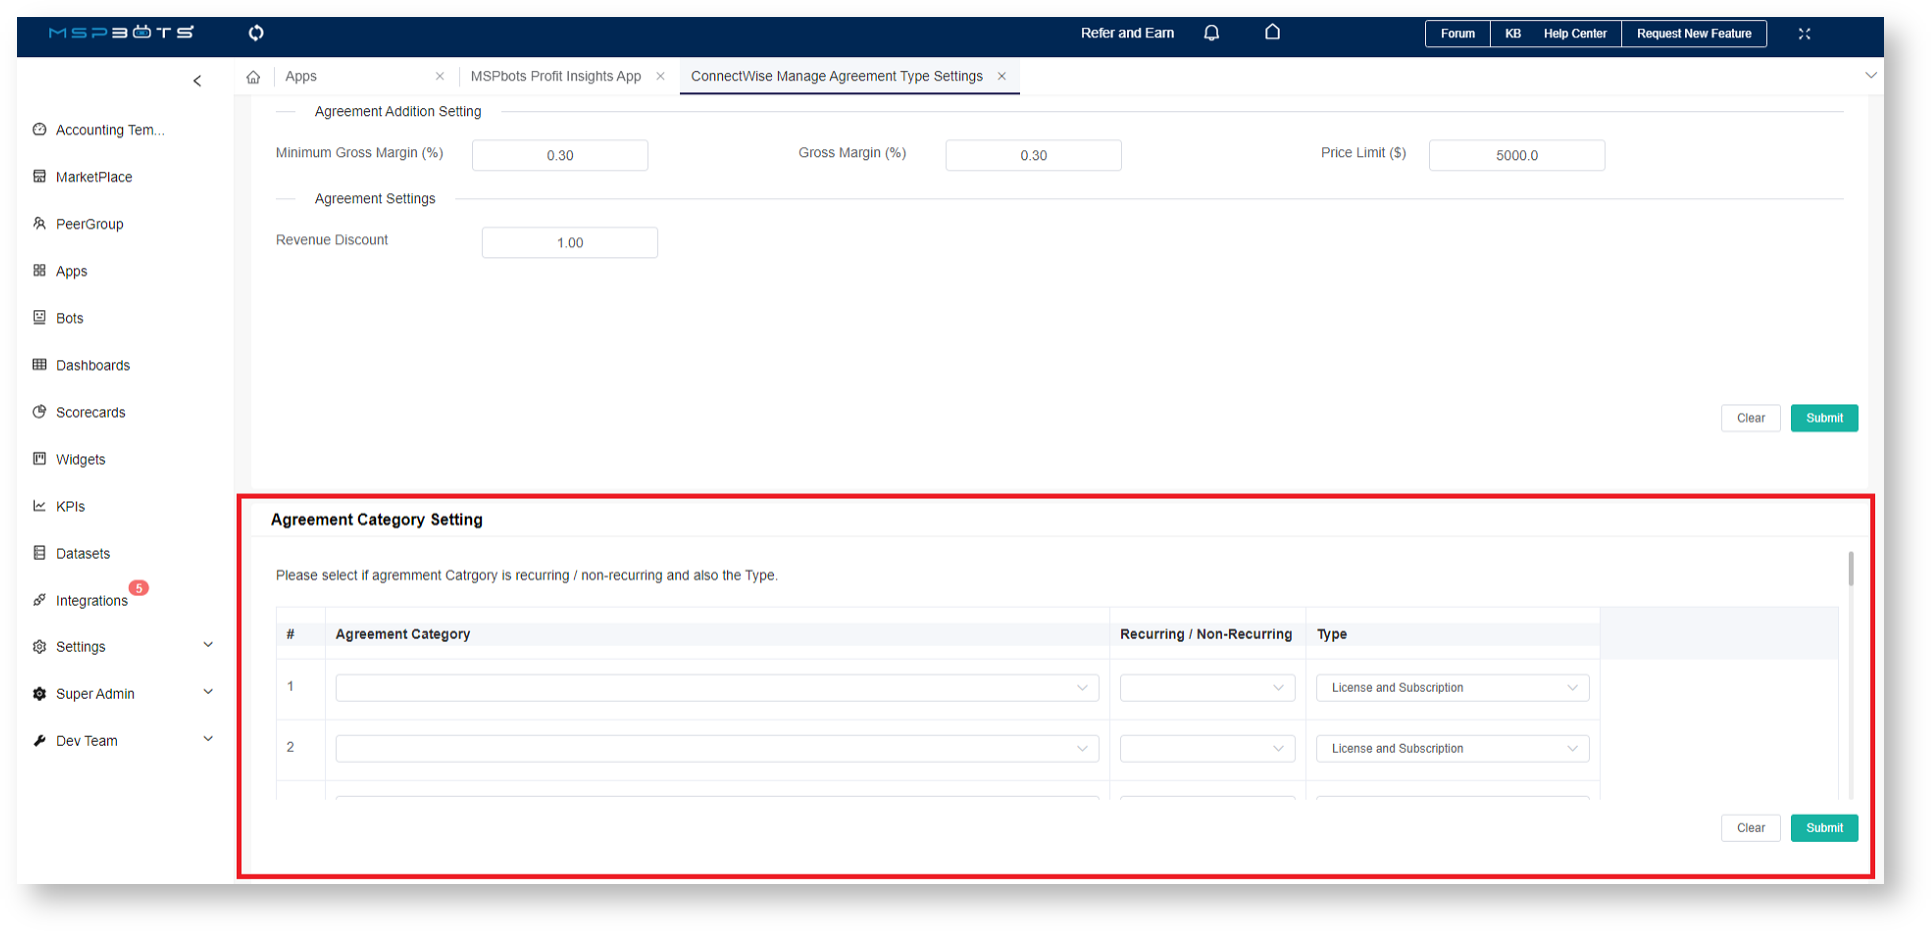
Adjusting the Agreement Category Settings
- In the ConnectWise Manage Agreement Type Settings, go to the section on Agreement Category Settings.
- Enter your preferred settings.
- Click Submit to save.
- When done with settings, you are ready to view the data in the dashboards. Hover over the Dashboards and click any of the following to view the results:
...
