 N O T I C E
MSPbots WIKI is moving to a new home at support.mspbots.ai![]() to give you the best experience in browsing our Knowledge Base resources and addressing your concerns. Click here
to give you the best experience in browsing our Knowledge Base resources and addressing your concerns. Click here![]() for more info!
for more info!
Page History
This app provides insights on key metrics such as Profit Margin, Effective Rate, and Contribution Rate to enable Business Owners and Service Managers in ensuring that all of their agreements are profitable. A breakdown of these metrics per agreement type/company as well as trend graphs are included so that it would be easy for users to determine whether agreements are priced correctly or if agreement labor costs should be managed more effectively.
Table of Contents
List of Dashboards
Dashboard Name | Description |
|---|---|
| Agreement Profitability - Summary | This dashboard shows total billed, margin, effective rate, contribution rate, and profit per agreement type. It also contains graphs showing the monthly trend for the KPIs. |
| Agreement Profitability - Agreement Details | This dashboard shows a breakdown of the same key metrics from the Summary Dashboard but on a per agreement-company level. It also contains graphs that show the trend of the following: labor hours vs the target, profit margin %. |
| Agreement Profitability - Margin Review | This dashboard contains a table that displays all companies under each agreement type with their monthly margins. This allows users to see the trend and determine which companies should be looked into. |
| Agreement Profitability - Effective Rate | This dashboard shows effective rates per customer and agreement type with breakdown of billed, addition costs, and labor hours. |
| (SETTINGS) ConnectWise Settings for App Packages | This contains settings for dashboards under Financial and Team Utilization suites for ConnectWise Manage Integration. For Financial, users can set the Target Profit Margin for computation of the Target Hours. |
Terms and Calculations
Term | Definition/Calculation |
|---|---|
| Value | Sum of addition price for all agreements If annual, monthly value is from Total Value divided by 12 If monthly, with addition price, Value = addition price |
| Billed | Total billed of invoices |
| Profit | Billed - (Addition Costs + Labor Costs) |
| Margin | Profit / Billed |
| Addition Costs | Product cost for an agreement |
| Actual Labor Hours | Total recorded hours for an agreement |
| Effective Rate | (Billed - Addition Costs) / Labor Hours |
| Contribution Rate | Profit / Labor Hours |
| Target | Budgeted hours to achieve a certain profit margin |
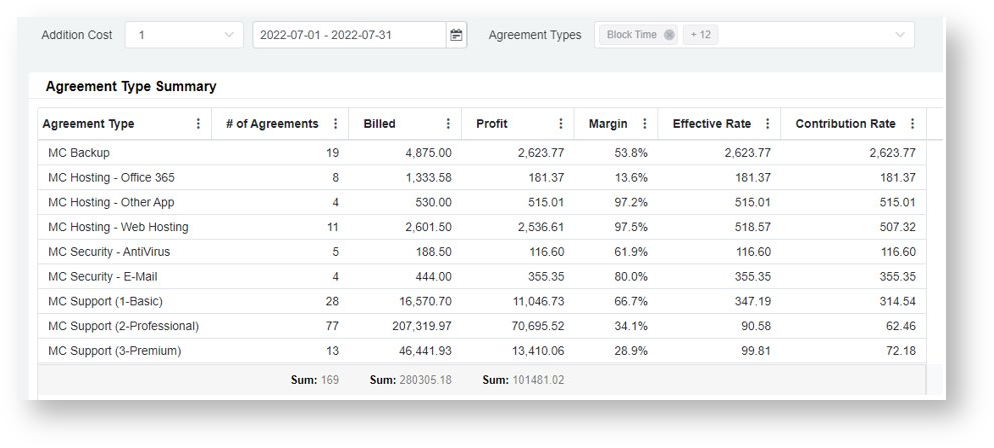
Agreement Profitability - Summary Dashboard
The Summary dashboard shows total billed, margin, effective rate, contribution rate, and profit per agreement type. It also contains graphs showing the monthly trend for the KPIs.
Available slicers are: Addition Cost (Exclude, Include), Date Range (Invoice Date), Agreement Types

Agreement Profitability - Agreement Details Dashboard
The Agreement Details dashboard shows a breakdown of the same key metrics from the Summary Dashboard but on a per agreement-company level. It also contains graphs that show the trend of the following: labor hours vs the target, profit margin.
Available slicers are: Addition Cost (Exclude, Include), Date Range, Agreement Types

Agreement Profitability - Margin Review
The Margin Review dashboard contains a table that displays all companies under each agreement type with their monthly margins. This allows users to see the trend and determine which companies should be looked into.
Available slicers are: Company, Date Range, Agreement Types

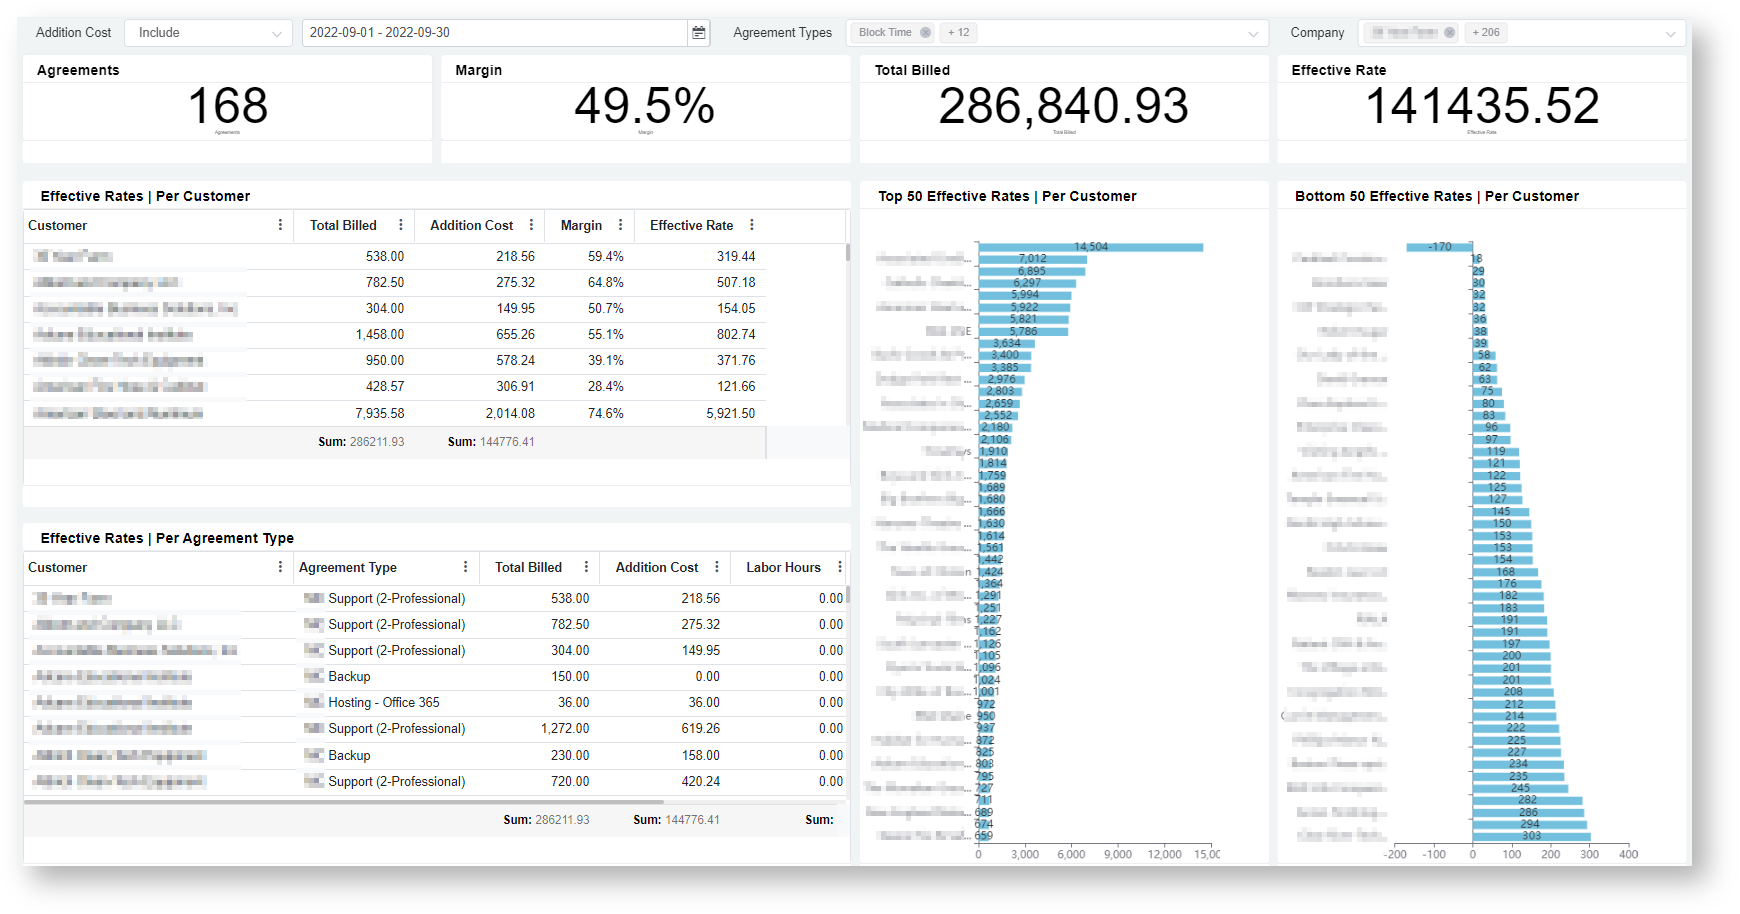
Agreement Profitability - Effective Rate
This dashboard shows effective rates per customer and agreement type with breakdown of billed, addition costs, and labor hours.
Available slicers are: Addition Cost (Exclude, Include), Date Range, Agreement Types
ConnectWise Settings for App Packages
Target Margin Settings: Users can set the Target Profit Margin for computation of the Target Hours.

Overview
Content Tools